
Definition of an Enriched GIS Network for Evacuation Planning
Evans Etrue Howard
1 a
, Lorenza Pasquini
1 b
, Claudio Arbib
1 c
, Antinisca Di Marco
1 d
and Eliseo Clementini
2 e
1
Department of Information Engineering, Computer Science, and Mathematics, University of L’Aquila, L’Aquila, Italy
2
Dept. of Industrial and Information Engineering and Economics, University of L’Aquila, L’Aquila, Italy
evans.etruehoward@graduate.univaq.it, lorenza.pasquini@student.univaq.it,
Keywords:
GIS, Network, Graph, Disaster Management, Evacuation Planning, Optimization Model, Flow Model.
Abstract:
Among the most serious natural disasters, earthquakes cause severe damages to infrastructures and building,
can kill or injure thousands of humans and animals and, in the luckiest circumstances, just make people
homeless destroying communities, habitats, economies and mental equilibrium. In order to minimise the loss
of lives, an effective evacuation plan to cope with worldwide disasters is required. In this paper we describe
a novel approach to timely formulate an evacuation plan of an area struck by an earthquake. The proposed
solution leverages on a two-steps modeling framework: i) a method that extracts from enriched GIS data a
network description of the area to be evacuated; ii) a dynamic optimization model that calculates the safest
paths citizens should follow to reach pre-identified safe areas. While the network is computed off-line at
design time, the optimization model, or one of its reductions, can be embedded in a real-time system that,
recomputing it several times, can guide citizen after a natural disaster even in case of high dynamic scenario.
Our approach is demonstrated on a real study case: the medieval center of the Italian town of Sulmona, for
which detailed GIS data with information on the urban structure and building vulnerability are available.
1 INTRODUCTION
Every day, natural disasters all around the world fill
the reports of newspapers, radio, tv and other media.
Supranational organisations typically define disaster
according to their line of work. For the World Health
Organization (WHO), a disaster is an occurrence dis-
rupting the normal conditions of existence and caus-
ing a level of suffering that exceeds the capacity of ad-
justment of the affected community (W.H.O., 1999).
According to the United Nations Internationals Strat-
egy for Disaster Reduction (UN-ISDR), a disaster is
“a serious disruption in the functioning of the commu-
nity or a society causing wide spread material, eco-
nomical, social and environmental losses that exceed
the ability of affected society to cope using its own
resources (Mahar et al., 2013).” Gunns (Gunn, 2003)
focuses more on causes than on consequences, and
defines a disaster as the result of a vast ecological
a
https://orcid.org/0000-0002-6267-2713
b
https://orcid.org/0000-0002-5759-858X
c
https://orcid.org/0000-0002-0866-3795
d
https://orcid.org/0000-0001-7214-9945
e
https://orcid.org/0000-0002-3057-7105
breakdown in the relations between man and environ-
ment. Three conditions should occur in an event to
render it a disaster: it must disrupt the normal con-
ditions of life, exceed the local capacity of recovery,
and affect a relevant amount of people (without peo-
ple, there would be no disaster but just a physical phe-
nomenon (W.H.O., 1999)).
Every year, more than 500 disasters are estimated
to strike our planet, killing around 75,000 people and
impacting more than 200 million others (Van Wassen-
hove, 2006). Among recent disasters, either natural
(earthquakes, volcanic eruptions, landslides, floods,
tsunamis, hurricanes, typhoons) or provoked by man
(terrorist attacks, chemical or nuclear leakages etc.),
the most remarkable losses were recorded in: the
earthquakes of Nepal (April 2015), Japan (March
2011), Haiti (January 2010), Chichi (Taiwan, Septem-
ber 1999), Bam (Iran, December 2003), Kashmir
(Pakistan, October 2005), and Chile (May 1960); var-
ious tsunamis in Japan and the Indian Ocean; the ma-
jor hurricanes Katrina, Rita, and Sandy in the US; and
the 9/11 attacks in US (Pyakurel et al., 2019).
Relatively limited in space, yet mostly concen-
trated on an urban area, the 2009 L’Aquila earthquake
Howard, E., Pasquini, L., Arbib, C., Di Marco, A. and Clementini, E.
Definition of an Enriched GIS Network for Evacuation Planning.
DOI: 10.5220/0010452302410252
In Proceedings of the 7th International Conference on Geographical Information Systems Theory, Applications and Management (GISTAM 2021), pages 241-252
ISBN: 978-989-758-503-6
Copyright
c
2021 by SCITEPRESS – Science and Technology Publications, Lda. All rights reserved
241

(Italy) unveiled unprecedented challenges for logis-
tics planners. The earthquake caused vast damages
to the town and to its infrastructures, which crum-
bled, and existing emergency response systems were
destroyed. This resulted in a very grim situation:
besides 309 casualties (Alexander, 2010), approxi-
mately 1,500 people were injured and over 65,000
lose their homes (Hooper, 2009).
The persisting threat of disasters of this type re-
sults in a massive safety demand that, however, un-
fortunately exceeds the resources available to make
houses and infrastructures intrinsically safe: there-
fore, effective emergency plans to cope with disas-
ters will continue to be a need worldwide. System-
atic plans of emergency logistics are however very
often neglected. The Fritz Institute (F.I., 2005) re-
ported that logistics planning during the 2004 Indian
Ocean tsunami was conducted with no computer sup-
port and without the presence of logistics experts. In-
stead, most impacts of catastrophes can be mitigated
by planning in advance and adopting specific mea-
sures of disaster management (Alexander, 2002).
The use of a GIS system is very often related to
the analysis of transport networks. To do this there
are specific GIS systems called GIS-T that require
new data structures to represent the complexities of
transportation networks. Manfred M. Fischer shows
in his book (Fischer, 2006) how to identify several
improvements of the traditional network data model
that are needed to support advanced network analysis
in a ground transportation context. Deelesh Mandloi
et al. (Mandloi and Thill, 2010) presented an object-
oriented data model to represent the multi-modal, in-
door/outdoor transportation network of an urban area
that can be used for route planning and navigation and
to perform other network analyses.
In this paper, we describe our first attempt to de-
velop an emergency evacuation plan for potential dis-
aster (earthquake) sites. After a small digression on
disaster management (Section 2), it starts with the
development of methods to extract from an enriched
GIS data a detailed network (graph) description to-
gether with attributes of the area to be evacuated.
Safe places are then determined using already exist-
ing assorted tools and technologies (Section 3). Then,
we formulate a dynamic optimization model which
seeks to pick pre-identified safe areas from the al-
ready available locations and prescribe traffic flow
plans so as to minimize total evacuation time and ca-
sualties (Section 4). Finally, we apply the overall
methodology to the study case of the Italian city of
Sulmona (Section 5). Brief conclusions end the paper
(Section 6).
2 DISASTER MANAGEMENT
Disaster Management (DM) aims at reducing, or pos-
sibly avoiding, potential losses from hazards, and at
assuring prompt and appropriate assistance to the vic-
tims. According to Mansourian (Mansourian, 2005),
DM can be undertaken by operations that include
preparedness, response, recovery, and mitigation as
shown in Figure 1. Preparedness encompasses all the
planning activities performed by various Government
organizations, NGO’s, businesses and other national
and international organizations to quickly respond to
disaster, in anticipation of its occurrence. Response
refers to the immediate activities and efforts which
seek to address the immediate and short term effects
of disaster, focusing primarily on the actions neces-
sary to save lives and protect properties, e.g.: efforts
to minimize hazards induced by the disaster, rescue
and relief operations, fire fighting, medical aids, shel-
ters, evacuation, law enforcement and security. Re-
covery indicates all those activities (like reconstruc-
tion of buildings, exemption in taxes and long term
medical care/counseling) which brings back the com-
munity to its normal condition. Along with preven-
tion, mitigation requires all those activities that mini-
mize the effects of the disaster, for example building
codes and zoning, vulnerability analysis and public
education (Kumar et al., 2013).
Figure 1: Timeline for the various operations performed be-
fore and after disasters.
Anhorn and Khazai (Anhorn and Khazai, 2015)
introduced a methodology to rank suitability of open
spaces for contingency planning and placement of
shelter in the immediate aftermath of a disaster. Us-
ing a combination of two factors for the ope space
suitability index. The Disaster Management illus-
trates the ongoing process by which governments,
businesses actors and civil society prepare plans to
reduce disaster impact, react during and immediately
following a disaster, and take steps to recover after
a disaster has occurred. A complete Disaster Man-
agement cycle includes public policies reshaping and
plan design that either act on the causes of disasters
GISTAM 2021 - 7th International Conference on Geographical Information Systems Theory, Applications and Management
242

or mitigate their effects on people, property, and in-
frastructure.
Unpredictability and the uncertain nature of dis-
asters are the key challenges of designing emergency
evacuation plans. Evacuation can be mandatory, rec-
ommended or voluntary; besides, it may differ by
scale, objects of relocation, and levels of control by
the authorities. Evacuation plan is very essential and
very necessary for those areas which are highly vul-
nerable and susceptible to disasters. An emergency
evacuation plan assigns evacuees to fixed routes and
directions before the disaster, and defines evacuation
policies for the occupants of areas subject to the risk
of a disaster (Campos et al., 2012). Disaster opera-
tions can be performed before or after disaster occur-
rence, and emergency logistics consists of the process
of planning, managing, and controlling the flow of re-
sources to provide relief to the people affected. Its
planning presents key challenges that do not normally
occur in ordinary business logistics (Sheu, 2007).
Kov
´
acs, Spens et. al (Kov
´
acs and Spens, 2007), stress
that the importance of logistics is quite underesti-
mated in pre- and post-disaster operation, being the
relevant organizations typically more concerned with
fundraising. Still, a large number of researches ad-
dressed those challenges via statistical or probabilis-
tic models (Coles and Pericchi, 2003; Xu et al., 2010),
queuing theory (Artalejo, 2000), simulation (Hu et al.,
2008; Reshetin and Regens, 2003), decision theory
(Cret et al., 1993; Tamura et al., 2000), fuzzy methods
(Esogbue et al., 1992; Jiang et al., 2009), and most
commonly, optimization models and algorithms.
GIS applications in disaster management are pro-
gressively transforming into a very useful tool that
helps in the processing of related emergency activities
and in reducing extremely critical times in emergency
management operations (Abdalla, 2016; M
¨
uller et al.,
2010).
3 NETWORK DEFINITION
In this section, we discuss how to define a city net-
work from GIS data specifically tailored for the def-
inition of evacuation plans for pedestrians in case of
an earthquake. We stress that, in order to define a
good evacuation plan, it is not enough to consider
shortest routes: besides distance, it is in fact neces-
sary to take into account such factors as the intrinsic
risk of buildings, street/road capacities, the numeri-
cal amount of people who need evacuation in each
specific zone, and time. For example, shortest paths
might include high-risk streets, or streets directly af-
fected by the disaster that should be excluded from the
evacuation plan. But even if the path does not touch
risky zones, should everyone concentrate into it, the
streets would become overcrowded and form a bot-
tleneck that impedes evacuation. Thus, the network
is enriched with a rich complex of information to be
used in order to find an appropriate trade-off between
total evacuation time and people safety.
We build the network in two phases: the first con-
cerns on collecting information about the city, the
second regards the transformation of data into nodes,
edges and attributes of a graph. To obtain a reusable
model, an object-oriented design is used: this involves
the creation of the City class which uses the Build-
ing, Crossroad, Waiting Area, Census Area and Street
classes, each dedicated to represent a specific infor-
mation. Then, a CityGraph class is used to obtain the
desired network.
3.1 Data Collection
The purpose of the first phase is to collect all the city
(or area) data that are relevant for the present study.
As this information has a prevalent geographical na-
ture, spatial data are mainly used. Among the differ-
ent methods of representing spatial data, with no loss
of generality we adopt the terminology of the shape-
file format, which includes primitive geometric ele-
ments, such as points, polylines and polygons (called
features), flanked by textual information (called at-
tributes).
Beyond the basic geometric information on build-
ings, crossroads and streets we also need to consider
the information necessary for evacuation planning;
here is a list:
• risk of buildings: integer, indicates the level of
risk from the most seismically vulnerable to the
most resilient (there exist several scales express-
ing seismic risks);
• people in buildings: number obtained from the
city census;
• streets length and width: in meters, useful to un-
derstand how many people a street can contain at
a given moment in time;
• risk of streets: initially estimated as the highest
degree of risk of the buildings flanking the street,
but the estimate can be refined as a function of
width, length, and of more information on the
street (such as the presence of dangerous artifacts
or peculiarities of any kind);
• waiting areas: obtained from data provided by the
Civil Protection Services, in particular related to
geometry and capacity of sheltering people.
Definition of an Enriched GIS Network for Evacuation Planning
243

The above information are saved as attributes of the
previously mentioned classes. In detail, the class City
includes the lists of buildings, crossroads, waiting ar-
eas, census areas, and streets. Additionally, the class
City needs to specify the Spatial Reference System
(SRS) used for spatial data and the functions to load
data from shapefiles.
Attributes of the class Building are the ID, the
building footprint geometry, the coordinates of its po-
sition in the street, the risk factor, and the number of
people who are assumed to live there. Two types of
geometric representations are used for buildings: in
one the building footprint is represented as a polygon
(necessary to infer, e.g., the area and the number of
people occupying the building); in the other, build-
ings are represented as points to indicate the position
in the street. This second representation, indicating
the building access points, is necessary to associate
buildings with the street network, a relation not al-
ways explicitly available from data sets. Therefore, a
method must be devised to infer the point represen-
tation from the polygonal representation. Given the
shapefiles of streets and buildings, a basic method is
to calculate the shortest distance between the building
and the streets that surround it, and then determine the
point on the street network that represents the access
to the building. More sophisticated methods can be
devised if more precise information is available, such
as building street numbers.
The class Crossroad contains the crossroad ID and
geometric position. The class Street the street ID,
the position of its endpoints (which must match with
crossroads), the linear geometry, the average width,
the length, the risk factor, and a list of the associated
buildings and waiting areas. The class WaitingArea
includes the ID, the geometry, the position and the
area capacity in terms of people. Finally, the class
CensusArea includes the area ID, its geometry, the
buildings it contains and the total amount of residents
included. Unlike the other classes, this one will not
be used to create the graph, but only to estimate the
number of residents in each building.
Figure 2: Screenshot of the area from Google Earth.
Figure 3: Screenshot of shapefiles in the area.
To better understand the typical GIS data which
provide data to the above classes, an example may be
of help. Figure 2 shows a screenshot satellite picture
taken from Google Earth, Figure 3 displays the cor-
responding shapefiles with buildings (violet areas),
streets (yellow lines), crossroads (red points), and po-
sition of buildings inside the network (orange points).
3.2 Transformation into a Graph
Once we have all the information about a city, it is
possible to create a graph representing the city as a
network.
To make graph usage more efficient, we adopt a
hierarchical approach and define in fact two graphs:
one more detailed, and another more generic. Both
graphs are undirected, since we can assume pedestri-
ans move in both street directions. In the first graph
G
D
= (V, E), the set of nodes V is the union of the
following subsets:
• V
B
(Buildings). With attributes:
– building type: private, public (church, town
hall, school, library, ...) or strategic (used by
Civil Protection)
– position: latitude and longitude coordinates
– risk: integer number indicating the building
seismic vulnerability, the higher the more risky
– number of people: estimation of the amount of
people that could be in a building at a particular
time.
• V
C
(Crossroads). With the only attribute position,
expressed by latitude and longitude.
• V
WA
(Waiting Areas). With attributes position and
capacity, that is the number of people that the area
can contain.
For the construction of the edges it is useful to define
the concept of point of interest as any possible starting
or ending point in a route. These points are all those
nodes of the graph that do not represent crossroads
(V \V
C
); for the moment they coincide with buildings
GISTAM 2021 - 7th International Conference on Geographical Information Systems Theory, Applications and Management
244

and waiting areas, but in future developments their set
can be augmented.
Now we can define the set of edges E, obtained as
the union of the following sets:
• E
S
(Streets). The elements connecting a cross-
road to another (corresponding to the roads de-
scribed in the shapefile of the available GIS data).
Attributes: width and length expressed in meters,
buildings as a list of the buildings facing the street,
and risk as the largest degree of risk of a building
in the latter list.
• E
HS
(Half-Streets). Parts of streets that connect
points of interests to each other or to a cross-
road. To divide a street into half-streets, we
implemented a function called divideStreetWith-
PointsOfInterest() that proceeds through the street
starting from an endpoint. When a point of in-
terest is found, a new edge that connects it to
the crossroad is saved. The function then restarts
from the last point of interest found, search for the
next, and so on until it reaches the second end-
point. Attributes inherit those of the associated
edge (street) but with updated length, except those
related to the points of interest.
Figures 4 and 5 show the graph representation of the
data collected on the area exemplified in Figures 2
and 3. In the former one can see red nodes (cross-
roads), blue nodes (buildings) and the edges that con-
nect them to each other. The latter figure shows the
more generic graph involving only crossroad nodes.
Figure 4: Area represented by the complete graph.
Figure 5: Area represented by the crossroads graph.
As said, this procedure generates the detailed
graph G
D
= (V, E), where V = (V
B
∪V
C
∪V
WA
) and
E = (E
S
∪ E
HS
), containing the whole information
necessary for the evacuation plan. A more abstract
graph G
A
= (V
C
, E
S
) is then obtained by finding the
subgraph induced in G
D
by the crossroad nodes V
C
.
Obviously, the detailed graph contains many more
nodes than the abstract graph: computing a path from
a point of interest to another in G
D
can however be
fastened by exploiting G
A
. To find a route between
two points of interest we can distinguish three steps:
departure, search and arrival. In the departure step,
the detailed graph is explored in order to move from
the starting point of interest (the origin) to the nearest
crossroad that brings closer to the destination. In the
search step, the algorithm uses G
A
to find a route from
the crossroad found in the departure step to a cross-
road that is as close as possible to the destination (i.e.,
one of the endpoints of the street that contains it). Fi-
nally, in the arrival step one moves from a crossroads
to the destination, so it is again necessary to use G
D
.
Using this method, the CPU time of the routines used
in the elaboration of the evacuation plan can be sub-
stantially reduced.
4 GENERATING THE
EVACUATION PLAN
To dynamically generate a plan that minimizes the to-
tal evacuation time we adapted a linear optimization
model originally developed by (Arbib et al., 2019)
for building evacuation. The model had to be cus-
tomized with respect to several parameters, and re-
scaled to the network of several orders of magnitude.
The large scale required forced us to consider, for a
first approach, various simplifications and only a lim-
ited amount of the information supplied by the net-
work. Although some work should then be devoted to
extend the model, the results obtained are however en-
couraging in terms of the approach viability. A high-
level description of the model is given in the next sec-
tion 4.1, and parameter customization is reported in
section 4.2.
4.1 The Optimization Model
Based on earlier work of (Choi et al., 1988), (Arbib
et al., 2019) devised a discrete-time network stock-
and-flow model where one finds, at increasing time
stamps τ, the maximum amount of people that can
be evacuated within τ to a given set of safe areas. The
starting point of the model is a static oriented network
G = (N, A) obtained from the graph G
D
of section 3.2
by a suitable embedding of the city streets into a set
Definition of an Enriched GIS Network for Evacuation Planning
245

N of elementary cells; the arcs in A connect geomet-
rically adjacent cells in both directions. Cells may
in general have different shapes or sizes: for the pur-
pose of this work, it is important that every cell can
approximately be traversed in a single time unit. De-
pending on size, the i-th cell has a capacity n
i
equal
to the maximum number of people it can host and,
at any given time t, contains some number y
t
i
≤ n
i
of
people. Moreover, depending on street size, a limited
amount x
t
i j
≤ c
i j
of people can move in the unit inter-
val [t, t + 1] from cell i to an adjacent cell j. Finally,
depending on scenarios, the network G may consists
of a number of maximal connected components: in
each component, safe places collectively correspond
to a single super-sink 0 with a capacity large enough
to host all evacuees.
From each component of the static network G, a
dynamic network G
T
= (N
T
, A
T
) is then constructed
as the time expansion of G over a time horizon T =
{0, 1, . . . , τ}, with:
N
T
= {(i, t)|i ∈ N, t ∈ T };
A
T
= A
M
∪ A
H
, where A
M
, the movement arcs, link
(i, t) to ( j, t + 1) for (i, j) ∈ A, and A
H
, the
holdover arcs, link (i, t) to (i, t +1) for i ∈ N.
Using then x
t
i j
and y
t
i
as decision variables, the model
assigns the initial cell occupancy, expresses flow
conservation, and enforces the appropriate capacities
(possibly considering congestion phenomena). Dis-
tinct models are formulated for different τ, with the
objective of maximizing the total in-flow y
τ
0
in the
super-sink at time τ. One then seeks the least τ
∗
within which the totality of people can be evacu-
ated from the endangered area: to reduce CPU time,
τ
∗
is computed by logarithmic search. In this way,
the method provides the decision maker with the
Pareto-frontier of the conflicting objectives min{τ},
max{y
τ
0
}.
4.2 Parameter Setting and
Implementation
The model complexity increases with both τ and the
size of G. The more people to evacuate, the larger
the τ
∗
, so the former parameter in turn increases with
the number of evacuees. As a city has a scale much
larger than a single building in terms of both net-
work and people involved, model size increases ac-
cordingly. Just to make a comparison, in the exper-
iments run in (Arbib et al., 2019), G has 116 to 462
cells (depending on accuracy), tests involved 528 to
1,548 evacuees, and computation required from few
seconds to less than 100 seconds CPU time. In the
case studied here the former values are 12,675 and
26,050, respectively: that is, from almost 30 over 100
times the graph size, and from almost 17 to 50 times
the people. Notice that this increase has a double ef-
fect, since the nodes of G
T
linearly increase with both
values, so (see also Section 5.3) in our case we solved
problems with over 2,000,000 nodes.
As a consequence, unlike (Arbib et al., 2019), we
cannot conceive a real-time application of the model
developed, but only its use for scenario evaluation.
Particular care is anyway to be taken in parameter
setting and other implementation choices in order to
limit CPU time and memory usage. For example, we
could not model non-linear constraints that relate ca-
pacities to actual flows, as their linearization would
multiply the number of flow variables by a factor at
least 3. We next survey the main model parameters:
model granularity, walking velocity, cell capacity, and
street capacity.
4.2.1 Model Granularity
Model granularity touches both spatial and temporal
units and affects the shape and size of the unit cells
in which the network is decomposed, as well as the
slots that form the evacuation time horizon. As we
assumed in Section 4.1, we embed the crossroad net-
work into a grid, whose cells are assumed to be iso-
metric, that is, they can be crossed in any direction in
the same amount of time. This amount helps in the
definition of the time slot duration and cells are re-
garded as virtual unit open spaces that communicate
to one another via virtual doors. The virtual door ca-
pacities are assumed to be the width of the streets.
The geometry of the grid can vary and, due to the
structure of the streets, a rectangular grid was used
in our study, where each street is split into an integer
number of cells.
4.2.2 Walking Velocity
The basis on which the length of each unit time slot
was established is the free flow walking velocity, that
is, the speed at which humans prefer to walk in non-
congested and non-hampered conditions. This param-
eter is important to perceive the distance that an indi-
vidual can possibly walk during a specific period of
time. Through its evaluation one can define the cells
in which an area is to be divided for best approxima-
tion of traveling time. In literature there are different
evaluations of pedestrian free flow velocity, includ-
ing those depending on their age ((TranSafety, 1997)
(Knoblauch et al., 1996)). Not having this informa-
tion we assumed a free flow walking speed for a flat
surface of 1.00 m/s ((Abdelghany et al., 2005), (Ab-
delghany et al., 2010), (Abdelghany et al., 2014)).
GISTAM 2021 - 7th International Conference on Geographical Information Systems Theory, Applications and Management
246

4.2.3 Cell Capacity
The pedestrian density, which is the number of per-
sons per square meter monitored at any time, is vi-
tal information for crowd safety and evacuation per-
formance, as movements are dramatically reduced in
highly dense areas. According to UK fire safety regu-
lations, the maximum allowed density corresponds to
0.3m
2
per standing person, which increases to 0.5m
2
for public houses, to 1.0m
2
for dining places, to 2.0m
2
for sport areas and to 6.0m
2
for office areas. In our
case study, the maximum capacity of each cell is cal-
culated by assuming 0.5m
2
per evacuee.
4.2.4 Street Capacity
We considered ”virtual doors” as the width of the
streets. We assume a constant door capacity of 1.8
persons per second per 1-meter door width (p/m/s)
meaning that a maximum number of 12.6 persons can
pass through a 1-meter street width per time slot (7
seconds). Also capacities are assumed to be propor-
tional to street width.
5 EXPERIMENTS
In order to test the overall methodology presented in
this paper on real data, we considered as a pilot study
the city of Sulmona in the Abruzzo region of Italy.
The dataset used in this experiment was obtained from
the ISTAT 2011 census data with the shapefiles from
the paper (Di Ludovico et al., 2017)
5.1 Sulmona Datasets
The information about the city of Sulmona is con-
tained in the GIS data extracted from the work of Di
Ludovico, et. al (Di Ludovico et al., 2017) about the
possible risks to consider during the planning of an
emergency. These data relate to the historic center of
the city but could be expanded with different or addi-
tional data in a second phase.
• Census sections of 2011: The census sections
consist of the partition of the entire area of Sul-
mona into smaller areas with varying characteris-
tics. Each census section has the following infor-
mation provided. The size (m
2
) and the perimeter
(m) of each census section, the demography and
the socio-economic information of the residents,
the type of buildings (whether being used for res-
idential or non-residential purpose), the type and
status of the accommodation and occupancy lev-
els. Finally, statistics (such as the seismic de-
sign design of the building and the number of
floors/interiors and occupants) of each building
in these section areas are also provided. Seis-
mic design of the building and the number of
floors/interiors
The census data provided by ISTAT 2011, which
includes the whole city of Sulmona, consists of
5300 buildings of which 4246 are used for resi-
dential purposes, 778 used for either productive,
commercial, directional, tertiary, tourist, recep-
tive, services, churches or others. About 9468
(34%) of the total population (24275) are resi-
dents living there. Buildings not used are 5.2%
for total assets.
Finally there is any extensive information about
the strategic buildings (those safe buildings that
are used by civil protection during the emer-
gency), and public buildings, such as churches,
town halls, schools, libraries, etc.
• MSK classification: Which is a measure that stim-
ulates measure that simulates the seismic vulner-
ability of buildings. This simulation was done
by a research of the National Research Coun-
cil. Every building in the Sulmona has an MSK
index (Medvedev, 1977). The area in question,
the SISMA project has classified using the MSK
model, 15% of class A buildings (buildings with
wooden floors and poor or average quality ma-
sonry), 66% in class B (poor quality masonry or
media and attics in beams or buildings with good
quality masonry and wood floors), 5% in class C1
(good quality masonry, artificial masonry, with at-
tics in beams or ca) and the remaining 14% class
C2 (adequate or improved buildings seismically)
• Streets and Road junctions: This shapefile con-
tains information about the streets such as the
name, description of the street(road) and the road
types (there are only two types, the ’Principale’
type, that is the viability that the Civil Protec-
tion uses to access Sulmona, and the ’Secondario’
type, also used alternatively by civil protection).
Also the length (distance between two successive
crossroads) and width (three classes, less than 3.5
m, between 3.5 to 7 m, greater than 7 m) of the
street is also given.
• Waiting Areas (AT): They are the areas or loca-
tions that residents go to incase of any disaster.
These areas are identified such as the surface that
a person can occupy at a standstill is 2.5 square
meters / person. There are also several attributes
of these waiting areas such as the maximum num-
Definition of an Enriched GIS Network for Evacuation Planning
247

ber of users that can occupy the Waiting Area –
capacity of WA), reduction index of area of the
waiting areas. It is an index of reduction of area
of the waiting areas which takes into account that
there are parts of the waiting areas that cannot be
occupied by people, for example due to the pres-
ence of trees, bushes, benches, paths, etc.
5.2 Building Sulmona’s Network
Since the GIS data and the ISTAT 2011 census
data are in different format, a mapping of the two
data sets was performed to optimize the data match-
ing/synchronization and minimize the errors. The
methodology for network extraction was then ap-
plied to the processed data, calling the City class
which extracts and defines the various attributes of the
city such the buildings (i.e (non)residential, strategic,
number of residents, etc), waiting areas, streets (main
streets and half-streets) and crossroads. Using the find
address class, the positions (in latitudes and longi-
tudes) of each building is identified and approximated
unto the closest street, as well as the MSK classifica-
tions.
Figure 6 shows an extract of the city of Sul-
mona from the GIS shapefiles obtained from (Di Lu-
dovico et al., 2017). The polygons represents the var-
ious building units while the red circles represent the
cross-roads. The crossroads forms part of the nodes,
V
C
of the more detailed and generic graph. In order
the obtain the remaining set of nodes V
B
and V
WA
, the
nodes of the buildings and the waiting areas were de-
rived from their centroids as shown in figure 7. The
building nodes has information about the volume of
the individual building units. Since the resident pop-
ulation information provided in the ISTAT 2011 data
is for the census sections and not for each building,
we used the volume of the buildings inside the census
section to distribute the population on each building
and therefore on each volume. Hence the complete set
of nodes for the entire network is given as the combi-
nation of the red nodes from the crossroads and the
blue building nodes.
Figure 6: GIS visualisation of an extract of Sulmona city.
Figure 8 gives a visualization of the network of
the city of Sulmona with removing all the polygons
Figure 7: Extract of centroids of building nodes.
and replacing them with their centroids. To build the
final graph (network), the City class needs the (blue)
nodes of the building with the arcs (streets) nearest
to them. If two or nodes overlap at the same point
on the street, a single node is used to represent these
set of nodes with a capacity of the total population of
residents in the individual overlapping nodes.
Figure 8: Visualisation of the extracted data without the
polygons.
To finally implement the CityGraph class, there
are two different networks (graphs) that could be gen-
erated, i.e,
• The more detailed graph with the set of all nodes
(V
B
, V
C
and V
WA
) and the streets (E
S
and E
H
S) as
the set of all arcs. Figure 9, illustrates a more
detailed graph(network) generated for Sulmona.
The set of nodes are embedded with all the in-
formation about the building, such as the capac-
ity, risk index, type of node, position (usually in
latitude and longitude, etc) and the arc set is also
embedded with information such as the type of
arc (street or half-street), width, length, risk index
(which is a function of the set of buildings along
that arc), number and list of building situated on
that particular arc.
• The generic graph (network) composed of the
crossroads (V
C
) as the nodes and streets (E
S
) as
the arcs. Note that this graph is less then as it is
made-up of only a subset of the total nodes and
arcs. Both the set of nodes and arcs all embedded
their respective attributed information.
Both the generic and detailed networks are gener-
ated as undirected graphs as we considered the flow
pedestrians. Since the algorithm is reusable, it can be
GISTAM 2021 - 7th International Conference on Geographical Information Systems Theory, Applications and Management
248
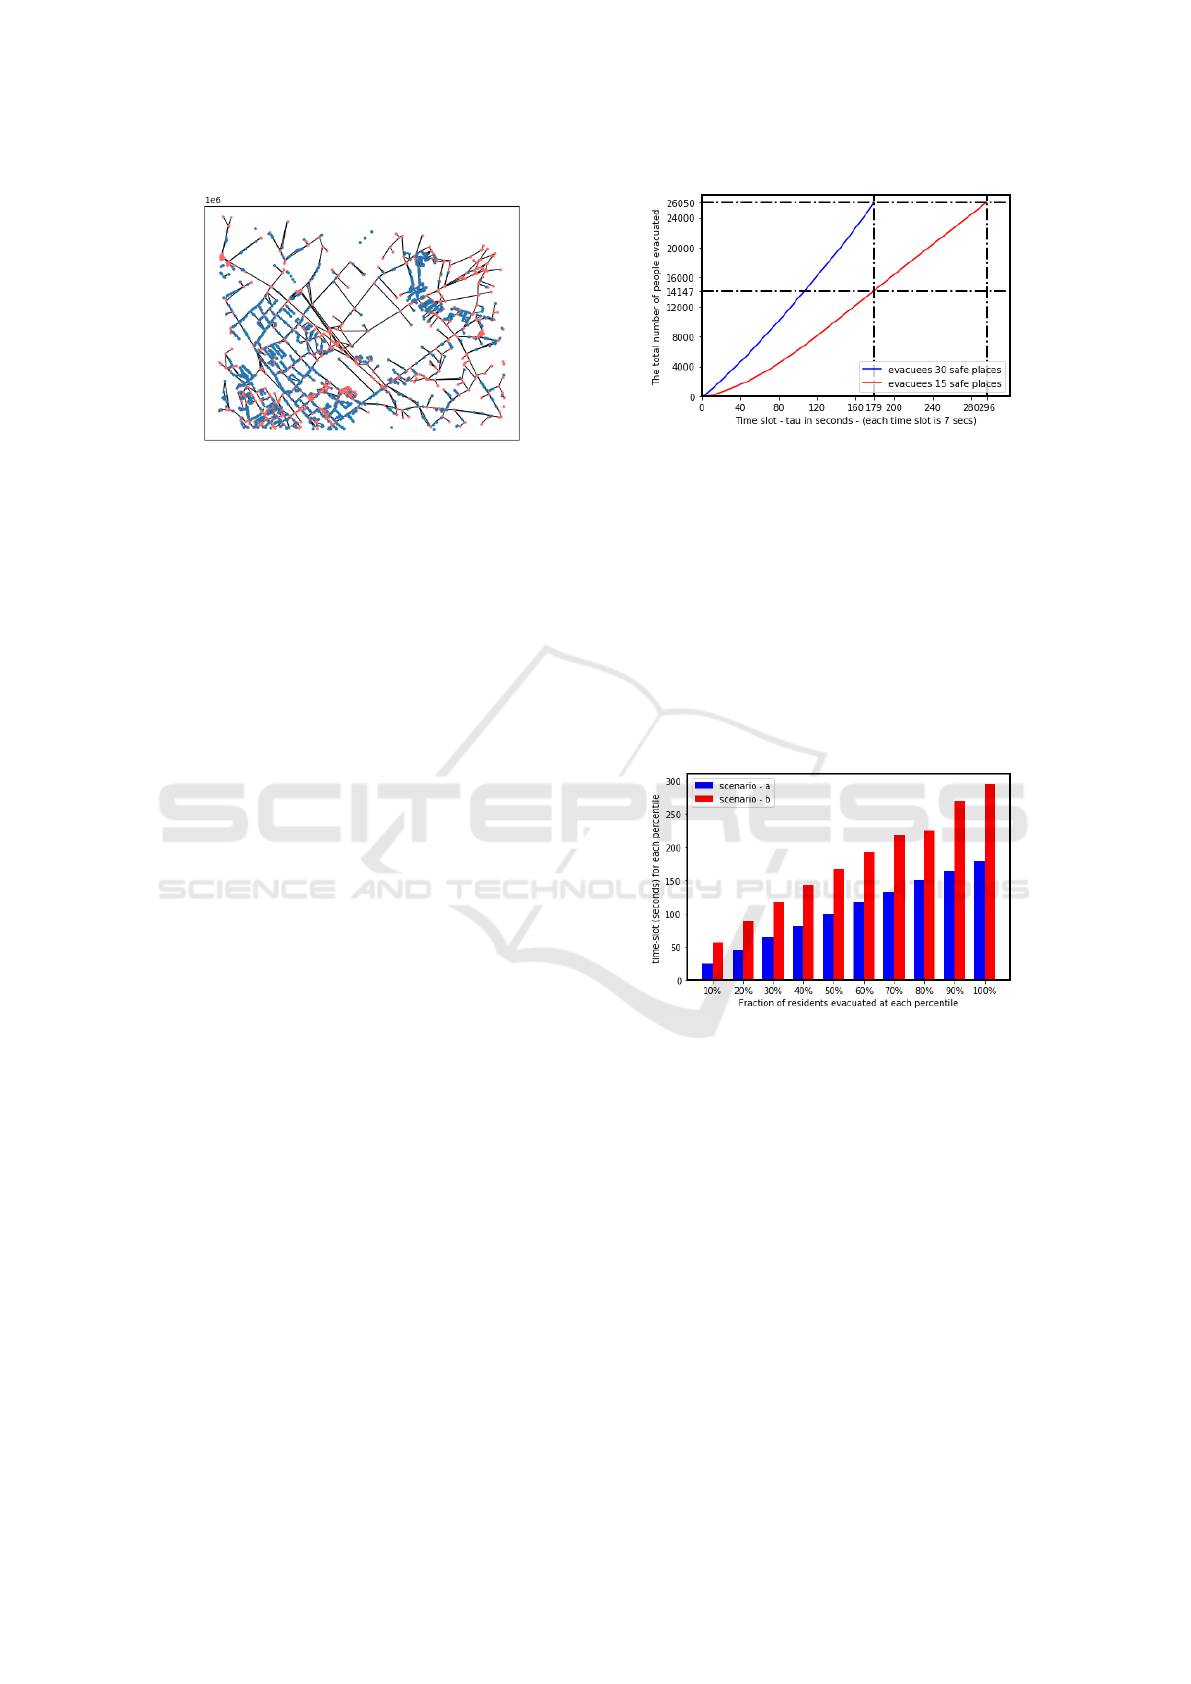
Figure 9: Generated graph for the city of Sulmona.
adopted to the case of a directed network where the
flow is basically vehicles carrying evacuees.
5.3 Sulmona Evacuation Plan
Using the dynamic flow model discussed in section
4, we run an experiment to safely evacuate the resi-
dents or occupants of Sulmona in case of a disaster.
The crossroad network was used, which consists of
920 crossroads (junctions) and 1162 interconnecting
streets with different widths and lengths. The streets
were split into unit cells, each behaving as a (virtual)
quasi-rectangular crossroad that can be traversed in a
unit time slot (more details on this aspect follow).
After the splitting, we obtained a graph of 12675
nodes corresponding to the cells of the crossroads and
including the super node 0 as safe place, and 25892
arcs linking adjacent cells that allow people to tra-
verse cells. All arcs are assumed bidirectional except
the those towards the safe place. A time slot corre-
sponds to the time required for crossing one cell: us-
ing average free flow speeds from section 4.2.2 and
considering cell size, we determined time slots of 7
seconds. We also considered a street capacity of 12.6
persons through a 1-meter street width per time slot.
We run the simulation of an emergency evacuation
planning to evacuate 26050 people who are randomly
distributed in the cells. The code for simulation was
written in python using the gurobi API and solved us-
ing gurobi optimizer version 9.1. All the experiments
were run on a Core i7-3rd generation 2.9GHz com-
puter with 16Gb of RAM memory under Windows 10
pro 64-bits.
We run the experiment with two different scenar-
ios: scenario - a) that considers 30 safe places and
scenario - b) with 15 safe places. Figure 10 shows
the the minimum time required to evacuate the res-
idents in both scenarios. In scenario - a), all the
26050 evacuees were safely evacuated in 180 time
slots (i.e., in 1670 secs corresponding to 27 minutes
and 50 seconds). In scenario - b), considering the
Figure 10: Total number of evacuees at each time slot for
two scenarios - (a) 30 safe areas and (b) 15 safe places.
same time slot, only 14147 evacuees were moved to
safety whereas, everyone was evacuated in 296 time
slots (i.e., 2558 seconds, corresponding in 42 minutes
38 seconds). The total time taken to evacuate all the
residents was somehow smaller than what would be
expected in real-life. This is due probably because
we used a simplified model which does not account
for any possible congestion that would occur on along
the passages between adjacent cells. The congestion
of some arcs could result in bottlenecks thereby re-
ducing the amount and speed flow along those arcs.
Figure 11: Total time taken to evacuate various frac-
tions/portions of total evacuees for each scenario.
In Figure 11 we report the total time required
to evacuate different percentage of the population in
both scenarios. For instance, in case of scenario - a),
it took 700 seconds to evacuate approximately 50%
of the population. Whereas, in scenario b) it took
1176 seconds to evacuate the same number of evac-
uees. Looking at the figure, there seems to be a quasi-
linear relationship between the number of safe places
and the total time needed to complete the evacuation
process,that is, it takes approximately twice the time
needed to evacuate residents in scenario - a) to evacu-
ate the same number of residents in scenario - b). For
instance, 60% of the total evacuees were evacuated at
time slot tau = 117 in scenario - a) while 30% of the
total evacuees were evacuated in the same time slot
tau = 117 for scenario - b).
Definition of an Enriched GIS Network for Evacuation Planning
249

Figure 12: The number of times a cell has the maximum
capacity in all the time slots.
Finally, we also analysed the impact of certain
cells in the evacuation process. Using scenario-
a we computed the cells (excluding the super-sink)
which had the maximum capacities at each time-slot
throughout the entire evacuation process of 179 time-
slots. As it can be seen from Figure 12, cells 3, 291,
200, and 847 respectively had maximum capacities
of 23,24,23 and 22 in different time slots out of the
179 ones. Also there were 15 different times slots
(out of 179) that cell 3891 had a maximum capac-
ity during the evacuation process. This figure tells
us that the model we used could not be adequate, es-
pecially for cities with higher population density. In
fact, the model we used does not consider congestion
in the cells during evacuation. The congestion can
have sever impact on the time needed to evacuee all
the population.
On the other end, the results we obtained so far,
using a simple optimization model, tell us that we
cannot do better in Sulmona city historical center and
that the number of safe places available in the city af-
fects the total time needed to evacuee the entire popu-
lation, in fact the more the safe places, the shorter the
population evacuation time.
6 CONCLUSIONS AND FUTURE
WORK
The contribution of this paper was threefold: i) the
definition of a new algorithm able to generate an en-
riched network from GIS data, specifically tailored
to include useful information for emergency manage-
ment, ii) the adaptation of the optimization model de-
veloped by (Arbib et al., 2019) to outdoor scenarios,
that is the evacuation plan of a city in case of nat-
ural disaster; iii) the validation of the previous step
to a real case study, i.e., the historical centre of Sul-
mona city in Italy. The network generation from GIS
data is able to generate a network representing the
city map in terms of buildings, crossroads and streets.
Different from other similar algorithms, we are able
to manage additional information, needed for evacu-
ation planning, added as attributes to network nodes
and arcs. For what concerns the evacuation model,
we adapted the linear optimization model originally
developed by (Arbib et al., 2019) for building evacu-
ation. The model had to be customized with respect
to several parameters, and re-scaled to the network
of several orders of magnitude. In the case study of
Sulmona, we solved the problem with over 2,000,000
nodes. The large scale required forced us to consider,
for a first approach, various simplifications and only a
limited amount of the information supplied by the net-
work. Although some work should then be devoted
to extend the model, the results obtained are however
encouraging in terms of the approach viability.
As future work, we plan to extend both the net-
work construction and the optimization model in or-
der to manage more real situations. In particular, we
are working to make more general the network to use
it in other relevant problems, such as pre- and post-
disaster facilities planning, and post-disaster recon-
struction planning (Mudassir, 2020). We also aim to
find a more reliable estimate of the people who are
in a building by considering that during the day the
number of people in the structures changes (for ex-
ample, children at school and working shift). Among
the different methods, using GPS tracking might be a
satisfactory solution to retrieve a more realistic popu-
lation distribution (No et al., 2020).
For what concerns the optimization model, we
aim to add the congestion that will approximate the
non-linearity of the arc capacities. This will affect
the speed the system empties modelled as a decreas-
ing function of the cell occupancy. A more accurate
model of congestion requires arc capacity to be a con-
cave decreasing function of cell occupancy. Finally,
we aim to make a trade-off analysis between the num-
ber of safe places and the total evacuation time. This
will be very useful for pre-disaster evacuation plan
definition.
ACKNOWLEDGEMENTS
This work is partially funded by Territori Aperti
(a project by Fondo Territori Lavoro e Conoscenza
CGIL, CSIL and UIL) and by SoBigData-PlusPlus
H2020-INFRAIA-2019-1 EU project, contract num-
ber 871042. The open data used in the evaluation
comes from opendata.regione.abruzzo.it.
GISTAM 2021 - 7th International Conference on Geographical Information Systems Theory, Applications and Management
250

REFERENCES
Abdalla, R. (2016). Evaluation of spatial analysis applica-
tion for urban emergency management. SpringerPlus,
5(2081).
Abdelghany, A., Abdelghany, K., Mahmassani, H., Al-
Ahmadi, H., and Alhalabi, W. (2010). Modeling the
evacuation of large-scale crowded pedestrian facili-
ties. Transportation research record, 2198(1):152–
160.
Abdelghany, A., Abdelghany, K., Mahmassani, H., and
Alhalabi, W. (2014). Modeling framework for opti-
mal evacuation of large-scale crowded pedestrian fa-
cilities. European Journal of Operational Research,
237(3):1105–1118.
Abdelghany, A., Abdelghany, K., Mahmassani, H. S., and
Al-Gadhi, S. A. (2005). Microsimulation assignment
model for multidirectional pedestrian movement in
congested facilities. Transportation research record,
1939(1):123–132.
Alexander, D. E. (2002). Principles of emergency plan-
ning and management. Oxford University Press on
Demand.
Alexander, D. E. (2010). The l’aquila earthquake of 6
april 2009 and italian government policy on disaster
response. Journal of Natural Resources Policy Re-
search, 2(4):325–342.
Anhorn, J. and Khazai, B. (2015). Open space suitabil-
ity analysis for emergency shelter after an earthquake.
Natural Hazards and Earth System Sciences, 15:789–
803.
Arbib, C., Moghaddam, M. T., and Muccini, H. (2019). Iot
flows: a network flow model application to building
evacuation. In A View of Operations Research Appli-
cations in Italy, 2018, pages 115–131. Springer.
Artalejo, J. R. (2000). G-networks: A versatile approach
for work removal in queueing networks. European
Journal of Operational Research, 126(2):233–249.
Campos, V., Bandeira, R., and Bandeira, A. (2012). A
method for evacuation route planning in disaster sit-
uations. Procedia-Social and Behavioral Sciences,
54:503–512.
Choi, W., Hamacher, H. W., and Tufekci, S. (1988). Model-
ing of building evacuation problems by network flows
with side constraints. European Journal of Opera-
tional Research, 35(1):98–110.
Coles, S. and Pericchi, L. (2003). Anticipating catastro-
phes through extreme value modelling. Journal of
the Royal Statistical Society: Series C (Applied Statis-
tics), 52(4):405–416.
Cret, L., Yamazaki, F., Nagata, S., and Katayama, T. (1993).
Earthquake damage estimation and decision analysis
for emergency shut-off of city gas networks using
fuzzy set theory. Structural safety, 12(1):1–19.
Di Ludovico, D., Di Lodovico, L., and Basi, M. (2017).
Rischi e funzionalit
`
a urbana per la pianificazione
dell’emergenza. il caso studio di sulmona (aq).
Planum Publisher, 1:1–7.
Esogbue, A. O., Theologidu, M., and Guo, K. (1992). On
the application of fuzzy sets theory to the optimal
flood control problem arising in water resources sys-
tems. Fuzzy Sets and Systems, 48(2):155–172.
F.I. (2005). Logistics and the effective delivery of humani-
tarian relief. Fritz Institute San Francisco, CA.
Fischer, M. M. (2006). Spatial Analysis and GeoComputa-
tion, chapter GIS and Network Analysis, pages 43–60.
Springer, Berlin, Heidelberg.
Gunn, S. (2003). Basics of international humanitarian mis-
sions, chapter The language of disasters: a brief termi-
nology of disaster management and humanitarian ac-
tion, pages 37–40. Kevin M. Cahill, M.D., Fordham
University.
Hooper, J. (Apr. 28, 2009). Pope visits italian village hit
hardest by earthquake. The Guardian.
Hu, W., Qing, Y., Ming-Hui, Y., and Qi, F. (2008). Grid-
based platform for disaster response plan simulation
over internet. Simulation Modelling Practice and The-
ory, 16(3):379–386.
Jiang, W., Deng, L., Chen, L., Wu, J., and Li, J. (2009).
Risk assessment and validation of flood disaster based
on fuzzy mathematics. Progress in Natural Science,
19(10):1419–1425.
Knoblauch, R. L., Pietrucha, M. T., and Nitzburg, M.
(1996). Field studies of pedestrian walking speed
and start-up time. Transportation research record,
1538(1):27–38.
Kov
´
acs, G. and Spens, K. (2007). Humanitarian logis-
tics in disaster relief operations. International Jour-
nal of Physical Distribution & Logistics Management,
37:99–114.
Kumar, P., Garg, R., and Kanji, R. (2013). Gis aided evac-
uation planning: A path to relief in disaster. 14th Esri
India User Conference.
Mahar, P. et al. (2013). Disasters and their effects on the
population: Key concepts. Pediatric Education in Dis-
asters Manual, module 1.
Mandloi, D. and Thill, J.-C. (2010). Geospatial Analysis
and Modeling of Urban Structure and Dynamics, vol-
ume 99, chapter Object-Oriented Data Modeling of
an Indoor/Outdoor Urban Transportation Network and
Route Planning Analysis, pages 197–220.
Mansourian, A. (2005). Development of an sdi concep-
tual model and web based system to facilitate disas-
ter management. PhD thesis, K.N. Toosi University
of Technology, Faculty of Geodesy & Geomatics En-
gineering, Tehran, Iran.
Medvedev, S. (1977). Seismic intensity scale msk-76. Publ
Inst Geophys Pol Acad Sc, 117:95–102.
M
¨
uller, M., Bernard, L., and Vogel, R. (2010). Geo-
graphic Information and Cartography for Risk and
Crisis Management, chapter Multi-criteria Evaluation
for Emergency Management in Spatial Data Infras-
tructures, pages 273–286. Springer-Verlag Berlin Hei-
delberg.
Mudassir, G. (2020). Social-based physical reconstruction
planning in case of natural disaster: a machine learn-
ing approach. In Dalpiaz F., Zdravkovic J., L. P., edi-
tor, Doctoral Symposium. The 14th International Con-
ference on Research Challenges in Information Sci-
ence, volume 385, pages 604–612.
Definition of an Enriched GIS Network for Evacuation Planning
251

No, W., Choi, J., Park, S., and Lee, D. (2020). Balancing
hazard exposure and walking distance in evacuation
route planning during earthquake disasters. ISPRS In-
ternational Journal of Geo-Information, 9:432.
Pyakurel, U., Nath, H. N., Dempe, S., and Dhamala, T. N.
(2019). Efficient dynamic flow algorithms for evac-
uation planning problems with partial lane reversal.
Mathematics, 7(10):993.
Reshetin, V. P. and Regens, J. L. (2003). Simulation mod-
eling of anthrax spore dispersion in a bioterrorism
incident. Risk Analysis: An International Journal,
23(6):1135–1145.
Sheu, J.-B. (2007). Challenges of emergency logistics man-
agement. Transportation Research Part E: Logistics
and Transportation Review, 43:655–659.
Tamura, H., Yamamoto, K., Tomiyama, S., and Hatono, I.
(2000). Modeling and analysis of decision making
problem for mitigating natural disaster risks. Euro-
pean Journal of Operational Research, 122(2):461–
468.
TranSafety (1997). Study compares older and younger
pedestrian walking speeds. TranSafety, Inc, Road En-
gineering Journal.
Van Wassenhove, L. N. (2006). Humanitarian aid logistics:
supply chain management in high gear. Journal of the
Operational research Society, 57(5):475–489.
W.H.O. (1999). Emergency health training programme for
africa. Technical report, World Health Organization
WHO/EHA/EHTP. PanAfrican Emergency Training
Centre, Addis Ababa.
Xu, X., Qi, Y., and Hua, Z. (2010). Forecasting demand
of commodities after natural disasters. Expert systems
with applications, 37(6):4313–4317.
GISTAM 2021 - 7th International Conference on Geographical Information Systems Theory, Applications and Management
252
