
Effects on Traffic Performance Due to Heterogeneity of Automated
Vehicles on Motorways: A Microscopic Simulation Study
Ivan Postigo
1,2 a
, Johan Olstam
1,2 b
and Clas Rydergren
2 c
1
Swedish National Road and Transport Research Institute (VTI), Link
¨
oping, Sweden
2
Department of Science and Technology, Link
¨
oping University, Norrk
¨
oping, Sweden
Keywords:
Automated Vehicles, Automated Driving, Microscopic Simulation, Mixed Traffic.
Abstract:
The introduction of automated vehicles (AVs) is commonly expected to improve different aspects of trans-
portation. A long transition period is expected until AVs become prevalent on roads. During this period,
different types of AVs with different driving logics will coexist along human driven vehicles. Using micro-
scopic traffic simulation, this study investigates the range of potential impacts on traffic performance in terms
of throughput and travel delays for different types of AVs and human driven vehicles on motorways. The
simulation experiment includes scenarios with combinations of three different driving logics for AVs together
with human driven vehicles at increasing penetration rates. The utilized AV driving logics represent the evo-
lution of AVs, they were defined in the microscopic simulation tool Vissim and were created by modifying
and extending the human driver behaviour models. The results of the simulation experiment show a decrease
in vehicle throughput and significant effects on delay times when AVs with a more cautious driving logic are
predominant. Overall, results show higher vehicle throughput and lower travel delays as AVs evolve to more
advanced driving logics.
1 INTRODUCTION
The introduction of automated vehicles (AVs) is com-
monly expected to improve different aspects of trans-
portation; reduce operational costs, improve safety,
ease congestion, decrease energy usage, increase driv-
ing comfort, among others. From a traffic perfor-
mance perspective, AVs are usually expected to im-
prove traffic by being able to keep smaller gaps be-
tween vehicles, by always complying with road regu-
lations, and by smaller variations compared to human
drivers both in the way they drive as well as on how
they react to their surroundings.
In order for AVs to be allowed in public roads,
they need to be proven safe. This requirement would
lead first generations of AVs to focus on minimizing
risks, and to drive more cautiously than most human
drivers.
Road authorities are interested on how the deploy-
ment of AVs will affect traffic conditions, in order to
avoid possible negative impacts and to take advan-
a
https://orcid.org/0000-0002-4745-4865
b
https://orcid.org/0000-0002-0336-6943
c
https://orcid.org/0000-0001-6405-5914
tage of possible benefits. Motorways arguably present
less challenging conditions for automated driving to
be first introduced, mainly due to the one-directional
traffic flow and separation from pedestrians and non-
motorized transport modes (ERTRAC, 2019). On mo-
torways, AVs would primarily have to deal with the
interaction with other vehicles and not with traffic
lights, pedestrian crossings, nor would they have to
anticipate all potential circumstances of urban scenar-
ios.
To estimate the impact of AVs on motorways, mi-
croscopic traffic simulation is a suitable tool since the
movements of all vehicles and the interaction between
them are simulated. However, models used in simu-
lation tools were originally developed to describe hu-
man driving behaviors, thus, in order to used them for
automated driving, the models require modifications,
extensions or replacement with new models. Sugges-
tions for approaches on how to extend current models
exist, but while large scale field data remains unavail-
able to validate them, any approach will include large
uncertainties.
The presence of AVs is expected to gradually in-
crease over the next decades (Calvert et al., 2017; Mi-
lakis et al., 2017; Tillema et al., 2017; Litman, 2015).
142
Postigo, I., Olstam, J. and Rydergren, C.
Effects on Traffic Performance Due to Heterogeneity of Automated Vehicles on Motorways: A Microscopic Simulation Study.
DOI: 10.5220/0010450701420151
In Proceedings of the 7th International Conference on Vehicle Technology and Intelligent Transport Systems (VEHITS 2021), pages 142-151
ISBN: 978-989-758-513-5
Copyright
c
2021 by SCITEPRESS – Science and Technology Publications, Lda. All rights reserved

During this transition period, public acceptance and
AV-related technologies will evolve, allowing follow-
ing generations of AVs to gradually have less conser-
vative driving styles. It is reasonable to expect that
different generations of AVs, with different capabili-
ties and driving styles, will be present on roads along-
side human driven vehicles.
This study aims to investigate the range of poten-
tial impacts on motorway traffic performance caused
by the simultaneous presence of different types of
AVs and human driven vehicles. This coexistence is
expected during the transition to a predominant pres-
ence of AVs. The impact on traffic performance is
measured in terms of vehicle throughput and travel
delays.
A simulation experiment using the microscopic
traffic simulator Vissim is presented. The simulation
experiment includes multiple scenarios, with increas-
ing market penetration rates of AVs and with differ-
ent mixes of three driving logics within the AV share.
The three AV driving logics represent different gener-
ations of AVs and the evolution of their driving capa-
bilities. They were developed within the H2020 Co-
EXist project (Coexist, 2020) and are implemented in
Vissim (Sukennik, 2018b).
The remaining of this article is structured as fol-
lows. Section 2 presents a background on which this
study is base and limitations of microscopic models
for modeling automated driving. The simulation ex-
periment is described in Section 3, a description of the
simulated motorway segment, a conceptual descrip-
tion of the different driving logics used for AVs and
details of the included scenarios. Section 4 presents
the results and the impact of AVs on traffic perfor-
mance in terms of change in capacity by measuring
throughput and travel delays. Finally, Section 5 ends
the article with conclusions and need for future re-
search.
2 BACKGROUND
Some commercially available vehicles are currently
implemented with advanced driving assistance sys-
tems like adaptive cruise control (ACC) or lane cen-
tering systems which automate the driving experience
to a certain degree. Top global automakers claim to
have fully automated driving vehicles available for
consumers by the early 2020s. However, current
available automated driving systems are not yet ca-
pable of operating fully autonomously.
The society of automotive engineers (SAE), which
develops standards for various transport industries,
proposes six levels to describe driving automation
(SAE, 2018). SAE levels 0 to 2 describe driver sup-
port features that assist drivers to different extents
but require the driver to steer, brake or accelerate as
needed to maintain safety. The more advanced levels
(SAE levels 3 to 5) describe automated driving fea-
tures, from optional automated driving under specific
conditions to full automated driving on any condition.
First generations of AVs (SAE level 3) are ex-
pected to have automated driving as an option under
specific conditions with the driver still responsible for
the driving. While first SAE level 3-4 vehicles could
be expected by early 2020s, some studies give a time
estimation of decades until AVs become a consider-
able share of the vehicles and automated driving be-
comes the norm.
In (Tillema et al., 2017) the penetration rate of
AVs is estimated by the different levels of automa-
tion, taking around 15 years for AVs to have percep-
tible effects on traffic flows and up to 50 years for
AVs to be a prevalent presence on roads. In (Milakis
et al., 2017) the transition path to a prevalent presence
of AVs depends on different factors from local gov-
ernmental policies to technology development. While
the path remains unclear, (Milakis et al., 2017) sets
horizons for the years 2030 and 2050 for transport
implications in the Netherlands caused by the wider
deployment of AVs. In (Calvert et al., 2017), based
on different sources, it is estimated that it will take
at least 15 years until 20% of the vehicles become
automated. Based on patterns it took previous vehi-
cle technologies to be deployed, cost of the technol-
ogy and sales projections, (Litman, 2015) estimates
a period of three to five decades until the majority of
trips are made by AVs. (Litman, 2015) presents es-
timations from 2013, and predict a small number of
AVs by the time this study is presented (2020). How-
ever, most advanced commercially available vehicles
are not yet capable of fully automated driving though
there are claims from vehicle manufacturers that it is
just around the corner. Overall, it is estimated that it
is a matter of decades until AVs become predominant
in roads.
Different traffic simulation studies aiming to in-
vestigate the impacts caused by AVs can be found
in the literature. Effects caused by different vehi-
cle technologies on different road environments have
been investigated. The impact of AVs on urban en-
vironments has been investigated (Lu et al., 2019), in
which AVs were modelled by modifying parameters
in the car following model. Analysis on the effects of
ACC and cooperative adaptive cruise control (CACC)
are commonly found in the literature (Liu et al., 2018;
Yuan et al., 2009; Arem et al., 2007; Minderhoud and
Bovy, 1999), but analysis are limited to longitudinal
Effects on Traffic Performance Due to Heterogeneity of Automated Vehicles on Motorways: A Microscopic Simulation Study
143

control of the ACC or CACC and not to vehicles capa-
ble of overtaking or lane changes. The impact of AVs
in merging roadways is investigated in (Rios-Torres
and Malikopoulos, 2017). The influence of AVs on
flow stability and throughput is studied in (Talebpour
and Mahmassani, 2016). The studies have shown that
AVs will affect traffic flows in different ways, both
improving or degrading traffic performance. Usu-
ally, it is assumed that all AVs will drive according to
the same driving logic (e.g. (Olia et al., 2018)), and
their impacts are commonly estimated by including
scenarios with increasing market penetration rates of
AVs. Moreover, the approaches taken to model AVs
or automated driving in simulation investigations vary
from study to study.
Microscopic simulation models have been devel-
oped aiming to describe human driving behavior. To
model the driving logic of AVs, these models need to
be modified, extended or replaced. Modifying param-
eters of existing car following models or lane chang-
ing models is a fast and simple approach to model
AV driving logics. This could for example be modi-
fications on distances kept between vehicles, reaction
times, accepted distances for lane changing, acceler-
ation and speed parameters. If a specific feature of
AVs can not be modeled by changing parameter val-
ues, then the models could be extended or replaced.
New or extended models could aim to simulate vehi-
cles sensors, control algorithms or safety features.
Nonetheless, regardless of the approach taken to
model AVs, the calibration of the models is based on
the available data, which currently is limited to exist-
ing partly automated vehicles, and not based on future
automated driving. Therefore, investigations based
on traffic simulation of AVs should consider a range
of possible driving logics for AVs (e.g (Olstam et al.,
2020; Mintsis et al., 2019)).
3 EXPERIMENT SETUP
The purpose of the simulation experiment done in this
study is to enhance the understanding of potential im-
pacts caused by AVs. The simulation experiment has
been delimited to a motorway environment due to the
less challenging conditions they present for first auto-
mated driving systems to consider them within their
operational design domain. The results present the
range of effects on traffic performance caused by dif-
ferent AV mixes, showing the impact of the coex-
istence of different types of AVs alongside human
driven vehicles.
The uncertainties related to the transition to full
vehicle automation and to the evolution of the capa-
bilities of AVs are addressed by including multiple
scenarios in the simulation experiment. The transi-
tion period to full vehicle automation is considered by
creating scenarios with increasing penetration rates
of AVs, that is, the proportion of AVs present in the
traffic flow. This represents the expected gradual in-
crease in the of number of AVs present in roads. Three
AV driving logics are used to represent the evolution
of AVs. These driving logics assume different lev-
els of cautiousness in their driving styles, recognizing
that as the technology that allows automated driving
advances, AVs will become more reliable in regards
to safety. However, the uncertainty does not relate
only on how the technologies will evolve but also on
how fast they will be implemented in vehicles. Thus,
scenarios with all possible combinations of the three
AV driving logics are included, each combination is
a specific AV mix. They represent both a faster and
a slower evolution of AVs as well as the coexistence
of different types of AVs. The results obtained regard-
ing the effects caused by this coexistence are the main
contribution of this simulation experiment.
The simulation experiment is conducted for a Ger-
man representative motorway stretch (Sonnleitner,
2018). The AVs in the simulation are assumed to have
perfect knowledge of the geometry of the motorway.
Some elements of the motorway, like the position of
lanes or traffic signs, are perceived in reality through
sensors on the vehicle, which is assumed to be per-
fect in the simulation. As seen in Table 1, AVs with
different driving logics interact with different number
of vehicles or objects. The accuracy, latency and re-
liability of the perception of other vehicles or objects
depend on whether the perception is done through on
board sensors or through connectivity features. This
perception is assumed to be perfect in the simulation
and with zero latency, and how it is accomplished is
implicitly included in the driving logics.
Future motorways might support automated driv-
ing by including digital infrastructure which will pro-
vide static and dynamic information to the AVs. The
infrastructure support for automated driving (ISAD)
(Carreras et al., 2018) considered in the simulation
experiment is ISAD-level D or E, which corresponds
to a conventional infrastructure with little support for
automated driving. The vehicles in the simulation per-
ceive different number of leading or trailing vehicles,
as well as immediate vehicles in target lanes for lane
changing maneuvers, they don’t have additional in-
formation about the traffic conditions elsewhere along
their routes. Since there is no support from the infras-
tructure included in the motorway model, all dynamic
driving tasks are handled by the driving logics.
VEHITS 2021 - 7th International Conference on Vehicle Technology and Intelligent Transport Systems
144

3.1 Modeling of Automated Vehicles
The three driving logics used to model AVs are called:
cautious, normal and all-knowing. These driving log-
ics were developed within the H2020 CoEXist project
(Coexist, 2020) and are implemented in Vissim. They
are not exact driving algorithms, instead they rep-
resent different levels of cautiousness based on the
possible behaviour of AVs and how they would re-
solve conflicts, e.g. reaction times, gap thresholds,
etc (Sukennik, 2018b). The logics are based on the
Wiedemann 99 car following model (PTV, 2020) with
adjusted parameters.
The cautious driving logic is the most conserva-
tive and aims to ensure not only that AVs don’t cause
any accidents, but also to establish confidence on the
public about the safe operation of AVs. This forces
the vehicle to adopt larger distances to surrounding
vehicles. An enforced absolute braking distance fea-
ture is enabled (see Table 4). The absolute braking
distance is the distance a vehicle must keep in order
to brake safely and avoid a collision if a vehicle in
front comes to a sudden full stop. The calculation
of the absolute braking distance considers a vehicle’s
own speed, braking capacity and relative position to
the vehicle in front, it neglects the leading vehicle’s
speed and braking capacity, as it assumes that the ve-
hicle in front could suddenly ”turn into a brick wall”.
This distance is also required for the lane change ma-
neuver, which means that it will have less chance of
taking place, the distance must exist both to the lead-
ing and trailing vehicles in the target lane.
The normal driving logic was developed with the
intention of being similar to human drivers. In con-
trast to human driven vehicles however, AVs with
this driving logic are capable of shorter reaction times
and have more accurate measurements of distances to
other vehicles as well as relative speeds. They are re-
stricted by the range of their sensors to only perceive
vehicles in their proximity and surroundings, unlike
human drivers who are often aware of vehicles be-
yond their proximity.
The all-knowing driving logic intends to model the
most advanced AVs capable of keeping smaller gaps
for all maneuvers and also have shorter reaction times.
AVs with this driving logic are assumed to be con-
nected to the infrastructure and thus receive informa-
tion about vehicles and objects beyond their surround-
ings. This connectivity feature is implicitly included
in this driving logic, as shown in Table 1, all-knowing
AVs interact with 10 objects and 8 vehicles, compared
to only 2 objects and 1 vehicles for the AVs with the
other driving logics.
All implicit stochastics have been disabled for all
AVs, which makes them show less variations on their
driving compared to human drivers. Human driven
vehicles are modeled with a desired speed distribution
which allows them to travel at a much wider range
of speeds, even surpassing the speed limits. On their
side, AVs always comply with the specified speed
limits and are modeled with a desired speed distri-
bution with a range of only ±2 km/h from the speed
limit. The acceleration and deceleration functions are
also different for AVs, showing less variation than hu-
man driven vehicles. The values of the used parame-
ters are presented in Tables 1, 2, 3 and 4.
Table 1 shows the difference in perception mod-
eled for each driving logic. The values show that the
cautious driving logic has a shorter range for percep-
tion. And, as previously mentioned, only the more
advanced all-knowing driving logic is able to perceive
several more vehicles and objects. In Table 2, the ex-
act parameter values used for the Wiedemann 99 car
following model (PTV, 2020) are presented as they
appear in Vissim. These values show the difference
on cautiousness or aggressiveness between the driv-
ing logics. Table 3 shows the values for the param-
eters used to perform necessary lane changes. They
show that acceleration and deceleration is more re-
stricted in the cautious driving logic, as well as the
required distances to perform the maneuver. Lastly,
Table 4 shows the additional functionalities of Vis-
sim used for each driving logic. All values are based
on the recommendations from (Sukennik, 2018a) and
(Olstam et al., 2020).
3.2 Scenarios Setup
Figure 1 shows the model of the motorway used in
the simulation experiment. It is a two lane motorway
going in one direction from point A to point C with
a speed limit of 130 km/h, covering 1 km in length.
The model includes an off-ramp with one lane with a
length of 200 m, and a similar on-ramp. A ’warm-up’
section of 1 km in length was included before point
A which is not shown in the Figure. The main flow
of vehicles will enter the network through point A.
A secondary flow, entering the network through point
B is set to be 25% of the number of vehicles gener-
ated for the main flow. Lastly, the number of vehicles
taking the off-ramp is 20% of the number of vehicles
passing through point A.
The heterogeneity of AV that may exist in fu-
ture motorways was included by creating different AV
mixes. Each unique AV mix, where each AV driving
logic has 0, 20, 40, 60 or 80 or 100% share of the total
number of AVs were created, leading to 21 possible
combinations. Three of these unique mixes contain a
Effects on Traffic Performance Due to Heterogeneity of Automated Vehicles on Motorways: A Microscopic Simulation Study
145

Table 1: Driving behaviour parameters for following in Vissim.
Driving Logic
Cautious Normal All-
knowing
Human
Driven
Look ahead distance
Minimum (m) 0 0 0 0
Maximum (m) 150 250 300 250
Number of interaction objects 2 2 10 2
Number of interaction vehicles 1 1 8 99
Look back distance
Minimum (m) 0 0 0 0
Maximum (m) 150 150 150 150
Table 2: Driving behaviour parameters for car following model in Vissim.
Driving Logic
Wiedemann 99 model Cautious Normal All-
knowing
Human
Driven
CC0 - stanstill distance (m) 1.5 1.5 1.0 1.5
CC1 - headway time (s) 1.5 0.9 0.7 1.05
CC2 - ’following’ variation (m) 0.0 0.0 0.0 4.0
CC3 - threshold for entering ’follow-
ing’ (s)
-10.0 -8.0 -6.0 -8.0
CC4 - negative ’following’ threshold
(m/s)
-0.1 -0.1 -0.1 -0.3
CC5 - positive ’following’ threshold
(m/s)
0.1 0.1 0.1 0.35
CC6 - speed dependency of oscillation
(10
−4
rad/s)
0.0 0.0 0.0 11.44
CC7 - oscillation acceleration (m/s
2
) 0.1 0.1 0.1 0.25
CC8 - standstill acceleration (m/s
2
) 3.0 3.5 4.0 3.5
CC9 - acceleration with 80 km/h (m/s
2
) 1.2 1.5 2.0 1.5
Table 3: Driving behaviour parameters for lane change in Vissim.
Driving Logic
Cautious Normal All-
knowing
Human
Driven
Maximum deceleration (m/s
2
)
Own -3.5 -4.0 -4.0 -4.0
Trailing vehicle -2.5 -3.0 -4.0 -3.0
-1 m/s
2
per distance (m)
Own 80 100 100 300
Trailing vehicle 80 100 100 200
Accepted deceleration (m/s
2
)
Own -1.0 -1.0 -1.0 -1.0
Trailing vehicle -1.0 -1.0 -1.5 -0.75
Minimum headway (front/rear) (m) 1.0 0.5 0.5 0.5
Safety distance reduction factor 1.0 0.6 0.75 0.6
Maximum deceleration for cooperative
breaking (m/s
2
)
-2.5 -3.0 -6.0 -3.0
VEHITS 2021 - 7th International Conference on Vehicle Technology and Intelligent Transport Systems
146
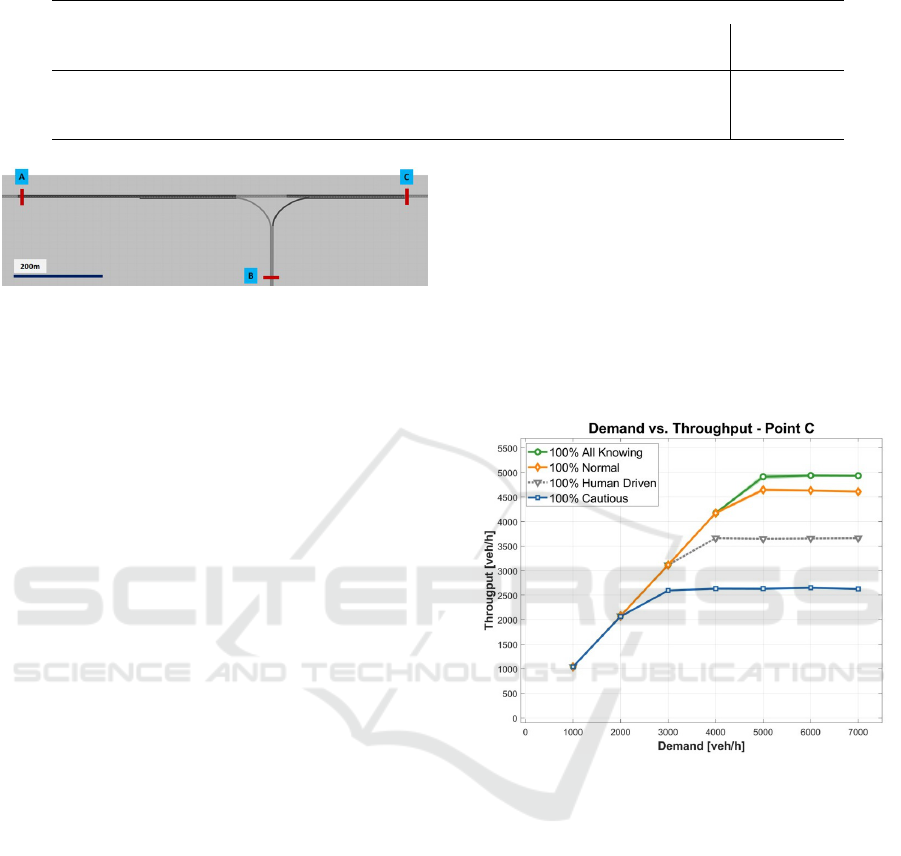
Table 4: Driving behaviour functionalities in Vissim.
Driving Logic
Functionality Cautious Normal All-knowing Human
Driven
Enforce absolute braking distance On Off Off Off
Advanced merging On On On On
Cooperative lane change Off On On On
Figure 1: Motorway model. Flows are generated at points
A and B.
single type of AV. Twelve mixes contain two types
of AV, with one type being 60 or 80% the total num-
ber of AVs. The remaining 6 mixes include all three
types of AVs, where each type is 40 or 60% the total
number of AVs.
The gradual increase of AVs in roads is consid-
ered by including six different AV penetration rates
of 0, 20, 40, 60, 80 and 100%. At 0% penetration rate
there are only human driven vehicles, while at 100%
penetration rate, there are only AVs on the network.
Seven different demand levels for the main flow of
1000, 2000, 3000, 4000, 5000, 6000 and 7000 vehi-
cles per hour (veh/h) were generated before point A.
For the secondary flow, generated at point B, the cor-
responding demands are 250, 500, 750, 1000, 1500
and 1750 veh/h.
Each scenario consists of a specific combination
of demand level, AV penetration rate and AV mix,
giving a total of 742 scenarios, seven of which don’t
include any AVs (0% penetration rate). A simulation
time of one hour plus 30 minutes of ’warm up’ time
until the network reached a stable state was run for
each scenario. The results for are based on 10 repli-
cations with varying random seeds.
Additional scenarios were added to see the impact
of the enforced absolute braking distance feature in
the cautious driving logic. The feature was disabled
and the results compared to the scenarios with a single
AV driving logic.
4 RESULTS AND ANALYSIS
The results of the simulation experiment are presented
in terms of vehicle throughput and travel delay. The
lines shown in the figures are color-coded for each AV
mix, the legend shows thick solid lines indicating the
AV mixes that include a single type of AV. The col-
ors used are cyan for cautious AVs, orange for nor-
mal AVs, green for all-knowing AVs and gray for hu-
man driven vehicles. The remaining 18 lines are not
shown in the legend to avoid cluttering. The color of
each line represents the type of AV is most present in
the mix, while the color of the marker represents the
second most present type of AV. The line is shown
without a maker if there is an equal share between the
remaining two types of AVs. The 95% confidence in-
terval shadows each line in Figures 5 to 8.
Figure 2: Throughput measured at point C for different de-
mands levels generated on the main flow at point A for sce-
narios with a single type of vehicle.
Figure 2 shows the measured throughput at point
C. The Figure shows that each case reaches a max-
imum throughput at different demand levels. The
highest vehicle throughput occurs for the 100% all-
knowing AV mix, almost doubling the maximum
throughput measured for the 100% cautious AV mix.
Every scenario reaches a maximum throughput when
demands on the main flow are higher than 5000 veh/h.
Thus, the effects on vehicle throughput caused by
the different AV mixes at different penetration rates
are more interesting for scenarios with high demands.
The results presented in Figure 3 correspond to a de-
mand on the main flow of 6000 veh/h. Figure 3
shows that the highest vehicle throughput always oc-
curs for the ’100% all-knowing’ AV mix, while the
lowest vehicle throughput occurs for the ’100% cau-
tious’ AV mix. The measured throughput of every
Effects on Traffic Performance Due to Heterogeneity of Automated Vehicles on Motorways: A Microscopic Simulation Study
147
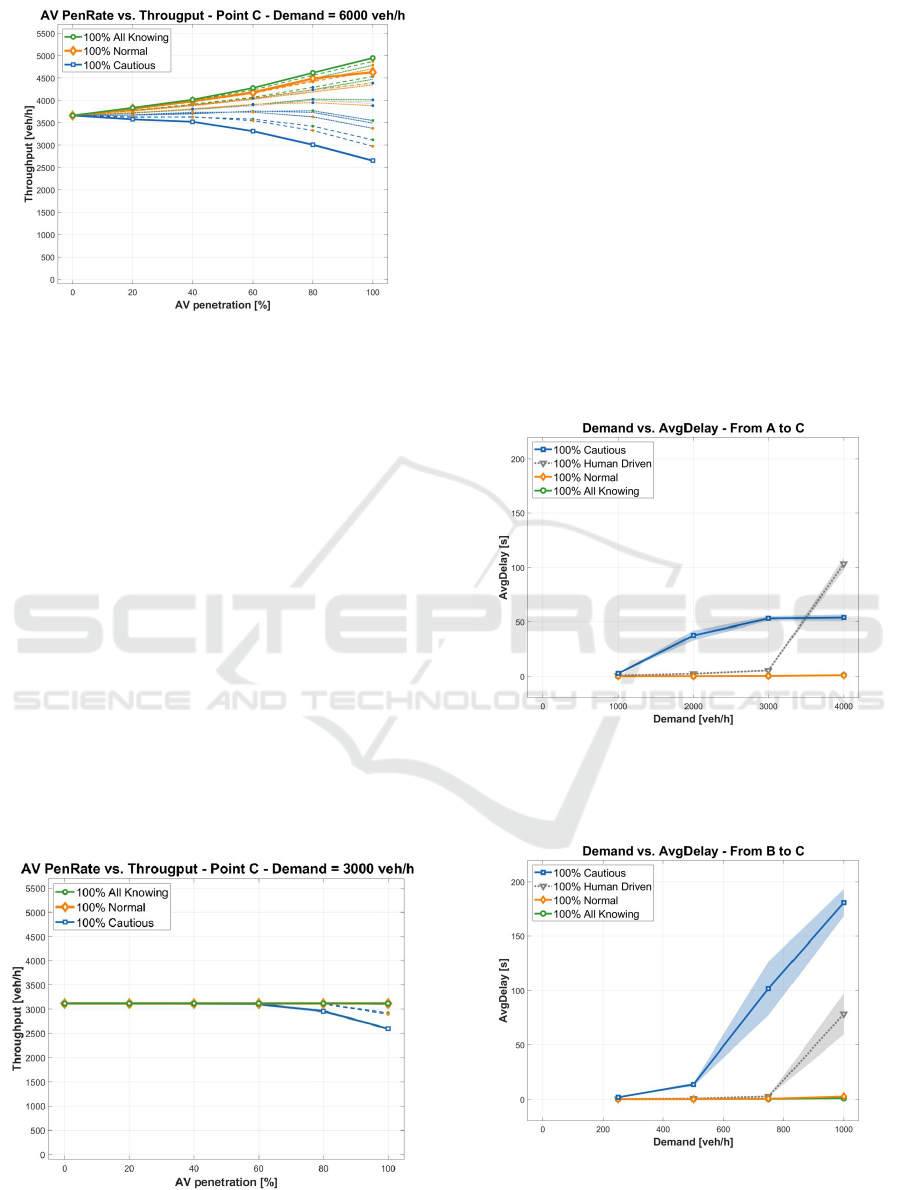
Figure 3: Throughput measured at point C for all 21 AV
mixes at different AV penetration rates for a demand on the
main flow of 6000 veh/h.
other AV mix is found within this range. By closer
inspection of each AV mix, the throughput increases
when the normal, and all-knowing driving logics are
more present in the flow. Similarly, when more AVs
with the cautious driving logic are present, the mea-
sured vehicle throughput decreases even compared to
the case when there are only human driven vehicles
(i.e. 0% AV penetration rate).
Back in Figure 2, it is shown that in the ab-
sence of AVs (100% human driven vehicles), the max-
imum vehicle throughput is observed when the de-
mand on the main flow is above 4000 veh/h. Figure
4 shows the measured throughput for a lower demand
of 3000 veh/h. At this lower demand, effects on ve-
hicle throughput is noticed only at high AV penetra-
tion rates, and occurs for the AV mixes composed by
mostly or by only cautious AVs. Though little im-
pact occurs on vehicle throughput, Figures 5 and 6
show more noticeable impacts on average travel de-
Figure 4: Throughput measured at point C for all 21 AV
mixes at different AV penetration rates for a demand on the
main flow of 3000 veh/h. The lines are mostly overlapping.
lays even at lower demands, both on the main flow, as
well as on the secondary flow.
Figures 5 and 6 show results in terms of aver-
age travel delays for vehicles travelling from point
A to C (the main flow) and from point B to point C
(the secondary flow) respectively. Different demand
levels for scenarios with a single type of vehicle, i.e.
only human driven vehicles and only each type of AV
are presented. The Figures show that compared to the
main flow, the secondary flow shows higher delays for
the AV mix of 100% cautious as demand increases.
The larger gaps required by cautious AVs might be
preventing them to merge into the main flow, causing
the larger increase on delays seen on the secondary
flow.
A more detailed investigation on queue forma-
tion would be required to understand the large in-
Figure 5: Average travel delays for vehicles going from
point A to point C for different demands levels generated
on the main flow at point A for scenarios with a single type
of driving logic.
Figure 6: Average travel delays for vehicles going from
point B to point C for different demands levels generated
on the secondary flow at point B for scenarios with a single
type of driving logic.
VEHITS 2021 - 7th International Conference on Vehicle Technology and Intelligent Transport Systems
148
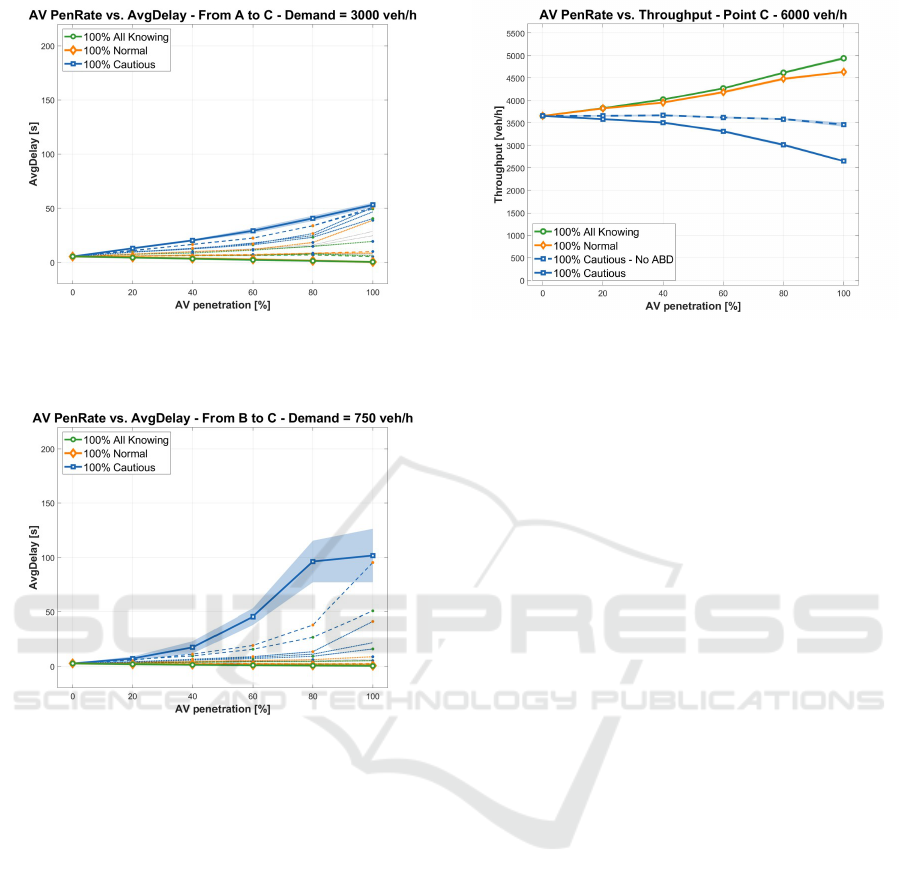
Figure 7: Average travel delays for vehicles going from
point A to point C for all 21 AV mixes at different AV pen-
etration rates for a demand on the main flow of 3000 veh/h.
Figure 8: Average travel delays for vehicles going from
point B to point C for all 21 AV mixes at different AV pen-
etration rates for a demand on the secondary flow of 750
veh/h.
crease in delays seen in the secondary flow as de-
mand increases for the AV mix of 100% cautious.
Based on observations, our hypothesis is that once the
main flow reaches its maximum throughput demands
higher than 2000 veh/h, the required absolute braking
distance prevents most cautious AVs coming from the
secondary flow to merge into the main flow. Simi-
larly, if a cautious AVs comes from the left lane on
the main flow, it might experience problems to switch
to the right lane to reach the off ramp if its route is to
leave the motorway. This could explain the observed
flattening on the average delay curve of the main flow
(A to C) for the AV mix of 100% cautious as demand
increases, shown in Figure 5, as well as the rapid in-
crease of average delays for the same AV mix on the
secondary flow (B to C), shown in Figure 6.
Figures 7 and 8 show the impact of average travel
delays for a demand of 3000 veh/h on the main flow
Figure 9: Throughput measured at point C for AV mixes
with a single AV logic at different AV penetration rates for a
demand on the main flow of 6000 veh/h. An additional AV
cautious driving logic with the enforced absolute braking
distance feature disabled is included.
(A to C, Figure 7) and a corresponding demand of 750
veh/h on the secondary flow (B to C, Figure 8) for dif-
ferent AV penetration rates and for all AV mixes. Sim-
ilar to the vehicle throughput, the minimum and max-
imum average travel delays occur for the AV mixes of
100% cautious and 100% all-knowing. The observed
travel delays of every other AV mix are found within
this range. The average travel delays are higher when
the more cautious AVs are more present in the flow.
The results obtained for the cautious driving logic
could relate to the enforced absolute braking distance
feature. To investigate the impact the feature has in
terms of vehicle throughput scenarios were run with
the enforced absolute braking distance feature dis-
abled, the results are shown in Figure 9. Even though
the measured throughput still decreases as the AV
penetration rate increases, the decrease is not as large
as when the feature is enabled.
The results obtained for the different mixes of
AVs show that effects are intuitive, meaning that the
higher share of less cautious AVs (i.e normal and all-
knowing driving logics), the higher throughput and
the lower average travel delays. Only as the share
of more cautious AVs increases (i.e cautious driv-
ing logic), there is a decrease in measured vehicle
throughput and an increase in average travel delays.
Lastly, the results show that impacts on vehi-
cle throughput are noticeable only at high demands,
while effects on travel delays are noticeable even at
lower demands.
Effects on Traffic Performance Due to Heterogeneity of Automated Vehicles on Motorways: A Microscopic Simulation Study
149

5 CONCLUSIONS
The simulation experiment shows that as automated
driving moves away from cautious driving styles, or
in other words, as the capabilities of AVs allow them
to keep shorter gaps and have faster reaction times,
an increase in the capacity of motorways can be ex-
pected. In the same way, if automated driving does
not evolve and stay as the cautious driving logic,
capacity on motorways could decrease. Moreover,
while the effect on vehicle throughput is unnoticeable
at lower demands, the effect on average travel delays
are noticeable at lower demands.
The results for scenarios with heterogeneous AV
mixes are within the ranges of AV mixes with a single
type of AVs. Thus, the conclusion is that there are no
unexpected effects caused by the interaction between
the different AVs types.
A desirable road-map for the introduction of AV
can be drawn from the results obtained, knowing that
an automated driving style as the cautious driving
logic could have negative impacts and that an evolu-
tion on the driving style of AVs should be encouraged.
The results found from the scenarios with a large
share of cautions AVs indicate that a deeper un-
derstanding of what occurs in the merging zones is
needed. Moreover, since first AVs will most likely
keep large gaps as the cautious driving logic, a deeper
investigation is needed on how to prevent the disrup-
tion of the traffic flow that this cautious driving logic
is causing.
Disabling the enforced absolute braking distance
in the cautious driving logic shows that the high safety
requirements that the feature has is preventing vehi-
cles to merge and might be over cautious. Though
we don’t know the exact details on how the feature
is implemented in Vissim, a relative braking distance
feature would be more flexible, and might accomplish
the same safety requirements without being over cau-
tious.
The simulations assumed AVs to have a perfect
perception, not affected by inaccuracies or latency in-
troduced by sensors or connectivity features. More-
over, the infrastructure considered corresponds to
ISAD-Levels D and E, which provides little support
for automated driving. Changes in the modeling of
perception and/or including digital support from the
infrastructure might allow to change the modeling ap-
proach of automated driving, causing to observe dif-
ferent effects in the traffic flow due to the presence of
AVs.
It is debated how the presence of AVs will af-
fect the driving behavior of human drivers (HF Auto,
2017). This discussion has been left out of the scope
of this study and the assumption made was that the
driving behavior of human driven vehicles will not
change. Future investigations could include changes
on driving behavior of human drivers caused by the
presence of AVs.
The focus of this study has been the effects of
AVs on motorways using Vissim. Further research
could focus on other road environments, using differ-
ent microscopic simulators with different approaches
on how to model automated driving.
Finally, vehicle throughput and average travel de-
lays, show larger differences in results between the
cautious and normal driving logics than between the
normal and all-knowing driving logics. This might
indicate that there is a large benefit of evolving from
the cautious to the normal driving logic. If AVs are
not expected to have such a big leap in their driving
styles, an additional driving logic representing an in-
termediate evolution stage should be included in fu-
ture investigations.
ACKNOWLEDGEMENTS
This research was part of the SMART project funded
by the Swedish Transport Administration (Trafikver-
ket dnr. TRV 2016/20608 and TRV 2019/27044)
and the CoEXist project funded by the European
Union H2020-ART-2016-2017 (grant agreement no.
723201). The authors would like to thank Peter
Sukennik and Jochen Lohmiller (PTV) and Iman
Pereira (VTI) for their support regarding the simula-
tions.
REFERENCES
Arem, B., van Driel, C., and Visser, R. (2007). The im-
pact of cooperative adaptive cruise control on traffic-
flow characteristics. Intelligent Transportation Sys-
tems, IEEE Transactions on, 7:429 – 436.
Calvert, S., Schakel, W., and Lint, J. (2017). Will automated
vehicles negatively impact traffic flow? Journal of
advanced transportation, 2017.
Carreras, A., Daura, X., Erhart, J., and Ruehrup, S. (2018).
Road infrastructure support levels for automated driv-
ing. 25th ITS World Congress, (September):12–20.
Coexist (2020). H2020 CoExist website:
https://www.h2020-coexist.eu/. Jan 2020.
ERTRAC (2019). Connected Automated Driving Roadmap
website: https://www.ertrac.org/. March 2019.
HF Auto (2017). Human factors of automated driving. Final
Report - Publishable Summary.
VEHITS 2021 - 7th International Conference on Vehicle Technology and Intelligent Transport Systems
150

Litman, T. A. (2015). Autonomous vehicle implementation
predictions: Implications for transport planning. Vic-
toria Transport Policy Institute.
Liu, H., Kan, X., Shladover, S., Lu, X.-Y., and Ferlis, R.
(2018). Impact of cooperative adaptive cruise control
on multilane freeway merge capacity. Journal of In-
telligent Transportation Systems, pages 1–13.
Lu, Q., Tettamanti, T., H
¨
orcher, D., and Varga, I. (2019).
The impact of autonomous vehicles on urban traffic
network capacity: an experimental analysis by micro-
scopic traffic simulation. Transportation Letters The
International Journal of Transportation Research.
Milakis, D., Snelder, M., Arem, B., Wee, B., and Homem de
Almeida Correia, G. (2017). Development and trans-
port implications of automated vehicles in the nether-
lands: Scenarios for 2030 and 2050. European Jour-
nal of Transport and Infrastructure Research, 17:63–
85.
Minderhoud, M. and Bovy, P. (1999). Impact of intelligent
cruise control on motorway capacity. Transportation
Research Record, 1679:1–9.
Mintsis, E., Koutras, D., Porfyri, K., Mitsakis, E., L
¨
ucken,
L., Erdmann, J., Fl
¨
otter
¨
od, Y.-P., Alms, R., Rondi-
none, M., Maerivoet, S., Carlier, K., Zhang, X.,
Blokpoel, R., Harmenzon, M., and Boerma, S. (2019).
Deliverable 3.1: Modelling, simulation and assess-
ment of vehicle automations and automated vehicles’
driver behaviour in mixed traffic. Deliverable 3.1 of
TransAID project.
Olia, A., Razavi, S., Abdulhai, B., and Abdelgawad, H.
(2018). Traffic capacity implications of automated ve-
hicles mixed with regular vehicles. Journal of Intelli-
gent Transportation Systems, 22:244–262.
Olstam, J., Johansson, F., Alessandrini, A., Sukennik, P.,
Lohmiller, J., and Friedrich, M. (2020). An approach
for handling uncertainties related to behaviour and ve-
hicle mixes in traffic simulation experiments with au-
tomated vehicles. Journal of Advanced Transporta-
tion, 2020.
PTV (2020). Ptv vissim 2020 user manual. AG Karlsruhe.
Rios-Torres, J. and Malikopoulos, A. (2017). Impact of con-
nected and automated vehicles on traffic flow. pages
1–6.
SAE (2018). Taxonomy and definitions for terms related
to driving automation systems for on-road motor ve-
hicles, j3016. SAE International.
Sonnleitner, J. (2018). Deliverable 2.7: Av ready macro-
scopic modelng tool. Deliverable 2.7 of CoExist
project.
Sukennik, P. (2018a). Deliverable 2.4: Ptv vissim extension
- new features and improvements. Deliverable 2.4 of
CoExist project.
Sukennik, P. (2018b). Deliverable 2.5: Micro-simulation
guide for automated vehicles. Deliverable 2.5 of Co-
Exist project.
Talebpour, A. and Mahmassani, H. (2016). Influence of
connected and autonomous vehicles on traffic flow
stability and throughput. Transportation Research
Part C Emerging Technologies, 71:143–163.
Tillema, T., Gelauff, G., Waard, J., Berveling, J., and Moor-
man, S. (2017). Paths to a self-driving future - five
transition steps identified. KiM Netherlands Institute
for Transport Policy Analysis.
Yuan, Y.-M., Jiang, R., Hu, M.-B., Wu, Q., and Wang, R.
(2009). Traffic flow characteristics in a mixed traf-
fic system consisting of acc vehicles and manual ve-
hicles: A hybrid modelling approach. Physica A,
388:2483–2491.
Effects on Traffic Performance Due to Heterogeneity of Automated Vehicles on Motorways: A Microscopic Simulation Study
151
