
Mapping Siberian Arctic Mountain Permafrost Landscapes by
Machine Learning Multi-sensors Remote Sensing: Example of
Adycha River Valley
Moisei Zakharov
1,2 a
, Sébastien Gadal
1,2 b
, Yuri Danilov
2c
and Jūratė Kamičaitytė
3d
1
Aix-Marseille Univ., CNRS, ESPACE UMR 7300, Univ., Nice Sophia Antipolis, Avignon Univ.,
13545 Aix-en-Provence, France
2
North-Eastern Federal University, 670000 Yakutsk, Republic of Sakha, Russian Federation
3
Kaunas University of Technology, Kaunas, Lithuania
Keywords: Permafrost Landscape, Remote Sensing Modeling, Landscape Mapping, Terrain, Landsat, ASTER GDEM,
Yakutia.
Abstract: The landscape taxonomy has a complex structure and hierarchical classification with indicators of their
recognition, which is based on a variety of heterogeneous geographic territorial and expert knowledge. This
inevitably leads to difficulties in the interpretation of remote sensing data and image analysis in landscape
research in the field of classification and mapping. This article examines an approach to the analysis of intra-
season Landsat 8 OLI images and modeling of ASTER GDEM data for mapping of mountain permafrost
landscapes of Northern Siberia at the scale of 1: 500,000 as well as its methods of classification and
geographical recognition. This approach suggests implementing the recognition of terrain types and
vegetation types of landscape types. The 8 types of the landscape have been identified by using the
classification of the relief applying Jenness's algorithm and the assessment of the geomorphological
parameters of the valley. The 6 vegetation types have been identified in mountain tundra, mountain woodlands,
and valley complexes of the Adycha river valley in the Verkhoyansk mountain range. The results of mapping
and the proposed method for the interpretation of remote sensing data used at regional and local levels of
studying the characteristics of the permafrost distribution. The work contributes to the understanding of the
landscape organization of remote mountainous permafrost areas and to the improvement of methods for
mapping the permafrost landscapes for territorial development and rational environmental management.
1 INTRODUCTION
The development of knowledge-based approaches to
object recognition is one of the most relevant research
areas in machine learning and artificial intelligence
algorithms for image processing and interpreting of
the Earth observation data (Arvor et al, 2019).
Landscape classification and mapping in geography
are traditionally represented by the classification of
the landscape types and categories according to the
characteristics of the vegetation cover, soil, relief,
geomorphology, lithology, etc. Permafrost
landscapes are a complex geographic object in the
a
https://orcid.org/0000-0002-8916-2166
b
https://orcid.org/0000-0002-6472-9955
c
https://orcid.org/0000-0003-4806-4938
d
https://orcid.org/0000-0002-8821-5764
zone of permafrost distribution and the development
of cryogenic processes. They have a complex
hierarchical classification structure (Fedorov, 2018).
Recognition and mapping of permafrost landscapes
objects are based on the multi-fusion data modeling
on the territorial and geographical features of
landscape components. It makes them a
multidimensional object for their recognition using
remote sensing data processing (Boike et al, 2015).
Given the lack of geospatial data of environmental
parameters, remote sensing modeling becomes one of
the main available tools for understanding the spatial
organization of mountain permafrost landscapes in
Zakharov, M., Gadal, S., Danilov, Y. and Kami
ˇ
caityt
˙
e, J.
Mapping Siberian Arctic Mountain Permafrost Landscapes by Machine Learning Multi-sensors Remote Sensing: Example of Adycha River Valley.
DOI: 10.5220/0010448801250133
In Proceedings of the 7th International Conference on Geographical Information Systems Theory, Applications and Management (GISTAM 2021), pages 125-133
ISBN: 978-989-758-503-6
Copyright
c
2021 by SCITEPRESS – Science and Technology Publications, Lda. All rights reserved
125

the Arctic region (Witharana et al, 2021). Accurate
mapping of landscapes is particularly important in
view of the richness of the territory in mineral
resources, as well as in assessing the possibilities of
territorial development and taking effective measures
for environmental management (Kalinicheva et al.
2019). In addition, permafrost landscape types are
used to account for agrobiological resources, such as
reindeer pastures. Landscape taxonomy has a
complex structure, being a heterogeneous knowledge,
so there are obvious difficulties in interpreting land
use/ land cover classes for landscapes and
geographical processes. The classification of
permafrost landscapes used for the territory of Siberia
and Central Asia is based on Milkov's theory of
landscape taxonomy and fractional hierarchical
classification of landscapes, represented on the
Permafrost-Landscape map of the Republic of Sakha
(Yakutia) in scale 1: 1 500,000 (Fedorov et al, 1989).
Classification and Geographic Information System
(GIS) mapping of permafrost landscapes of the
Republic of Sakha (Yakutia) implemented is based on
superimposed analysis of climate-geomorphological,
geological, biotic, and soil factors (Fedorov, 2018).
This methodology allows using the cryoindication
approach to apply remote sensing data and techniques
in the interpretation of vegetation cover. In addition,
remote sensing data are used as a tool for drawing
boundaries in the designation of permafrost
parameters (such as the type of distribution, depth of
occurrence, cryogenic processes), extracted from the
database of the geocryological observatory, and the
collection of field data. Data from multispectral
images are widely used in the analysis and modeling
of vegetation cover and their succession stages, as
well as the thermal regime of permafrost (Shestakova,
2011) from thermal images (Kalinicheva et al. 2019).
These examples allow us to see that remote sensing
data is a relevant and rapidly developing tool in the
study of the permafrost landscape. Machine learning
and artificial intelligence algorithms (including deep
learning), such as Support Vector Machine, (Pal, and
Mather, 2005) and Random Forest (Eisavi, 2015),
have shown significant performance in analyzing
large data sets when modeling mountain permafrost
landscapes on the example of Orulgan ridge in
Verkhoyansk Mountains system (Gadal et al, 2020).
The ability to perform complex hierarchical
classifications has become the main tool for analyzing
changes in the environment. At the same time, the
capabilities of remote sensing data in the paradigm of
geographic processes and complex geosystems
(landscapes), including a set of heterogeneous
knowledge, represent a significant gap in the
representation of geographic knowledge in image
analysis. Research on the development of a
methodology for mapping and recognizing
permafrost landscapes is increasingly combining
machine learning and artificial intelligence methods
in the analysis and the interpretation of remote
sensing data with geographic knowledge and
geographic classification (Huang, 2020). In this
study, we aim to develop a mapping methodology of
permafrost landscapes at an average scale of 1:
500,000 through modeling of intra-seasonal Landsat
8 OLI images and digital elevation model (DEM),
while building a knowledge-based approach to image
analysis and considering two main principles. The
first principle is a classification of permafrost
landscape types, made according to the approach of
permafrost-landscape classification and using the
criteria for their recognition for the possibilities of
correlation with another research. The second
principle is the application of multi fusion model for
integrating the results of image classification into a
spatial database that should be based on determining
the relationship between the ontological status of
image objects and objects of permafrost landscape.
2 METHODS AND MATERIALS
2.1 Study Area
The study area has a size of 60x80 km, and it is
located between 66°26' - 65°53' North latitude and
136°27' - 138°13' East longitude. This is the basin of
the Adycha river, which is the largest tributary of the
Yana River. Mountains belong to the Chersky range
(Adyche-Elginsky plateau) in North-Eastern Siberia.
According to the permafrost landscape map of the
Republic of Sakha (Yakutia) (Fedorov, 2018), this
Arctic region consists of mountain deserts, mountain
tundras, and mountain woodlands, as well as
intrazonal valley landscapes of mountain taiga and
mountain tundra. Medium-high mountains of the
study area are characterized by significant dissection.
The height above the sea level of the watersheds
ranges from 289 to 1715 m. Permafrost type is mainly
a continuous area of frozen strata from 80-100%. The
thickness of the permafrost ranges from 200-400
meters. In addition, according to the permafrost
landscape map, 7 types of landscape vegetation and
10 types of mountain-slope and valley areas are
distinguished in the study area (Figure 1).
GISTAM 2021 - 7th International Conference on Geographical Information Systems Theory, Applications and Management
126
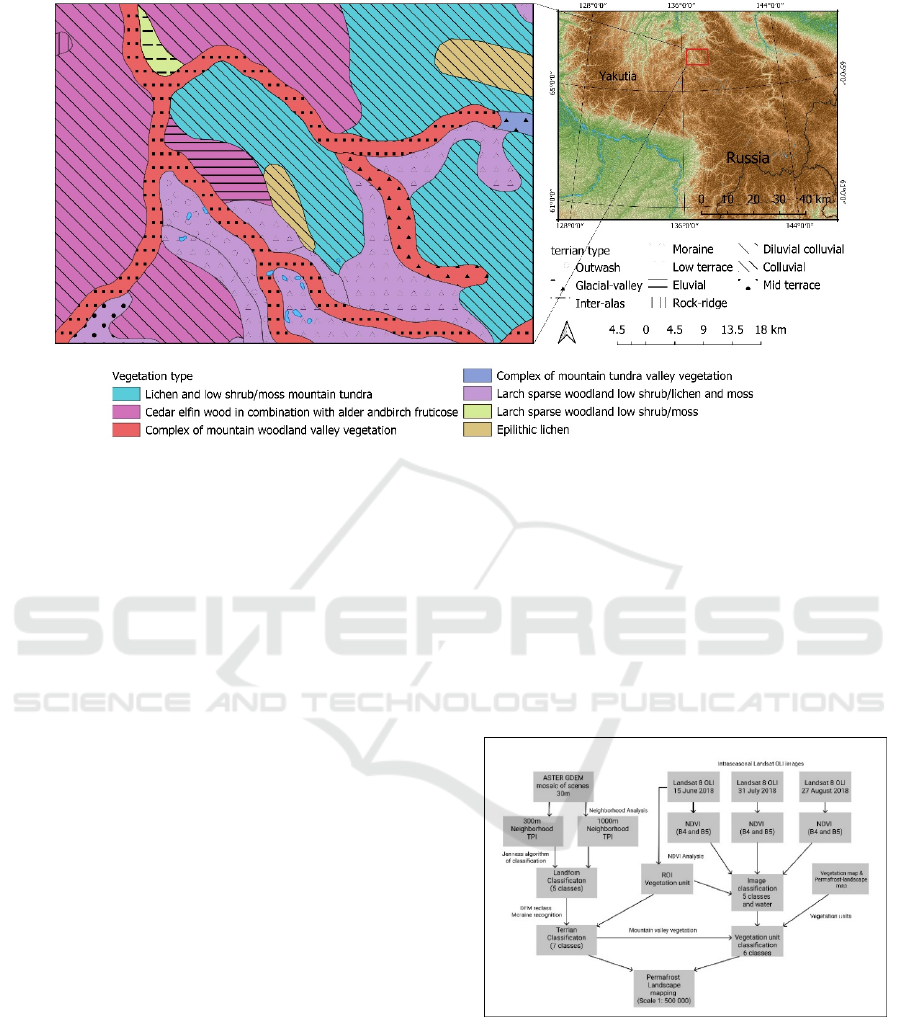
Figure 1: The study area and fragment from the Permafrost Landscape Map of the Republic of Sakha (Yakutia) on Scale 1:1
500 000 (7 vegetation types and 10 terrain types).
2.2 Data and Methods
In this study, we used hybrid data fusion modeling for
landscape recognition based on the classification of
multispectral images based on differences in
photosynthetic activity of different vegetation types
during the growing season, classification of
landforms using TPI (Topographical Position Index)
and methods for mapping the permafrost landscape.
This allowed us to synthesize methods for classifying
objects (classes) of the Earth's surface, which are
closely related to the characteristics of data (mainly
spectral, spatial, radiometric, and temporal
resolution) with categories of permafrost landscapes.
The Landsat 8 OLI images and DEM data with a
spatial resolution of 30 m we used. This kind of
remote sensing is suitable for landscape mapping on
a scale of 1: 500,000 to 1: 100,000. These local scales
are intended to reveal in maps the spatial organization
of the landscape in scales of the types of landscapes,
and the types of terrain. At the same time, we follow
the criteria for selecting terrain types and landscape
types used in the permafrost-landscape mapping.
Terrain types are recognized by the correlation of
stratigraphic-genetic structure and geomorphological
structure of territory. In landscape types, the
recognition criteria are classes of vegetation
associations (vegetation unit). In previous studies
(Gadal et al, 2020) we have based analysis on the
reclassification of a series of multi-time land covers
for vegetation association recognition. In this study,
we conduct a combined classification for three
vegetation indices. This method has increased the
level of automation for selecting vegetation types in
permafrost landscapes (Figure 2). Landsat 8 OLI
images acquired on 15 June 2018, 31 July 2018, and
August 27, 2018, were used in this study. A
preprocessing procedure was performed with
multispectral channels (radiometric calibration,
atmospheric correction using the DOS method (Dark
Object Subtraction)).
Figure 2: Modeling workflow of the permafrost landscape
approach.
Relief data are collected by merging the ASTER
GDEM scenes into a mosaic. The ASTER GDEM
(Global Digital Elevation Model) product developed
by METI (Ministry of Economy, Trade, and Industry
of Japan) and NASA is based on data from the ASTER
sensor of the Terra satellite. ASTER GDEM is the most
improved DEM dataset that has been GDEM3,
Mapping Siberian Arctic Mountain Permafrost Landscapes by Machine Learning Multi-sensors Remote Sensing: Example of Adycha River
Valley
127
released in 2019 available at 30 meters’ resolution
(Abrams et al 2020). It covers an area up to 83 latitudes
and has high detail for mountainous areas.
3 RESULTS
3.1 Terrain Types by Landform
Classification using Topographic
Position Index
The main factor in determining the types of terrain is
the topography, geomorphological and lithological
features of the rocks. This means that the
stratigraphic-genetic complex, namely the nature of
surface deposits determines the type of terrain. There
are 10 types of the accumulative valley and mountain-
slope areas on the territory of the study (Fedorov,
2018). The boundaries of the slope types of terrain are
determined by its "upper" contact with the flat surface
of the watershed, and on the other side - by the
"lower" junction with the floodplain or above-flood-
terrace types of terrain. The transition of slopes to
accumulative valley areas is carried out using a well-
defined bend along the rear edge of the valley floor.
An exception to the recognition principle is the type
of inter-alas terrain, which is distinguished in flat-
plain territories with the development of thermokarst
formations (Savvinov, 2002).
TPI is often used for automatic calculation of
geomorphometric properties of the earth's surface
(Weiss, 2001, Jenness, 2006, Ratajczak et al, 2009).
Terrain types are determined according to their
comparison with landforms determined by comparing
TPI values. GRASS GIS (neighborhood analysis) and
QGIS software for TPI and slope position are
implemented for the processing with ASTER GDEM.
Positive TPI (>1) values represent locations that
are above the average for their surroundings, as
defined by the neighborhoods. Negative TPI (<-1)
values represent locations that are lower than their
surroundings. TPI values close to zero (1>TPI>-1) are
either flat areas or areas of constant slope (where the
slope of the point is significantly greater than zero).
By defining thresholds for continuous TPI values at a
given scale and checking the slope for values close to
zero, terrain types can be classified into discrete slope
position classes (Jenness, 2006). Through
neighborhood analysis, TPI's are generated in scales
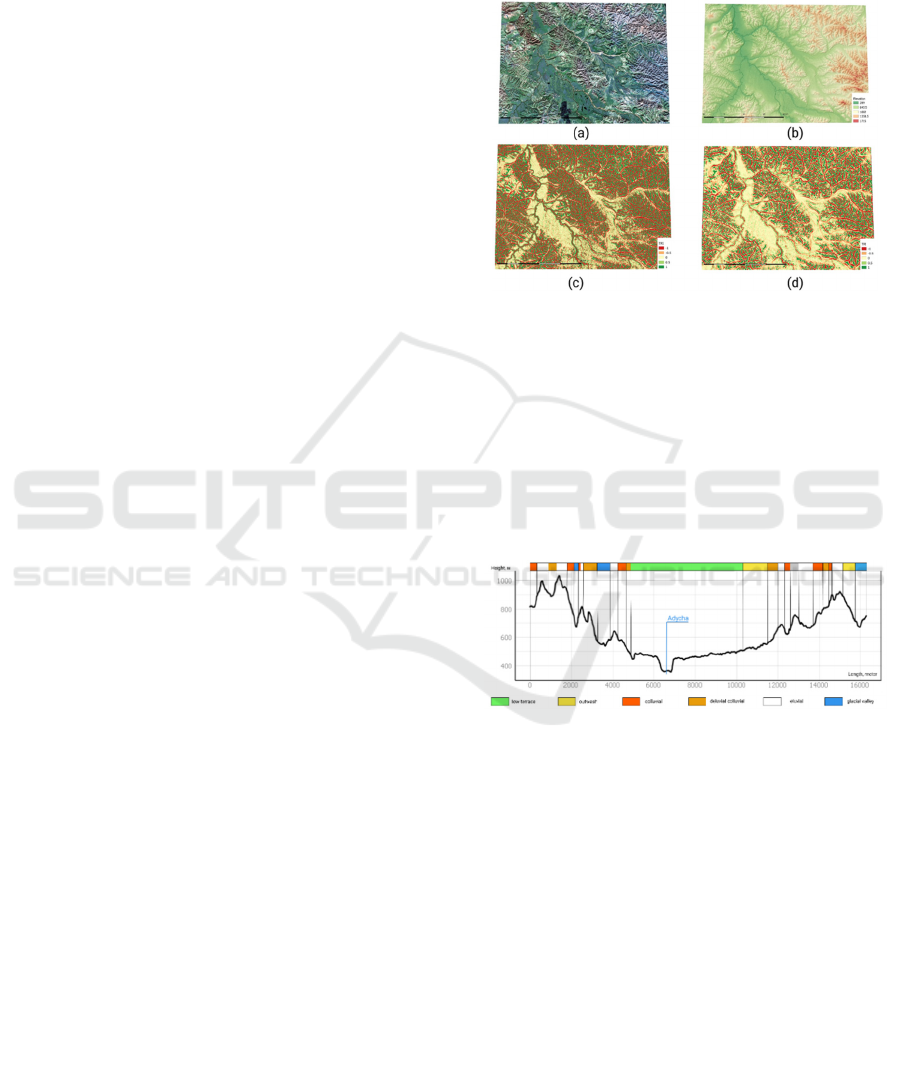
300 m (Figure 3, c) and 1000 m (Figure 3, d).
Using the GIS-based Jenness landform
classification algorithm (Jenness, 2006), we were
able to identify 5 types of terrain: eluvial (rocky and
mountain top), colluvial (steep mountain slopes),
diluvial-colluvial (foothills and lower parts of slopes),
river valleys and glacial valleys (the bottom of the
trough valleys) (Figure 4). We had to combine inter-
alas and outwash and mid-terrace.
Figure 3: a) RGB (2-3-4 bands) Landsat 8, 27 august 2018;
b) DEM 30m, mosaic of ASTER GDEM scenes; c) 300m
Neighborhood TPI; d) 1000m Neighborhood TPI.
Determining the moraine type of terrain based on
slope analysis is difficult. When solving this issue, we
used the color composite of 2-3-4 bands of Landsat 8
of a summer image that can determine the side
moraines designed when the glacier melts into the
valley slopes in the form of ramparts or moraine
terraces.
Figure 4: Hisometric profile with terrain types of Adycha
river valley.
The low-terrace type of terrain is determined by
the height of the valley section with a threshold of 500
m. According to the criteria for identifying low
terraces, only the Adycha river valley is located
below 500 meters. The valley of Adycha River of a
large tributary belongs to well-drained low-terraced
terrain types.
The map of terrain types (Figure 5) shows a
significant difference in the spatial distribution of
terrain types, in comparison with the permafrost-
landscape map, while the general pattern remains.
The Adycha river basin in the study area is
characterized by a strongly dissected and well-
drained accumulative plain and by the presence of
many trough glacial valleys.
GISTAM 2021 - 7th International Conference on Geographical Information Systems Theory, Applications and Management
128
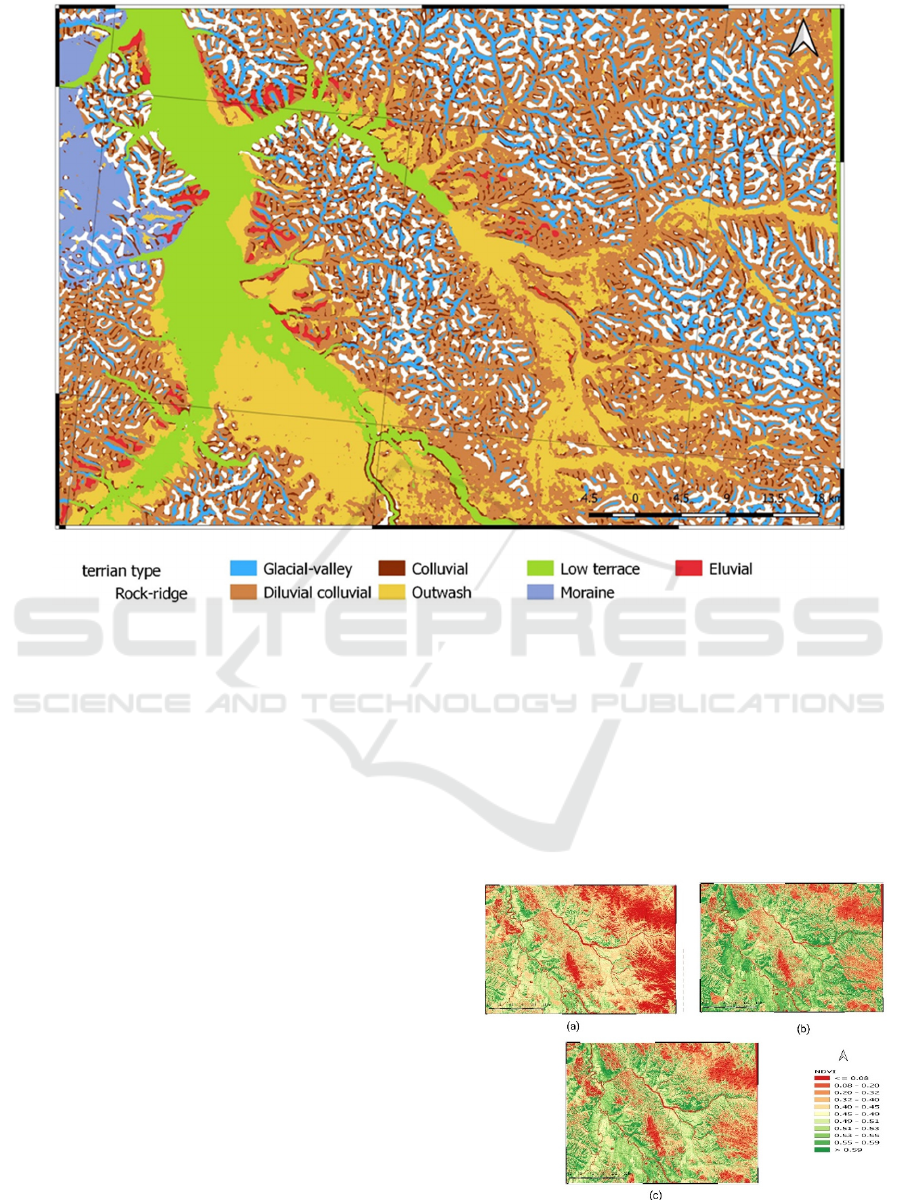
Figure 5: Permafrost landscape terrain type map by ASTER GDEM/ Scale 1:500 000.
3.2 Vegetation Unit of Permafrost
Landscape Recognition
For the interpretation of the vegetation types, we
applied the method of using the series of intra-season
multispectral satellite images. The processes of
accumulation and destruction of chlorophyll and
changes in the water content in them are associated
with phenological cycles and cause variations in the
spectral-reflective characteristics of vegetation
(Stytsenko, 2018). The seasonality of the behavior of
vegetation is the result of micro and macroclimatic
aspects, as well as the activities of other living
organisms (Dyah et al, 2012). While for permafrost
landscapes, a significant impact is made by cryogenic
processes and seasonal dynamics of the thawed
permafrost layer. Since the dependence of the spectral
brightness coefficients on the wavelength varies not
only for different objects but also for the same objects
depending on the chlorophyll state and humidity, first,
it depends on the vegetation phase (Stytsenko, 2018).
This method based on phenological patterns is actively
used to classify cropland and pastures by vegetation
indices of time-series images from Sentinel-2 (Belgiu
and Csillik, 2018) and MODIS. This method is
particularly applicable to woodlands and valley
complexes, where the sparsity of the tree layer allows
satellite images to capture the spectral reflections of
shrubs, bushes, and grass, underlying forest surface,
playing a leading role in the typification of classes of
vegetation associations. This feature and advantage
allow us to increase the quality of differentiation of
objects depending on the type of shrubs or herbage of
larch woodlands (Elovskaya, 1989).
Figure 6: a) NDVI on 15 June 2018; b) NDVI on 31 July
2018; c) NDVI on 27 August 2018.
Mapping Siberian Arctic Mountain Permafrost Landscapes by Machine Learning Multi-sensors Remote Sensing: Example of Adycha River
Valley
129
The classes of plant associations for training the
algorithm for the classification of vegetation
associations are based on geobotanical studies of the
Chersky ridge, as well as on the types of vegetation
identified on the agricultural map of the Yakut ASSR.
A detailed geobotanical description of the study area
is presented in the works of Nikolin E.G. (Nikolin,
2009) Kuvaev V.B. (Kuvaev, 1960), and others.
Within the Chersky ridge, 5 main landscape-
phytocenotic structures are distinguished, represented
by 4 altitudinal belts and a complex of valley
vegetation. In terms of floristic zoning, the study area
belongs to the Western Verkhoyansk. Woodland and
sparse forest represent the arboreal layer from Larix
cajanderi. The shrubs are dominated by Pinus pumila,
Betula divaricata, Betula exilis, while the layer of
dwarf shrubs is dominated by Ledum palustre,
Vaccinium uliginosum, and Vaccinium vitis-idaea.
The moss-lichen cover is represented by sphagnum
(Sphagnum warnstorfii, Sphagnum fuscum, etc.),
green mosses, and lichens (Cladonia stellaris,
Cladonia arbuscula, Cladonia rangiferina, Cetraria
islandica, Cetraria laevigata, Cetraria cucullata,
Cetraria nivalis, species genera Umbilicaria,
Parmelia, Hypogimnia, etc.) In addition, steppe
communities are formed on the slopes of the southern
exposure. In the valley landscapes, small Ivanchay
meadows are formed, adjacent to floodplain forb
meadows. The vegetation of the valley complexes is
dominated by dwarf birch-shrub and forest
communities, including poplar-chasonian forests
(Isaev et al, 2017).
The dataset compiled from the input images
generated by the Normalized Difference Vegetation
Index (NDVI) (Crippen, 1990) is a typical Vegetation
Index for Remote Sensing Vegetation Analysis. This
method is a local application of phenology-based
image classification (Son et al, 2014). The proposed
automated method of vegetation cover mapping,
based on the analysis of short time series, allows
circumventing the restrictions imposed by a single
classification date.
The maximum likelihood (ML) classification
algorithm based on calculating the probability
distribution for the classes, let us evaluate whether a
pixel belongs to the land cover class by Bayes'
theorem. This algorithm requires enough pixels for
each learning area to compute the covariance matrix
(Congedo, 2018). This algorithm is known for its high
efficiency and gives the greatest advantage to the
dominant classes of the study area. In addition,
among the class pairs that overlap in the spectrum,
ML favors the dominant class pair. Thus, ML causes
the retooling of most of the dominant classes in the
study area (Shivakumara et al, 2018). Training
samples for vegetation classes and water are
determined by the color composite (4-5-3), (2-3-4)
using the vegetation map of the Yakutian ASSR
(Elovskaya, 1989) to determine the spatial
distribution of vegetation communities and features
of their species by the analysis of NDVI during the
vegetation season.
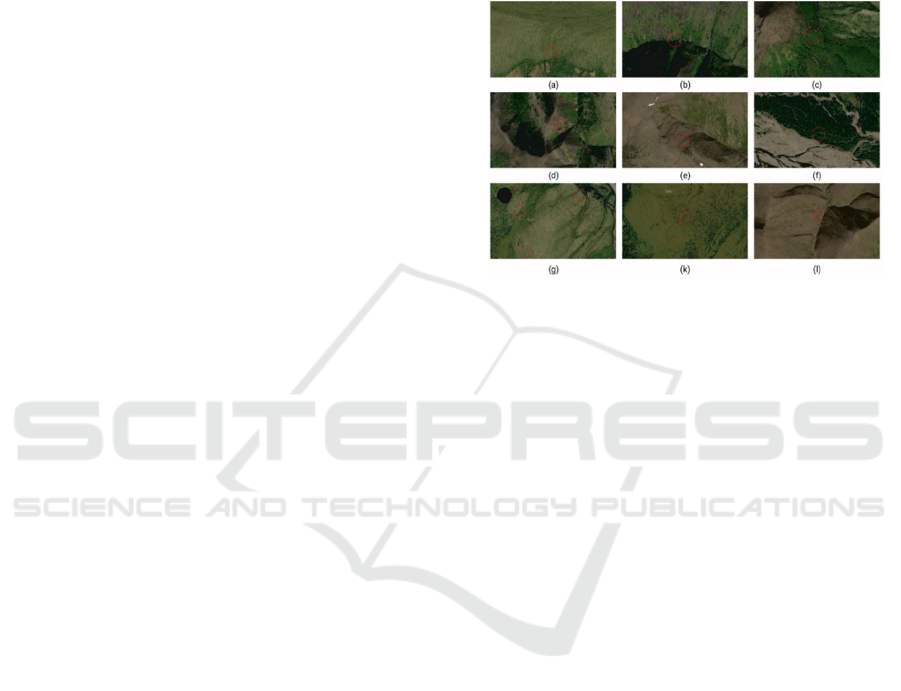
Figure 7: Yandex color composite image (CNES 2018,
Distribution Airbus DS), the fragment of random point a),
g), Larch woodlands lichen; b), l) Complex of mountain-
tundra vegetation of trough valleys; c) Larch woodlands
lingonberry green moss-lichen; k) Larch sparse green moss-
sphagnum with bogs; d), e) epilithic-lichen stony deserts
with areas of mountain tundra and debris of the slopes of
valleys with areas of steppe vegetation; f) Larch woodlands
and sparse forests with green moss shrub birches.
Data from late June shows low NDVI (Figure 6,
a) responses in mountainous areas, in some areas
covered with snow from heights of more than 1600
meters. High NDVI values are observed in low-
terraced areas with open larch forests covered with
dwarf birches and green moss. In July (peak of the
green season) the spectral response of the valley
vegetation complexes is almost the same with a
resolution of 30 m, and the high NDVI values (Figure
6, b) are the reason for the classification for dark and
light wood cover. As expected, only areas with
epilithic-lichen vegetation and areas exposed to forest
fires remain with zero NVDI values. In August, it is
possible to separate the areas of valley larch
vegetation in sphagnum bogs and in humid areas by a
drop in NDVI values (Figure 6, c). In the valley areas,
it is possible to clearly distinguish the areas of larch
open spaces with lichens by the permanence of the
average NDVI values.
When there is a real lack of ground check data at
the appropriate scale, the only acceptable method for
assessing accuracy is the method of generating
random points and correlating the classification
results
with the available higher resolution data
GISTAM 2021 - 7th International Conference on Geographical Information Systems Theory, Applications and Management
130
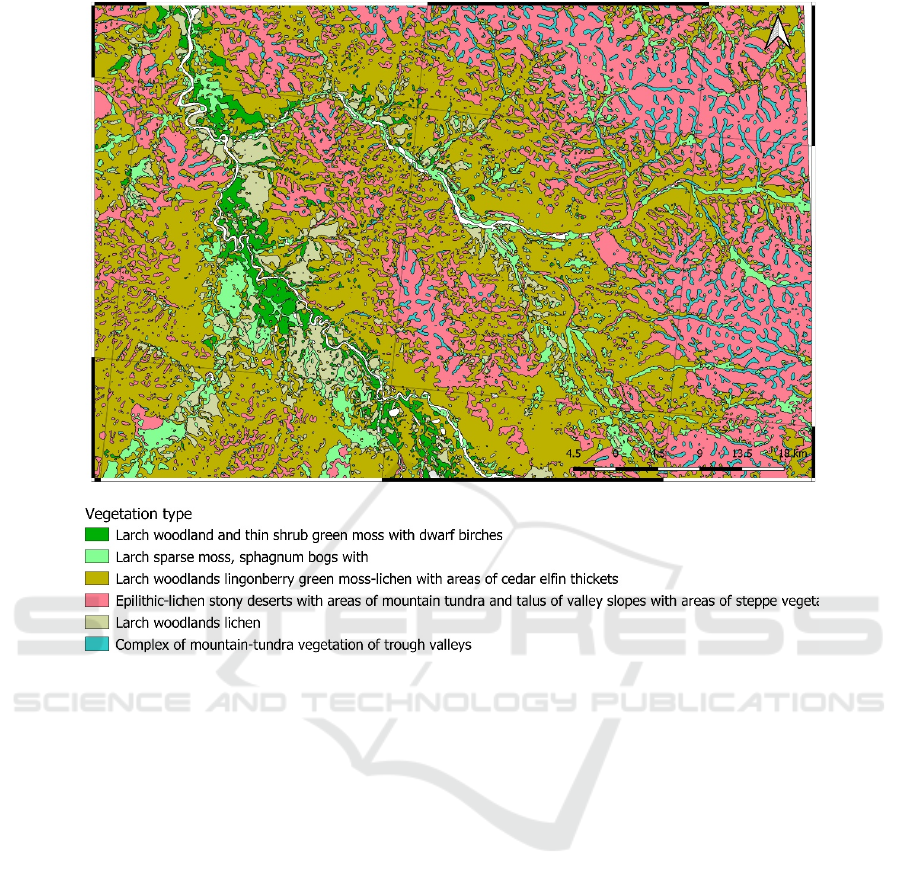
Figure 8: Permafrost landscape vegetation unit map by Landsat 8 OLI image series 2018-2020. Scale 1:500 000.
Yandex Satellite, Google Earth (Figure 7). Overall
accuracy was 78% and Kappa coefficient 0,71 with
500 random points. Based on the classification
obtained, a vegetation map of permafrost landscapes
was created, showing 6 types of vegetation cover with
an acceptable level of classification accuracy. The
resulting map (Figure 8) reliably, at the present level
of exploration of the territory, conveys the spatial
organization of plant associations.
4 DISCUSSION
In the context of climate change and permafrost
degradation, qualitative modeling is of particular
importance (Fedorov, 2019). The quality of remote
sensing data modeling depends on basic landscape
and geographic knowledge, geobotanical descriptions
of the territory, and the availability of a variety of
cartographic materials in geology, geomorphology,
and soil distribution. The obtained maps and the
described method are intended to contribute to the
development of mapping of permafrost landscapes,
including by modeling remote sensing data. The
results obtained can be used to create maps on a local
scale that are suitable for considering the
agrobiological resources of areas, but also for
understanding the local cryogenic conditions of
mountain territories.
By comparing maps of vegetation and terrain
types, one can obtain the following information about
the mountainous permafrost landscapes of the
Adycha valley. The spatial distribution of classes of
plant associations is uneven (Figure 8). The most
widespread types are Larch woodlands lingonberry
green moss-lichen with areas of cedar elfin in
mountain sparse forests (47.41%), Larch sparse
forests and dwarf green moss sparse forests with
dwarf birch forests in mountain light forests (3%),
Green moss-sphagnum larch sparse forests with
marsh terraces on accumulative valleys (8.54 %),
Larch woodlands lichen (6%), and a complex of
mountain-tundra vegetation in trough valleys (4.5%).
In total, 4 plant types make up 67% of the total land
cover, 29.38% are epilithic-lichen stony deserts with
areas of mountain tundra and talus of valley slopes
Mapping Siberian Arctic Mountain Permafrost Landscapes by Machine Learning Multi-sensors Remote Sensing: Example of Adycha River
Valley
131

with areas of steppe vegetation. In Adycha river
valley, in low-terraced terrain types, because of the
warming effect of the river, three classes of plant
associations are formed, which are traced in the
dynamics of the green moss index - sphagnum larch
woodlands with marsh, larch woodlands, and dwarf
green moss woodlands with dwarf birch forests in
mountain woodlands and lichen larch forests.
Epilithic-lichen is distributed on the steep slopes of
the mountains of colluvial, near-watershed eluvial,
and rocky terrain types.
5 CONCLUSIONS
The proposed method for recognizing permafrost
landscapes formulates an approach to using
algorithms for processing remote sensing data in
landscape research. The criteria for combining the
results of remote sensing and the geographical
components of the permafrost landscape have been
established. The maps obtained using remote sensing
modeling are a compilation of geographical studies of
a given territory used in the interpretation of
processing results. Therefore, the quality of modeling
directly depends on the level of conceptualization of
geographical knowledge about permafrost landscapes
and the study area. This approach can be implemented
using spatial ontology in the future.
The method used is proposed for mapping at the
local level at scales from 1:500,000, 1: 200,000 to 1:
100,000, when mapping vegetation and mesorelief of
individual territories of mountain permafrost
landscapes that are still difficult to access and labor-
intensive for field research. The lack of opportunities
to interpret cryogenic parameters (such as freezing
depth, rock temperature) can be considered an
obvious shortage of this study. The data obtained on
the spatial distribution of vegetation and terrain types
can be considered a contribution to understanding the
landscape organization of mountain ranges in North-
Eastern Siberia. It can also be used to study the
cryogenic conditions of mountain regions.
The development of methods for mapping and
classification of the permafrost landscapes and other
geographic objects of the landscape is directly
dependent on the level of accumulated geographic
knowledge about the territory and the geographic
processes. Remote sensing can be used for
developing the knowledge-based approach for image
processing and image analysis. This study proposes
one of the possible approaches to remote sensing
modeling for mountain permafrost landscapes.
ACKNOWLEDGEMENTS
We express our gratitude to Fedorov A.N., for the
provided vector data of the Permafrost-landscape
map, consultation, and advice. We also thank the
Yakutsk Branch of the Russian Botanical Society for
their help in identifying classes of vegetation
associations.
This research was supported by the French
National Research Agency (ANR) through the PUR
project (ANR-14-CE22- 0015), the North-Eastern
Federal University, the CNRS PEPS RICOCHET
program, and the Vernadsky Grant of the French
Embassy in the Russian Federation
REFERENCES
Abrams, M.; Crippen, R.; Fujisada, H. 2020 ASTER Global
Digital Elevation Model (GDEM) and ASTER Global
Water Body Dataset (ASTWBD). Remote Sens., 12,
1156.
Arvor D., Belgiu M., Falomir Z., Mougenot I., Durieux, L.
2019, Ontologies to interpret remote sensing images:
why do we need them? GIScience & Remote Sensing,
56:6, 911-939, DOI: 10.1080/15481603.2019.1587890.
Boike J., Grau T., Heim B., Gunther F., Langer M., Muster
S, Gouttevin I., and Lange S. 2015 Satellite-derived
changes in the permafrost landscape of central Yakutia,
2000–2011: Wetting, drying, and fires, Global and
Planetary Change, vol. 139, pp. 116- 127.
Belgiu M., Csillik O. 2018 Sentinel-2 cropland mapping
using pixel-based and object-based time-weighted
dynamic time warping analysis Remote Sensing of
Enviroment 204, 509-523
Crippen, R.E. 1990 'Calculating the vegetation index faster,'
Remote Sensing of Environment, 34, 71-73.
Congedo L. 2018. Semi-Automatic Classification Plugin
Documentation. Release 6.0.1.1 //, 189 c.
Dyah R. Panuju and Bambang H. 2012. Trisasongko
Seasonal Pattern of Vegetative Cover from NDVI
Time-Series,
Eisavi V., Homayouni S., Maleknezhad A., Yazdi A. 2015.
Land cover mapping based on random forest
classification of multitemporal spectral and thermal
images. Chemistry, Medicine Environmental
Monitoring and Assessment 187
Elovskaya, L.G.; Petrova, E.I.; Teterina, L.V.; Naumov,
E.M. 1989. Soil map. In Agricultiral Atlas of Yakut
ASSR; GUGK: Moscow, Russia; pp. 40–41. (In
Russian)
Fedorov, A.N. 1991. Permafrost Landscapes of Yakutia.
Classification and Mapping Issues; Permafrost
Institute: Yakutsk, Russia. (In Russian)
Fedorov, A.N. 2019. Permafrost Landscapes: Classification
and Mapping. Geosciences, 9, 468
GISTAM 2021 - 7th International Conference on Geographical Information Systems Theory, Applications and Management
132

Fedorov, A.N.; Botulu, T.A.; Varlamov, S.P.; Vasiliev, I.S.;
Gribanov, S.P.; Dorofeev, I.V.; Klimovskii, I.V.;
Samsonova, V.V.; Soloviev, P.A. 1989. Permafrost
Landscapes of Yakutia (Explanatory Note to the
Permafrost Landscape Map of the Yakut ASSR (Scale
1: 2,500,000); GUGK: Novosibirsk, Russia,
Fedorov, A.N.; Vasilyev, N.F.; Torgovkin, Y.I.;
Shestakova, A.A.; Varlamov, S.P.; Zheleznyak,M.N.;
Shepelev, V.V.; Konstantinov, P.Y.; Kalinicheva, S.S.;
Basharin, N.I. 2018 Permafrost-Landscape Map of the
Republic of Sakha (Yakutia) on a Scale 1:1,500,000.
Geosciences, 8, 465.
Gadal S, Zakharov M, Danilov Y, Kamičaitytė J. 2020.
Remote Sensing of Mountain Permafrost Landscape by
Multi-Fusion Data Modeling. Example of Verkhoyansk
Ridge (Russia). IEEE International Geoscience and
Remote Sensing Symposium, Online, United States.
pp.3082-3085
Gadal S, Zakharov M, Kamičaitytė J, Danilov Y 2020Alas
Landscape Modeling by Remote Sensing Image
Analysis and Geographic Ontology. Study case of
Central Yakutia (Russia). 6th International Conference
on Geographic Information Sytems Theory,
Applications and Management, Polytechnic Institute of
Setúbal. pp.112-118
Huang W. 2020. Towards knowledge-based
geovisualisation using Semantic Web technologies: a
knowledge representation approach coupling
ontologies and rules. International Journal of Digital
Earth. Volume 13, - Issue 9
Isaev A.P., Mikhaleva L.G., Chikidov I.I. 2017. Plant
communities of the river basin Arkachan (Central part
of the Verkhoyansk ridge) // Successes of modern
natural science. No. 3. - P. 62-66;
Jeevalakshmi D; Narayana Reddy D; Manikiam D 2006.
Land cover classification based on NDVI using Landsat
8 time series: A case study Tirupati region
Jenness J. 2006. Topographic Position Index (tpi_jen.avx)
extensionfor ArcView 3.x, v. 1.3a. Jenness Enterprises.
Kalinicheva, S.V.; Fedorov, A.N.; Zhelezniak, M.N. 2019.
Mapping Mountain Permafrost Landscapes in Siberia
Using Landsat Thermal Imagery. Geosciences, 9, 4
Kuvaev V.B. 1960. Regularities of the distribution of the
vegetation cover of the Western Verkhoyansk region /
Problems of botany // Mater, on the study of flora and
vegetation of highlands. Vol.5.: M.-L., S. 72-84.
Nikolin, E.G., 2009. General regularities of the altitudinal-
latitudinal distribution of the flora of the Verkhoyansk
Range, in Soils and Vegetable World of Mountain
Territories. M.: KMK, S. 235-239.
Pal, M. and Mather, P. 2005. Support vector machines for
classification in remote sensing. In International
Journal of Remote Sensing Vol.5. pp. 1007-1011
Ratajczak, M., Jasiewicz, J. 2009. Application of free open-
source software tools to automatic and semiautomatic
classification of landforms in lowland areas.
Geomorphologia Slovaca et Bohemica, 1, p. 43-52
Savvinov D.D., Prokopyev N.P., Fedorov V.V., Gorokhov
A.N., Dmitriev A.I., Pesterev A.P., Gavrilyeva L.D.,
Poiseeva S.I., Arkhipov V.V., Averensky A.I.,
Larionov A.G., Bosikov N.P., Kilibeeva O.N.,
Gabysheva P.E. 2002. Alas ecosystems - Institute of
Applied Ecology of the North of the Academy of
Sciences of the Russian Federation (Y), - pp. 45-68
Shats, M.M.; Dorofeev, I.V.; Fedorov, A.N. 1987.
Experience the landscape and permafrost mapping
Southern Yakutia. In Natural Conditions Reclaimed
Regions of Siberia; Permafrost Institute: Yakutsk,
Russia; pp. 49–55.
Shestakova, A.A. 2011.Mapping of the Permafrost
Landscapes Taking into Account Vegetation
Succession (for Example of the Prilensky Plateau).
Ph.D. Thesis, Permafrost Institute, Yakutsk, Russia, (In
Russian)
Shivakumara B., Rajashekararadhya S. 2018 Investigation
on Land Cover Mapping Capability of Maximum
Likelihood Classifier: A Case Study on North Canara,
India. Procedia Computer Science Volume 143, Pages
579-586
Son N-T, Chen C., Chen R.,Duc N-N., Chang L-Y. 2014.
A Phenology-Based Classification of Time-Series
MODIS Data for Rice Crop Monitoring in Mekong
Delta, Vietnam Remote Sens., 6, pp. 135-156;
Stytsenko E.A. 2018. Development of a technique for
automated interpretation of a vegetation cover with the
integrated use of multi-season zonal space images, PhD
Memory of Engineering Sciences, Moscow
Weiss A. 2001. Topographic position and landforms
analysis. In: Poster presentation, ESRI user conference,
San Diego, CA.
Witharana, C.; Bhuiyan, M.A.E.; Liljedahl, A.K.;
Kanevskiy, M.; Jorgenson, T.; Jones, B.M.; Daanen, R.;
Epstein, H.E.; Griffin, C.G.; Kent, K.; Ward Jones,
M.K. An Object-Based Approach for Mapping Tundra
Ice-Wedge Polygon Troughs from Very High Spatial
Resolution Optical Satellite Imagery. Remote Sens.
2021, 13, 558.
Mapping Siberian Arctic Mountain Permafrost Landscapes by Machine Learning Multi-sensors Remote Sensing: Example of Adycha River
Valley
133
