
Co-simulation of Smart Grids: Dynamically Changing Topologies
in Failure Scenarios
Lukáš Gryga and Bruno Rossi
a
Masaryk University, Faculty of Informatics, Brno, Czech Republic
Keywords:
Smart Grids, Smart Meters, Power Consumption, Co-simulations.
Abstract:
Smart Grids represent an important instance of cyberphysical systems for the energy sector. Due to the many
layers involved and the complexities of interrelations, co-simulations have emerged as a way to integrate
results from different simulators. In this paper, we propose a study of the possibilities of simulating node
failure scenarios with a modification of the Mosaik co-simulation platform to allow for dynamic topologies
changes. We show how co-simulations can help in determining the impact of different failure patterns using a
sample scenario of households and PV units.
1 INTRODUCTION
Cyber-physical systems (CPS) represent collections
of interconnected computing devices linked to the
physical world by means of sensors and actua-
tors (Alur, 2015). As one of the most relevant critical
CPSs, a Smart Grid (SG) is the convergence of Infor-
mation and Communication Technology (ICT), sen-
sors, and power systems to supply electricity to con-
sumers via two-way digital communication with key
goals of reaching high levels of reliability, efficiency,
and resilience (Fang et al., 2011).
While SGs provide many benefits, such as more
flexible demand/response adaptations, or smart ser-
vices provided, the complexity and integration comes
at the expense of the higher importance of reliability
and security aspects (Farhangi, 2010; Lamba et al.,
2019). Complexity and dimensionality are two major
challenges to simulate cyber malfunctions and fail-
ures of Smart Grids. The issue of dimensionality de-
rives from the large number of components that inter-
act concurrently in the cyber and physical parts. The
issue of complexity arises from a wide range of cyber
elements and their interdependencies with the physi-
cal components (Lopez et al., 2018). One way to deal
with complexity and dimensionality issues is to de-
couple the system to smaller parts and test them in
isolation — however, missing in this way the holistic
run of the system (Chren et al., 2016; Schvarcbacher
et al., 2018).
a
https://orcid.org/0000-0002-8659-1520
For this reason, the coupling of the simulations
of different aspects (e.g., power and network domain
simulations) emerged as a way to study and predict
the reliability of SGs in complex scenarios. The cou-
pling of distinct simulators, each one running in their
own runtime environment is commonly defined as co-
simulation. A co-simulation platform allows the inter-
connection of software simulators and hardware emu-
lators to study the behaviour of different components
under specific conditions and scenarios (Vogt et al.,
2018; Strasser et al., 2014).
In this paper, we deal with reliability scenarios
simulated by means of the Mosaik co-simulation plat-
form (Schütte et al., 2011) that we adapt for changes
to node topologies at runtime, allowing to study fail-
ure scenarios in which some power nodes are sub-
ject to failures. For example, a scenario could be a
massive storm causing part of the distribution grid to
shut down, propagating failures to other nodes of the
power network. Overall, we show how simulations
and co-simulations can be useful to study failure pat-
terns once the power network topology has been mod-
elled. We have the following contributions:
• The adaptation of the Mosaik co-simulation plat-
form for runtime dynamic topologies changes to
simulate node failures;
• An experimental evaluation simulating two differ-
ent types of failure patterns and showcasing how
co-simulation can help in evaluating failure pat-
terns;
The paper is structured as follows. In section 2 we
Gryga, L. and Rossi, B.
Co-simulation of Smart Grids: Dynamically Changing Topologies in Failure Scenarios.
DOI: 10.5220/0010448700630069
In Proceedings of the 6th International Conference on Complexity, Future Information Systems and Risk (COMPLEXIS 2021), pages 63-69
ISBN: 978-989-758-505-0
Copyright
c
2021 by SCITEPRESS – Science and Technology Publications, Lda. All rights reserved
63

discuss the background about Smart Grids and their
reliability. In section 3 we discuss about adaptation to
the Mosaik framework (Schütte et al., 2011) for dy-
namic changes to topologies for SG failure modelling.
In section 4 we showcase the modified co-simulation
platform with an experimental evaluation to compare
different patterns of failure emergence. Section 5 con-
cludes the paper.
2 BACKGROUND
A Smart Grid (SG) can be seen as a modern
power grid enabling two-way power flow and at
the same time bi-directional communication between
power suppliers and consumers (Fang et al., 2011).
Controllers, sensors, computer systems, automation
equipment are integrated to provide efficient trans-
mission of electricity, fast restoration in case of fail-
ures, and overall reduced costs for utilities (Goel
et al., 2015). SGs achieve lower power costs for
consumers, reduced peak demand, increased integra-
tion of large-scale renewable energy systems—among
other benefits. Real-time monitoring and recovery of
power generation and distribution is another key char-
acteristic, as the actual state of the grid is monitored
and reported to the network, adapting the power out-
put to the real needs. SGs are also important to in-
crease the usage of renewable sources (e.g., solar en-
ergy), as excess energy generated can be sold, more-
over attempting to reach balance in demand response
programs (Siano, 2014).
Decentralization of the SG led to the introduction
of microgrids. A microgrid is an independent and
small network of electricity users (consumers / pro-
sumers) that can carry out operations independently
from the centralized grid and even isolate itself from
the rest of the power network in case of failure of
the grid, with the so-called islanding mode (Hebner,
2017). The decentralization attempts to avoid sin-
gle points of failure and "domino effects" of failures,
leading potentially to large blackouts.
Internet of Things (IoT) devices also play an im-
portant role in the context of SG, as they open the way
to so-called smart energy scenarios. For example, a
household using a solar-power system (with batter-
ies and sensors) can decide on the best moments for
recharging a Electric Vehicle (EV) (Hebner, 2017).
The many sensors, devices, automation equipment
and different layers pose many challenges both in
terms of security and reliability concerns, with the
smart grids expecting to provide self-monitoring and
self-healing capabilities.
Reliability of a software system is defined as the
probability that the system will function as required
without failures and errors for a certain period of time
(O’Connor, 2012). From this definition, reliability
can be seen as associated to the concept of quality of
service. In traditional grids, reliability, and security of
cyber elements were not considered as critical for the
overall stability of power grids because of the less rel-
evant dependencies between cyber and physical parts.
This situation changed drastically with Smart Grids:
the incorporation of modern IT aspects moved SG
more towards cyber-physical systems, which brings
tighter constraints related to security and reliability.
In modern grids, the cyber part is essential for the
proper functioning of the whole power grid, as it pro-
cesses sensors’ data, monitors the grid, handles se-
curity, and makes power distribution decisions (Lei
et al., 2018). The physical part is thus strongly depen-
dent on the availability of the cyber layer. Power-grid
stability needs to take into account also possible cyber
failures. However, SGs can have a relative advantage
over traditional grids when examining fault-tolerance
and fault-recovery: Supervisory Control And Data
Acquisition (SCADA) systems employed in SGs can
communicate with a multitude of sensors in real-time.
In case of failures, SCADA systems can locate the
area subject to the failure and start self-healing and
notification activities. Such large availability of data
can support a multitude of anomaly detection algo-
rithms and platforms (Rossi and Chren, 2020; Lip
ˇ
cák
et al., 2019).
As every CPS, also SG can be modelled formally
as the interaction of reactive systems constrained by
temporal constraints. Defining formally the compo-
nents can allow to find conditions under which the
constraints are violated. Some parts can be even
solved by means of analytical equations. However,
the complexity of the interactions and the compu-
tational complexity required by the many solvers,
forces in many cases to rely on the usage of simu-
lations. However, due to the many system states, sim-
ulations can be only use to disprove the correctness
constraints defined by invariants in the falsification
process, that is simulations cannot cover all the possi-
ble run cases (Alur, 2015).
Due to the complexity for analytical solutions,
many models were proposed over time for failure
propagation in power grids, each one covering differ-
ent aspects (Guo et al., 2017; Cai et al., 2016; Xiao
and Yeh, 2011): topological models (based on net-
work analysis), stochastic simulation models (proba-
bilistic simulations), statistical models, dynamic sim-
ulation, and interdependent models (studying cou-
pling of interdependent networks cyber and physical).
Since traditional power grids were designed and
COMPLEXIS 2021 - 6th International Conference on Complexity, Future Information Systems and Risk
64

built more than a century ago, there are many mod-
els that examine the reliability of the traditional grids
that have been adapted to Smart Grids. For example,
Barabási-Albert Network Model is based on a simple
failure propagation model to calculate a reliability in-
dex (Chassin and Posse, 2005). Another model that
evaluates the reliability of large photovoltaic power
systems connected to a power grid is proposed in
(Zhang et al., 2012). Co-simulations of IT and power
networks have also been widely used for studying SG
reliability and security concerns (e.g., (Chromik et al.,
2017)).
Simulation in the context of SG has often involved
covering both the power and the network aspects: on
one side, either the simulation of power generation
(e.g., PyPower) or real power emulation devices (RT-
Lab), on the other side network simulators (e.g., OM-
NET++ or NS-3), or specific SG ad-hoc solutions
(e.g., GridLab-D, a whole power distribution system
simulator and analysis platform).
In this paper, we utilize the Mosaik co-simulation
framework to showcase the usage for the definition
of failure scenarios under the condition of changing
network topologies.
3 MOSAIK FRAMEWORK
ADAPTATION
Mosaik is an open-source, discrete-event co-
simulation framework written in Python (Schütte
et al., 2011). It allows interconnecting independent
SG simulators, handling the dataflow between them.
Mosaik also ensures time synchronization between
the different simulators and the simulation can run
with some timing constraints or in real-time mode.
Mosaik is based on SimPy, which is a more general
process-based simulation framework. Although
Mosaik handles data exchange between entities of
different simulators, interconnection of data among
entities in one simulator is beyond the scope of
Mosaik.
Mosaik scenario API provides a way to create
the simulation scenarios, create entities, and establish
dataflow between them. When the scenario is built, it
can be run. Mosaik wraps simulators to SimPy pro-
cesses defined in the scheduler module and gives con-
trol to the SimPy framework. For the goal of this pa-
per, to simulate an attack or a malfunction of a power
node we needed a way to change dynamically the
dataflow (topology) at runtime. For this reason, we
extended the Mosaik framework to support dynamic
topology changes.
In the adopted Mosaik version (2.5.2) the Sce-
nario module allows to define complex topologies
with hundreds of entities and large number of con-
nections. However, dynamic topology changes at run-
time are not possible. Once a scenario is defined and
run, Mosaik passes control to the Mosaik scheduler
that starts the complex chain of processes and events.
When the simulation finishes, the scheduler returns
control to Mosaik. There is no way to change the
topology once the simulation has been started. Fur-
thermore, many Mosaik modules do not support dy-
namic changes in topology. For example, mosaik-web
for visualization of simulation results cannot update
the initial topology once the simulation has started.
3.1 Changes in Scenario Module
The Mosaik scenario module provides an API for
starting simulators, instantiating models of the simu-
lators, and connecting entities (models’ instances) of
different simulators to establish a dataflow.
As a first step for dynamic topologies support, we
extended the module of the disconnect method to re-
move edges from the dataflow graph and the entity
graph. A simple way to simulate node failure, shut-
down, or malfunction is to disconnect the node from
the grid, but the scenario module does not provide
ways to disconnect. We added the possibility to track
time and connection plus disconnection of nodes and
update the scenario’s attribute that stores the last time
the topology was changed. Simulators can request
this information from Mosaik and check whether the
topology has changed since the last step.
The topology builder module is implemented as
a Mosaik simulator. This approach is based on the
idea that the scheduler already manages synchroniza-
tion with the simulator. The scheduler never advances
a successor simulator that is further in the dataflow
chain, before a predecessor simulator stepped further
in time than the successor simulator. In other words,
the topology builder module is inserted at the begin-
ning of the dataflow chain, so it can perform topology
changes on time when needed. The topology builder
simulator communicates with the scenario module ex-
clusively via high-level API as the low-level API does
not support ‘connect/disconnect‘ methods. Therefore,
the simulator has to be started via in-process mode.
The topology builder implements a single model,
and we can create a single entity (topology-change) of
the model. The topology-change entity has to be con-
nected to all simulators whose entities are connected
or disconnected by this entity. It is enough to connect
the topology-change entity to a single arbitrary entity
of each simulator to ensure synchronization. When
we create the topology-change entity, we pass a dic-
Co-simulation of Smart Grids: Dynamically Changing Topologies in Failure Scenarios
65
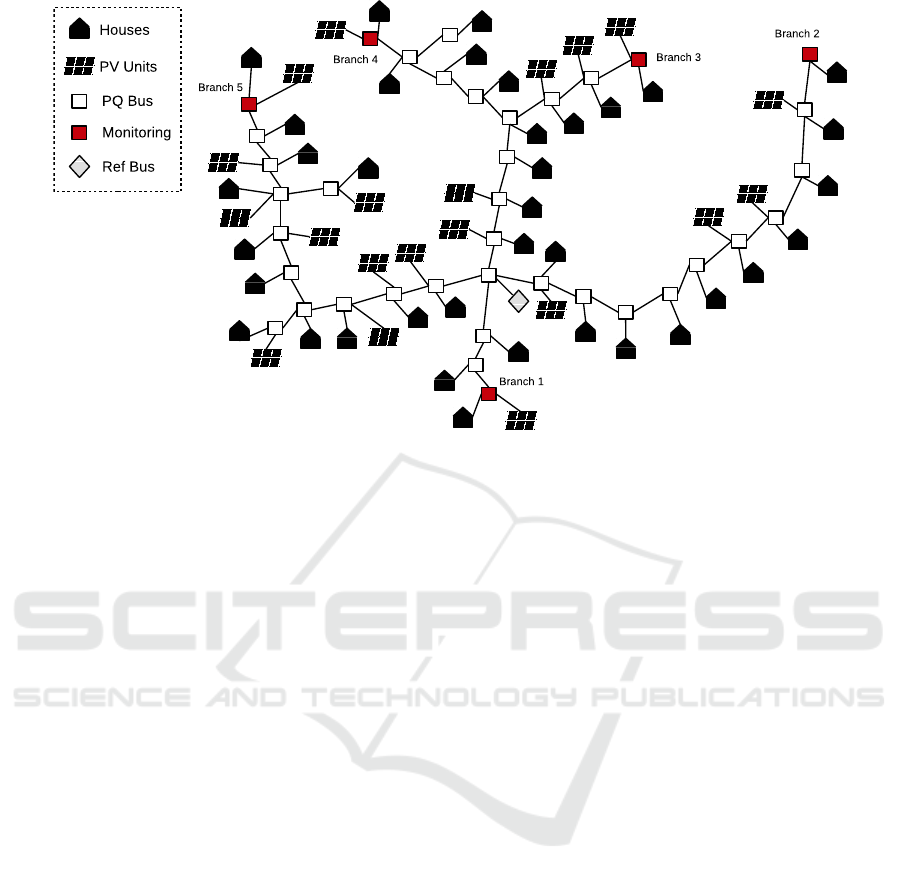
Figure 1: Modified topology from mosaik-demo (adapted from (Offis, 2012)).
tionary that describes all changes in topology during
the simulation as a parameter of the simulators’ create
method.
4 EXPERIMENTAL RESULTS
Since the modified Mosaik can disconnect nodes dy-
namically, it can aid in simulating new categories of
scenarios where nodes are subject to failures due to
device faults or due to cyberattacks. Further details
such as the data from the experimental runs can be
found in (Gryga, 2020).
4.1 Testing Topology
To showcase a failure scenario, we use the topology
from the mosaik-demo repository (Fig. 1). The sce-
nario simulates power distribution in a grid organized
in five main branches.
Mosaik-pypower is a model of power distribu-
tion grid that consists of nodes that are connected via
power lines. There are two types of nodes. PQ node
(PQbus in Fig. 1) takes a real power P and reactive
power Q as input and calculates voltage magnitudes
and angle as outputs. The reference node (RefBus in
Fig. 1) has a constant voltage magnitude and angle.
There is exactly one in the grid and computes reac-
tive power as output. We can also specify parameters
of lines connecting the nodes, such as resistance per
kilometer and maximum current (Offis, 2019). All PQ
nodes are connected to the grid and organized into
branches. A branch is a sequence of PQ nodes that
starts at the central node, and every other node in the
branch is further from the central node. The branch
can fork into subbranches.
Mosaik-household-sim consists of a single house
model. This model represents households that con-
sume power from the grid. It loads a consumption
profile for the specific entities from the filesystem. A
profile in mosaik-demo tries to capture realistic house-
hold consumption patterns, like lower consumption
during the night and higher during the day time.
Mosaik-csv consists of a simple model that loads
data in time:parameter:value format and provides this
data as output. This model is used to simulate PV
units (PV in Fig. 1) that supply the power to the grid
during daytime. It generates the most energy at noon
and lower amount in the morning and evening.
The Monitor is a custom simulator developed for
the purpose of the showcase (red failure nodes at the
end of branches in Fig. 1). It takes voltage as input
and calculates an average voltage per each hour.
4.2 Failures Scenario
To demonstrate the topology builder module, we
modified the original demo simulation and analyzed
scenarios where PV units are subject to failures and
how they affect the voltage at the end of branches
(Fig. 1). We add monitors at the end of the branches.
For easy referencing, we mark nodes at the end of
the branches/subbranches as branch 1-5 (Fig. 1). The
length of the branch is the number of PQ nodes from
RefBus to the last node in the branch. For example,
COMPLEXIS 2021 - 6th International Conference on Complexity, Future Information Systems and Risk
66

the length of branch four is 9, and the length of branch
five is 11.
We showcase two different patterns of failures,
that we called random and deterministic, based on
the way PV units are subject to failures. We follow
a similar definition of these two patterns as defined in
the context of SG Intrusion Detection Systems (IDS)
(Chromik et al., 2017). A random strategy shuts down
nodes all over the grid. Such strategy could be more
similar to random occurrences of failures. The deter-
ministic strategy chooses PV units based on the loca-
tion of previously failing units, mimicking more cas-
cading failures or intentional cyberattacks. The goal
is to compare the impact of both strategies on the sta-
bility of the grid. We also discuss how failures in one
branch affect the stability of other branches.
4.3 Voltage Drops and Undervoltage
According to the European standard EN 50160 (Start,
1995), a voltage drop is a sudden lowering of the ef-
fective voltage value to a value of between 90% and
1% of the stipulated nominal value, followed by the
“immediate” recovering of this voltage. The most
common causes of voltage drop are starting currents
(for example, inrush current for a capacitor) and short
circuits. Undervoltage, unlike voltage drop, has a
longer-lasting character and is also defined as lower-
ing of the effective voltage value to a value between
90% and 1% of the stipulated nominal value. Un-
dervoltage occurs when facilities ask for more power
than the power grid can deliver. It can be caused either
when facilities suddenly increase their power con-
sumption or when power generators decrease the sup-
ply of power to the grid. Both voltage drop and under-
voltage can lead to huge problems, such as the drop-
out of production processes, product quality prob-
lems. IT systems are also susceptible to voltage drops,
which can cause damages.
4.4 Simulation
In our scenario, we primarily focus on undervoltage,
since it is caused by the insufficient power supply to
the grid, and we simulate failures of power generators.
The showcase has three phases. We make 100 runs
of the simulation in each phase and then process the
results. PV units are randomly connected to the grid
for each of the runs, although the distribution of PV
units over the runs is the same for each phase.
In the first phase, we measure the average volt-
age magnitude (V m) for each branch in the stable grid
(Fig. 1). First we run simulations with a random dis-
tribution of PV units. In the end, we calculate the av-
erage from all runs. The voltage magnitude is around
230V . It is higher at noon, because of the increased
power production of PV units.
In the next two phases, we compare the impact of
the two strategies (random, deterministic). We mea-
sure the negative impact as a difference between av-
erage voltage per each hour measured at monitored
nodes (red nodes in Fig. 1) in the stable grid and av-
erage voltage measured at the same nodes in the grid
where PV units fail. Figure 2 shows the summarized
results from all runs in the form of boxplots for each
measured branch and both strategies. The boxplots
marked as random or deterministic in Fig. 2 show a
deviation of V m from the average V m of the stable
grid (as in calculated in phase one) for each branch
from 1:00 PM to 2:00 PM.
In the second phase, we simulate a failure of PV
units and how it affects voltage in the grid. We chose
the bad-case scenario when the PV units fail at the
same time. This phase employs a random strategy
for picking PV units to shut down. Five randomly
picked PV units are shut down in each run for one
hour at 1:00 PM, time when PV units are the most
active. We observe a slight drop in voltage in most of
the branches. This slight drop is not alarming since
the worst result is voltage drop by 9V in branch 5,
and the undervoltage is defined as 10% lower voltage
(around 23V in our case).
In the third phase, we use a deterministic strategy
for picking PV units in the grid. We again chose the
bad-case scenario when the PV units are shut down at
1:00 PM for one hour. However, now we shut down
five PV units connected to branch 5 if there are at
least five PV units connected to it. If there are not
five PV units connected to branch 5, we shut down all
that are connected. It can simulate real-world scenar-
ios where, for example, a storm affects devices in the
same area, or attackers performing a more sophisti-
cated attack.
4.5 Outcome of the Simulation
We can see a drop in voltage, in comparison to the
voltage in the stable grid, in almost all branches in
the case of PV unit failures using both strategies. The
only exception is branch 2 that shows slight increase
of voltage in most of the simulation runs.
When we take a closer look at the random pattern,
we can see that the grid is capable of compensating for
the sudden failures of PV units without a significant
drop of voltage in none of its branches. The highest
drop occurs in Branch 5, but the distribution of the
deviation of V m still lies far from the undervolage ac-
cording to the definition in section 4.3. Since the av-
Co-simulation of Smart Grids: Dynamically Changing Topologies in Failure Scenarios
67
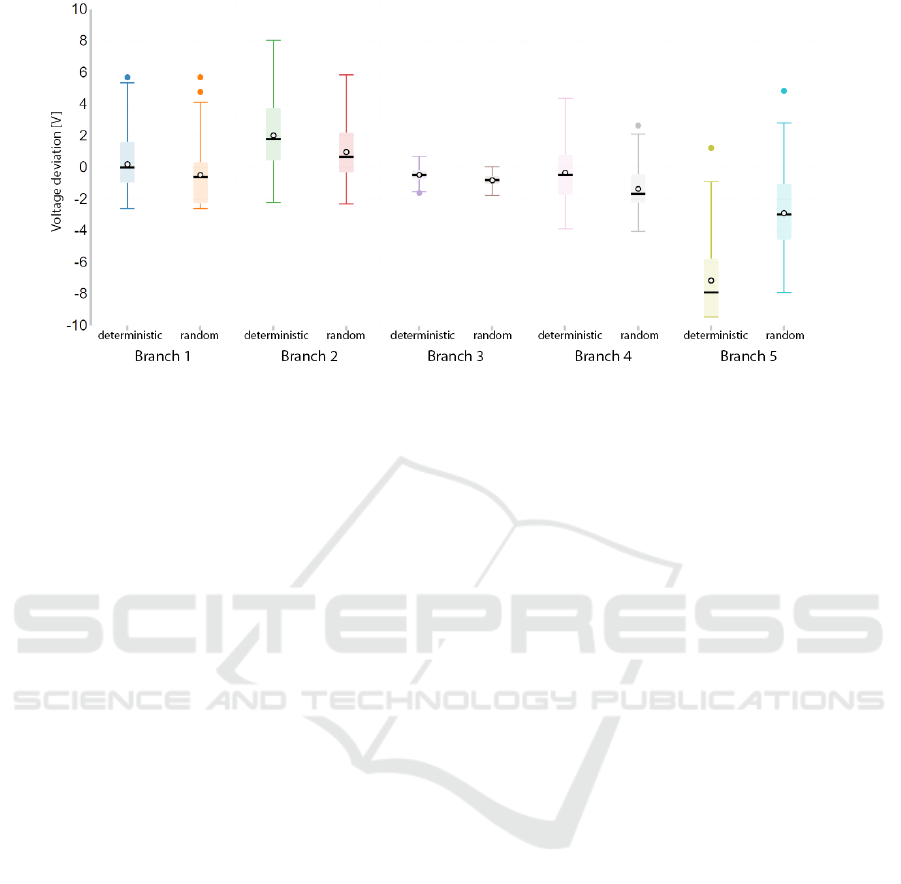
Figure 2: Voltage drop during PV unit failures (13:00 PM).
erage voltage in the grid is around 230V, the voltage
lowering would have to be at least 23V to be catego-
rized as the undervoltage.
The deterministic pattern, which shuts down PV
units only from Branch 5, leads to more interesting
results. We can see that the strategy affects Branch 5
more significantly than the random pattern, while it
does not cause drops in voltage in other branches. All
three quartiles of Branch 5 boxplot lie in the low val-
ues. Such a drop in voltage can cause problems to
specific devices connected to the grid even though it is
still not undervoltage according to the definition (sec-
tion 4.3). To note that this lowering of voltage has a
long-lasting character (one hour in our case).
Overall, the random strategy affects the voltage
stability of the grid slightly while deterministic strat-
egy cause more significant destabilization in the part
of the grid — meaning that failures in a single branch
remain local. On the other hand, the grid could,
for example, reroute power from branches where the
voltage is high enough (Branch 2 in our scenario) to
compensate for the deficiency in the power supply in
Branch 5.
5 CONCLUSION
In this paper, we used the open source co-simulation
framework Mosaik, adapting it to allow run-time
changes of topology and availability to simulate dif-
ferent smart grid failure scenarios. We provided the
implementations details and then set-up an experi-
ment to test the newly implemented functionality of
dynamic topology changes at runtime. We examined
two different patterns, random and deterministic, to
simulate possible failure cases that can occur in the
grid due to device issues or cyberattacks and evalu-
ated the stability of the grid. These scenarios were
used to showcase how co-simulations can be used to
study also more complex scenarios of cascading fail-
ures in the grid, taking into account and modelling
nodes disconnections at runtime.
ACKNOWLEDGMENT
The research was supported from ERDF/ESF "Cy-
berSecurity, CyberCrime and Critical Informa-
tion Infrastructures Center of Excellence" (No.
CZ.02.1.01/0.0/0.0/16_019/0000822).
REFERENCES
Alur, R. (2015). Principles of cyber-physical systems. MIT
Press.
Cai, Y., Cao, Y., Li, Y., Huang, T., and Zhou, B. (2016).
Cascading failure analysis considering interaction be-
tween power grids and communication networks.
IEEE Transactions on Smart Grid, 7(1):530–538.
Chassin, D. and Posse, C. (2005). Evaluating north amer-
ican electric grid reliability using the barabasi-albert
network model. Physica A: Statistical Mechanics and
its Applications, 355:667–677.
Chren, S., Rossi, B., and Pitner, T. (2016). Smart grids
deployments within eu projects: The role of smart
meters. In Smart Cities Symposium Prague (SCSP),
2016, pages 1–5. IEEE.
Chromik, J. J., Pilch, C., Brackmann, P., Duhme, C., Ever-
inghoff, F., Giberlein, A., Teodorowicz, T., Wieland,
J., Haverkort, B. R., and Remke, A. (2017). Context-
COMPLEXIS 2021 - 6th International Conference on Complexity, Future Information Systems and Risk
68

aware local intrusion detection in scada systems: A
testbed and two showcases. In 2017 IEEE Int. Con-
ference on Smart Grid Communications (SmartGrid-
Comm), pages 467–472.
Fang, X., Misra, S., Xue, G., and Yang, D. (2011).
Smart grid—the new and improved power grid: A
survey. IEEE communications surveys & tutorials,
14(4):944–980.
Farhangi, H. (2010). The path of the smart grid. IEEE
power and energy magazine, 8(1).
Goel, S., Hong, Y., Papakonstantinou, V., and Kloza, D.
(2015). Smart grid security. Springer.
Gryga, L. (2020). Mosaik framework for co-simulations
of smart grids reliability. Bachelor thesis, Masaryk
University, Brno.
Guo, H., Zheng, C., Iu, H. H.-C., and Fernando, T. (2017).
A critical review of cascading failure analysis and
modeling of power system. Renewable and Sustain-
able Energy Reviews, 80:9 – 22.
Hebner, R. (2017). Nanogrids, microgrids, and big data:
The future of the power grid. IEEE Spectrum Maga-
zine, page 23.
Lamba, V., Šimková, N., and Rossi, B. (2019). Recom-
mendations for smart grid security risk management.
Cyber-Physical Systems, 5(2):92–118.
Lei, H., Chen, B., Butler-Purry, K. L., and Singh, C. (2018).
Security and reliability perspectives in cyber-physical
smart grids. In 2018 IEEE Innovative Smart Grid
Technologies - Asia (ISGT Asia), pages 42–47.
Lip
ˇ
cák, P., Macak, M., and Rossi, B. (2019). Big data plat-
form for smart grids power consumption anomaly de-
tection. In 2019 Federated Conference on Computer
Science and Information Systems (FedCSIS), pages
771–780.
Lopez, J., Rubio, J. E., and Alcaraz, C. (2018). A resilient
architecture for the smart grid. IEEE Transactions on
Industrial Informatics.
O’Connor, Patrick, K. A. (2012). Practical Reliability En-
gineering. John Wiley & Sons.
Offis (2012). Mosaik quickstart. Available from https://
mosaik.readthedocs.io/en/latest/quickstart.html.
Offis (2019). mosaik-pypower. Available from https://
bitbucket.org/mosaik/mosaik-pypower/src/master/.
Rossi, B. and Chren, S. (2020). Smart grids data analysis:
A systematic mapping study. IEEE Transactions on
Industrial Informatics, 16(6):3619–3639.
Schütte, S., Scherfke, S., and Tröschel, M. (2011). Mo-
saik: A framework for modular simulation of active
components in smart grids. In 2011 IEEE First Inter-
national Workshop on Smart Grid Modeling and Sim-
ulation (SGMS), pages 55–60.
Schvarcbacher, M., Hrabovská, K., Rossi, B., and Pitner,
T. (2018). Smart grid testing management platform
(sgtmp). Applied Sciences, 8(11).
Siano, P. (2014). Demand response and smart grids—a
survey. Renewable and sustainable energy reviews,
30:461–478.
Start, D. (1995). A review of the new cenelec standard en
50160. IET Conference Proceedings, pages 4–4(1).
Strasser, T., Stifter, M., Andrén, F., and Palensky, P. (2014).
Co-simulation training platform for smart grids. IEEE
Transactions on Power Systems, 29(4):1989–1997.
Vogt, M., Marten, F., and Braun, M. (2018). A survey and
statistical analysis of smart grid co-simulations. Ap-
plied Energy, 222:67–78.
Xiao, H. and Yeh, E. M. (2011). Cascading link failure
in the power grid: A percolation-based analysis. In
2011 IEEE International Conference on Communica-
tions Workshops (ICC), pages 1–6.
Zhang, P., Wang, Y., Xiao, W., and Li, W. (2012). Relia-
bility evaluation of grid-connected photovoltaic power
systems. IEEE Transactions on Sustainable Energy,
3(3):379–389.
Co-simulation of Smart Grids: Dynamically Changing Topologies in Failure Scenarios
69
