
A Platform for Interactive Data Science with Apache Spark for
On-premises Infrastructure
Rafal Lokuciejewski
1
, Dominik Sch
¨
ussele
1
, Florian Wilhelm
1
and Sven Groppe
2
1
inovex GmbH, Germany
2
Institute of Information Systems (IFIS), University of L
¨
ubeck, Germany
Keywords:
Jupyter, Spark, Kubernetes, YARN, Cluster, UEQ, Notebooks.
Abstract:
Various cloud providers offer integrated platforms for interactive development in notebooks for processing and
analysis of Big Data on large compute clusters. Such platforms enable users to easily leverage frameworks
like Apache Spark as well as to manage cluster resources. However, Data Scientists and Engineers are facing
the lack of a similar holistic solution when working with on-premises infrastructure. Especially a central point
of administration to access a notebooks’ UI, manage notebook kernels, allocate resources for frameworks like
Apache Spark or monitor cluster workloads, in general, is currently missing for on-premises infrastructure. To
overcome these issues and provide on-premises users with a platform for interactive development, we propose
a cross-cluster architecture resulting from an extensive requirements engineering process. Based on open-
source components, the designed platform provides an intuitive Web-UI that enables users to easily access
notebooks, manage custom kernel-environments as well as monitor cluster resources and current workloads.
Besides an admin panel for user restrictions, the platform provides isolation of user workloads and scalability
by design. The designed platform is evaluated against prior solutions for on-premises as well as from a user
perspective by utilizing the User Experience Questionnaire, an independent benchmark tool for interactive
products.
1 INTRODUCTION
In the age of digitalization, most data-driven com-
panies already employ several teams of data scien-
tists and engineers to help them generate value from
their data. Those teams need extensive compute re-
sources for exploring and processing large amounts
of data. The de-facto standard framework for Big
Data analytics is the open-source distributed general-
purpose cluster-computing framework Spark (Zaharia
et al., 2016), maintained by the Apache Software
Foundation
1
, which is often used in conjunction with
Jupyter (-Lab) notebooks for interactive development
and data exploration. In combination, this toolset en-
ables data scientists and engineers to work more effi-
ciently resulting in shorter development cycles. This
in turn, allows them to gain insights into company
data much faster, getting them ahead of their competi-
tors. As convenient interactive development in note-
books might be at first glance, the more difficult it is
to manage a solid setup when working with Big Data
and a cluster providing distributed resources shared
1
http://spark.apache.org/
among teams in a company. Every member of a team
is responsible for his/her own setup regarding note-
book deployment, desired framework or packages,
and a suitable configuration of all components for an
existing cluster. Despite the fact that this actually dis-
tracts a data scientist or engineer from his/her main
task, it also results in an inconsistent landscape of nu-
merous solutions across a company. These are diffi-
cult to maintain and individual setups might even in-
terfere with each other as there is no central control
managing multiple users sharing compute resources.
To address the above issues, cloud providers
like Google, Amazon or Microsoft and companies
like Databricks offer their own solutions. Whether
Google Dataproc
2
, Amazon EMR
3
, Microsoft HDIn-
sight
4
or Databricks Unified Data Analytics Platform
5
(UDAP), for all of these Big Data cloud services it is
possible to enable a single, web-based and holistic en-
try point for interactive development or analytics on
2
https://cloud.google.com/dataproc/
3
https://aws.amazon.com/emr
4
https://azure.microsoft.com/services/hdinsight
5
https://databricks.com
Lokuciejewski, R., Schüssele, D., Wilhelm, F. and Groppe, S.
A Platform for Interactive Data Science with Apache Spark for On-premises Infrastructure.
DOI: 10.5220/0010447500650076
In Proceedings of the 11th International Conference on Cloud Computing and Services Science (CLOSER 2021), pages 65-76
ISBN: 978-989-758-510-4
Copyright
c
2021 by SCITEPRESS – Science and Technology Publications, Lda. All rights reserved
65
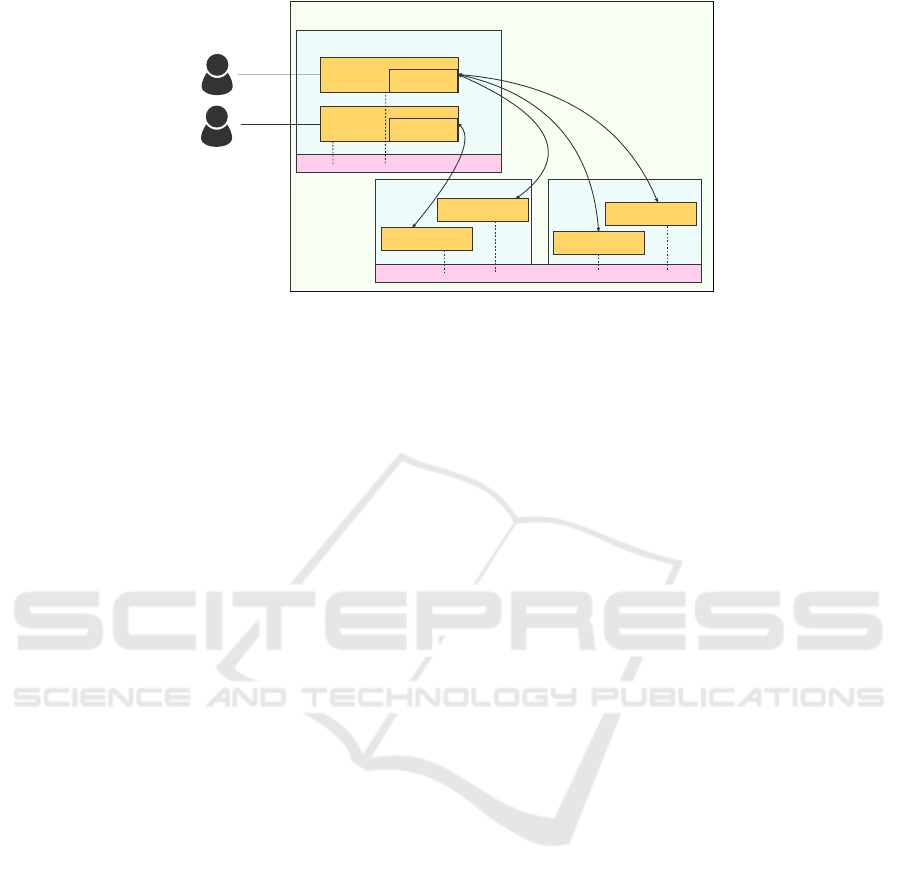
YARN Cluster
YARN edge node
Kernel A
Kernel B
Notebook A
Notebook B
node 1
node 2
Spark Worker B
Spark Worker A
Spark Worker A
Spark Worker A
HDFS
HDFS
A
B
(Spark Driver)
(Spark Driver)
Figure 1: A common setting used on on-premises infrastructure to work interactively with Spark.
large compute clusters. Those services support even
multiple users or teams within a company providing
scalability, cluster-management & transparency, iso-
lation of user workloads as well as capabilities to ac-
cess notebooks and manage whole development envi-
ronments.
Although recent years showed an increasing
amount of companies shifting to cloud, leveraging
managed services (Contu and Pang, 2019), there are
still many companies that are not able to move to
infrastructure/platform/software-as-a-service models
of cloud providers. Those companies rely on their ex-
isting on-premises hardware inside their own Private
Cloud due to various reasons like resource limitation,
security, vendor lock-in, cost/ROI, General Data Pro-
tection Regulation (GDPR) or prone to failure (Hos-
seini Shirvani et al., 2018). Furthermore, companies
may be reluctant to abandon their existing hardware.
But how can these companies be supported in
terms of a unified, user-friendly and administrable
service that enables their teams to efficiently work
interactively with Big Data on distributed resources?
Are there already services available that focus on on-
premises hardware or is this still a niche, not signifi-
cant enough to be filled by cloud providers? With this
paper, we provide answers to these questions.
Our main contributions are:
• an intense requirements engineering process
showing that indeed on-premises infrastructure is
lacking in terms of a holistic platform for interac-
tive data science on distributed resources. Based
on gathered data, we specified a set of require-
ments such a platform needs to fulfill.
• a design and implementation of such a platform.
The platform provides good isolation of working
users, high scalability in terms of running note-
books and a centralized management interface in
form of a Web-UI. The main advantage over exist-
ing solutions is the integration of remote kernels.
• a comprehensive evaluation of the platform.
Firstly, we show, that the specified requirements
are fully satisfied. Then, with an intensive user-
evaluation we prove, that the functionalities are
indeed well implemented and user-friendly, in-
cluding an independent benchmark, that yields
a high score for our platform. Finally, we
compare our platform to a state-of-the-art solu-
tion for on-premises infrastructure, showing that
the proposed solution outperforms the previous
one in terms of isolation, scalability and user-
friendliness.
2 FOUNDATIONS
One of the most advanced platforms for interactive
data analysis on compute clusters is the Databricks
UDAP. Deployable on either Amazons AWS or Mi-
crosoft Azure cloud service, Databricks aims to be
one cloud platform for massive-scale data engineer-
ing and collaborative data science. Besides sev-
eral third-party integrations, Databricks itself com-
prises of an Enterprise Cloud Service enabling for
simple, scalable and secure resource management, a
Unified Data Service providing Apache Spark out-
of-the-box and a Data Science Workspace supplying
users with collaborative notebooks for language ag-
nostic data analysis. These components are all inte-
grated into a user-friendly Web-UI that enables easy
access to functionalities like and not limited to clus-
ter creation and termination, environment manage-
ment through installing custom packages, notebook
creation and collaboration as well as ML-Model man-
agement. Users and their workloads are isolated as
they are able to create their own individually sized
and configured clusters. As the creator of Spark,
Databricks delivers its own resource manager and an
integrated Spark distribution, providing developers
CLOSER 2021 - 11th International Conference on Cloud Computing and Services Science
66
with an advanced toolset for data analysis in just a few
mouse clicks
6
. Besides Databricks, Google Datalab,
Amazon EMR, or Microsoft HD Insight are similar
services but different in terms that they do not pro-
vide cluster-management capabilities but rather allow
to simply attach notebooks to regular Hadoop/YARN
clusters that are already provisioned. Of course, all of
them are relevant and complement the most common
managed services for interactive development with
Big Data, i.e. Spark with Jupyter notebooks, in the
cloud on cluster resources.
Databricks and other cloud vendors use several
separate, often open-source, tools that are orches-
trated and optimized to provide a seamless user ex-
perience when combined in a service. However,
there is not much information about the underly-
ing technologies and frameworks of commercial so-
lutions like Databricks. A well known and open-
source framework for distributed processing of Big
data across clusters of computers using simple pro-
gramming models is the Apache Hadoop framework
with YARN as a resource manager (Vavilapalli et al.,
2013). Before the era of cloud, companies built their
own data-centers entirely on-premises with clusters
utilizing Hadoop’s YARN, Hadoop’s HDFS as under-
lying distributed-file-system as well as MapReduce
(Dean and Ghemawat, 2010) and later Spark as pro-
cessing engine. This setup is still a de-facto industry
standard even offered by cloud vendors, e.g. Google
Dataproc.
On these on-premises clusters, interactive analy-
sis of Big Data leveraging cluster resources is done
within open-source notebooks as provided by Project
Jupyter
7
. Considered in isolation, each of these men-
tioned components seems to be rather easily man-
ageable but utilizing them in combination, especially
Apache Spark and Jupyter Notebooks on a compute
cluster, brings several pitfalls. Figure 1 provides
an overview of a common setup where multiple de-
velopers work interactively in their notebooks on a
Hadoop/YARN cluster, analyzing data with Spark.
This setup was described by many experts that were
involved in the requirements engineering process de-
scribed in further sections. In order to be able to
access data stored in HDFS but also to utilize com-
pute resources of the cluster, developers have to start
the notebook on a cluster edge-node, which usu-
ally serves as an interface for users to communicate
with the actual cluster-nodes and run their client-
applications.
Due to the architectural concept of common
6
https://databricks.com/product/unified-data-analytics-
platform
7
https://jupyter.org/
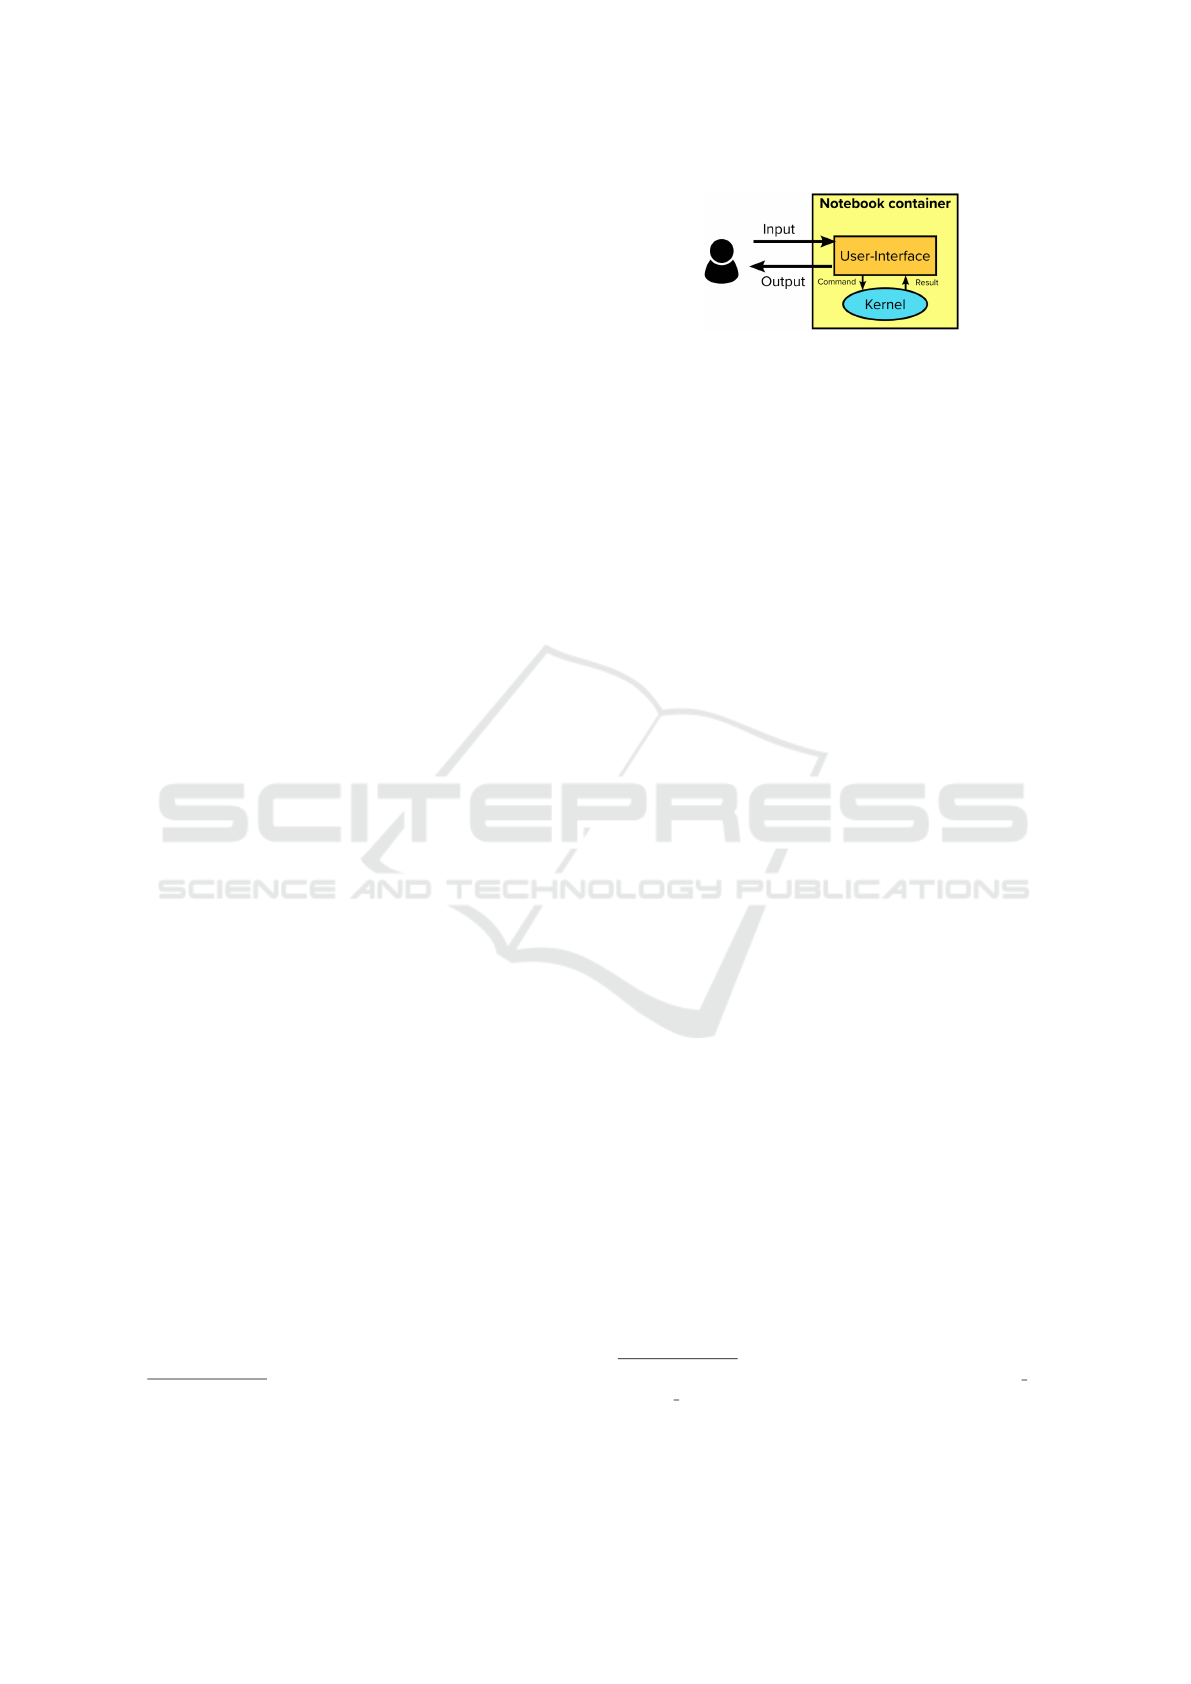
Figure 2: Traditional Jupyter notebook container. The ker-
nel exists within the notebook.
notebook-servers like Jupyter (-Lab) notebooks,
heavy computations of Big Data with Spark are per-
formed inside the notebooks kernel (process responsi-
ble for running user code
8
) which, as shown in Figure
2, is tied to the notebook process running on the edge-
node of the cluster. As the Spark architecture follows
the driver-executor paradigm where transformations
are usually performed on the executor by actions,
it might be tempting for a developer working inter-
actively to quickly peek into (intermediate) process-
ing results. This usually requires all data distributed
across the cluster to be collected from the cluster-
nodes to the edge-node where the notebook process is
running. Depending on cluster resources and amount
of data such operations will utilize all resources of
the edge-node possibly causing a node-failure. When
considering that multiple users are working on the
same cluster resources, running their notebooks on
the same edge-node, data scientists and engineers can
easily interfere with and limit each other’s workloads
as there is no central instance of control on regu-
lar on-premises infrastructure. Besides this obvious
drawback, the simple composition of the open-source
components illustrated in Figure 1 requires each de-
veloper to handle its own setup for notebook deploy-
ment including provisioning of custom environments
with desired packages/libraries resulting in a variety
of individual solutions without restrictions for users,
no isolation of user workloads and poor scalability in
a multi-user setup.
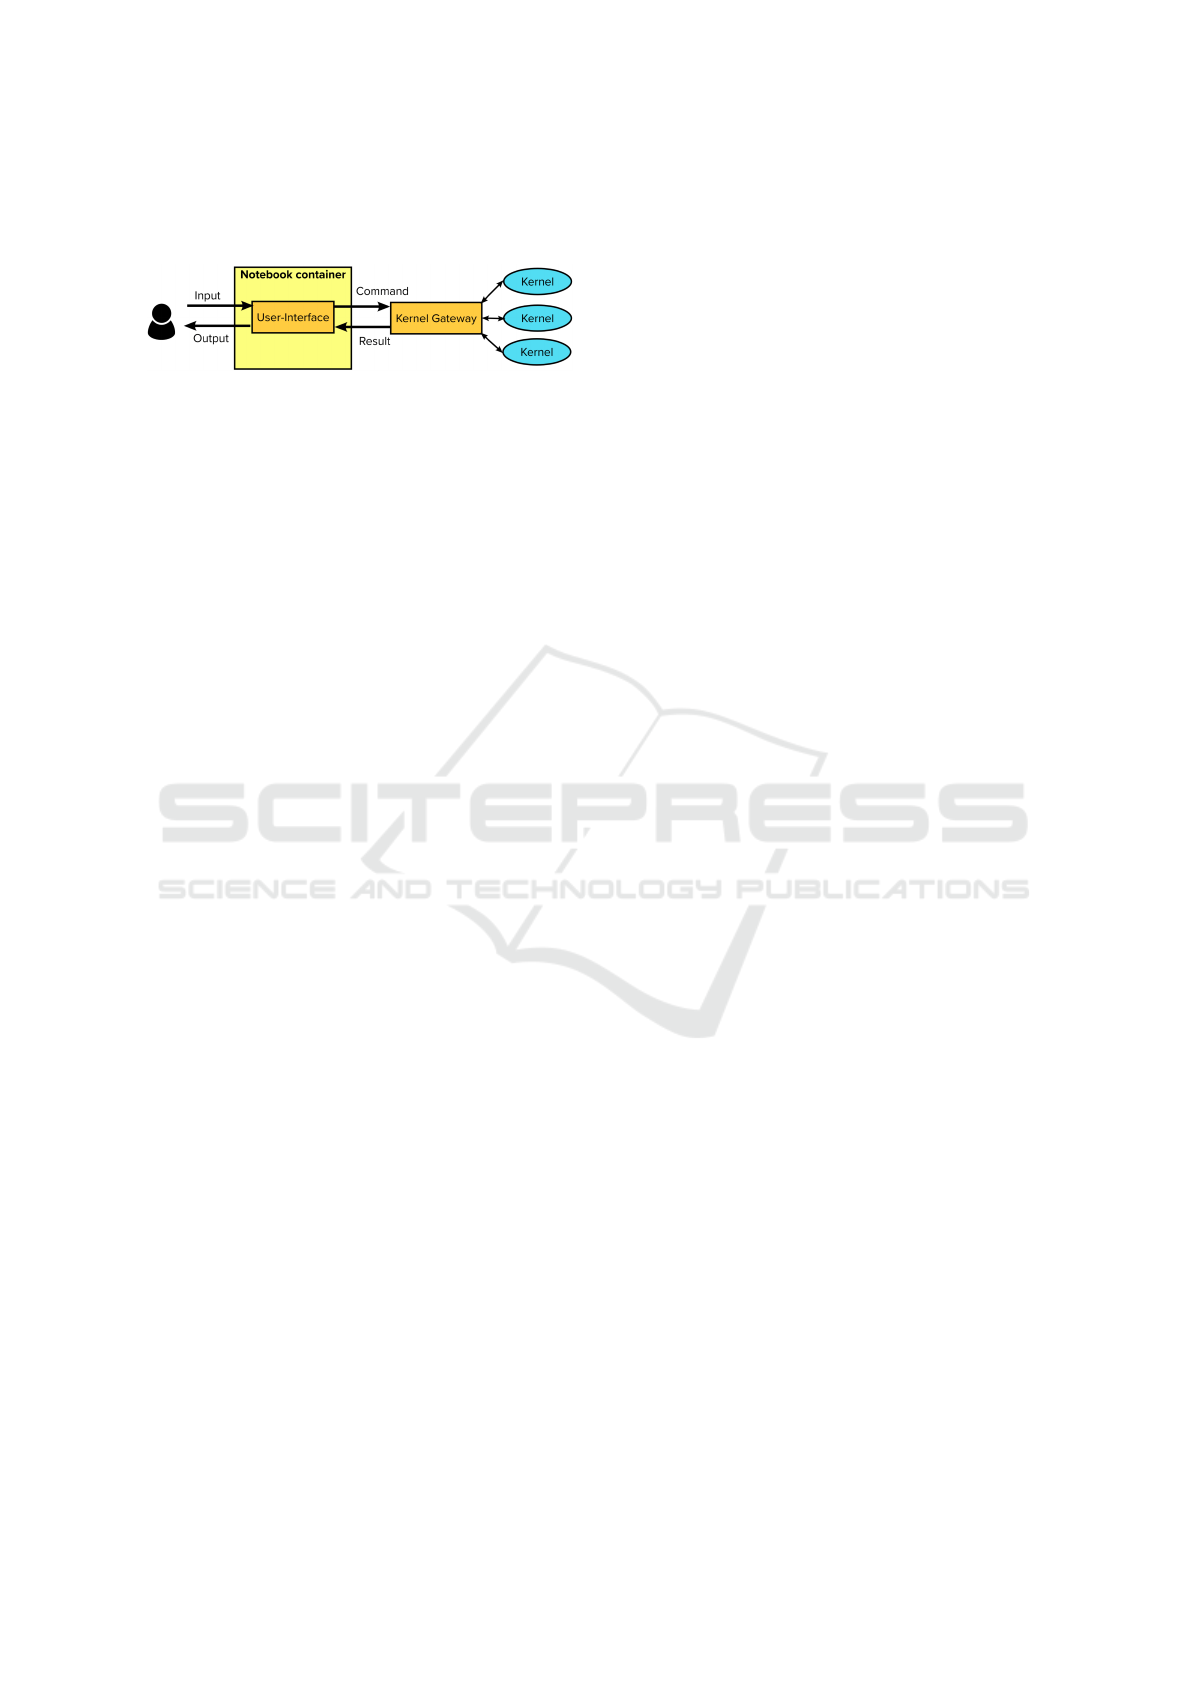
In recent years, tools have emerged, that allow to
separate the kernel from the actual notebook, which,
if properly used, allows to avoid some of the problems
named above. The open-source tool Jupyter Enter-
prise Gateway
9
enables utilization of remote kernels
as depicted in Figure 3. This brings several advan-
tages in terms of working with Spark, which will be
discussed in further sections of this paper. However,
to integrate all the components, i.e. notebooks, a ker-
nel gateway as well as Spark in a user-friendly and
unified way, is quite a challenge, and as researched,
8
https://ipython.org/ipython-doc/3/development/how
ipython works.html
9
https://jupyter-enterprise-gateway.readthedocs.io/en/
latest/
A Platform for Interactive Data Science with Apache Spark for On-premises Infrastructure
67
no generally available solution offering these tools
combined is available for on-premises infrastructure.
Figure 3: The notebook UI and kernels are separated. The
kernel gateway handles the communication between dis-
tributed kernels and the notebook.
2.1 Further Related Work
In order to overcome these issues and also profit from
a unified service as offered e.g. by Databricks, the
Service for Web based data Analysis (SWAN) (Boc-
chi et al., 2019) is a service for interactive data anal-
ysis based on open-source components like Jupyter
notebooks developed by the research center CERN.
SWAN is only available for CERN employees and
can therefore be seen as a service for interactive data
analysis using on-premises infrastructure within the
CERN organisation network. Users are provided with
a Web-UI to quickly access notebooks for data anal-
ysis and are able to share their work with collabo-
rators easily. Although a very interesting approach,
useful functionalities are still missing. For example,
as stated in (Piparo et al., 2018), choosing resources
for a notebook before spawning it, has not been im-
plemented yet.
Another example showing the urgency of holistic
solutions can be found in (McPadden et al., 2019).
The approach, however, does not focus on provid-
ing a generally usable solution, with features like in-
teractive environments, but rather on offering vari-
ous data-acquisition workflows with Apache Storm.
In contrast, the solution presented in (Chrimes et al.,
2016) focuses on interactive notebooks (Zeppelin and
Jupyter) and distributed computing, however, a cen-
tralized management component, allowing to create
new environments or view the cluster state is missing.
Although fairly advanced in various aspects, none
of the existent solutions introduces remote kernels
with an appropriate management system for on-
premises platforms.
3 REQUIREMENTS FOR AN
ON-PREMISES PLATFORM
Before designing and implementing a solution for on-
premises infrastructure, we started with the require-
ments engineering process, focusing on discovering
requirements that a platform for interactive develop-
ment on Big Data should fulfill. The outcome of re-
quirements engineering is a set of requirements, that
can be used as a basis for development and further
verification of the designed system (Ramachandran
and Mahmood, 2017). Furthermore, requirements
engineering is utilized to provide an answer to the
question, whether on-premises infrastructure is in-
deed lacking in terms of such platforms.
Requirements Engineering is a whole process and
provides various methods to collect relevant informa-
tion from experts (Zhang, 2007). To identify require-
ments that data scientists and engineers demand from
a platform for interactive data analysis on compute
clusters, we conducted a questionnaire as well as in-
terviews with experts regarding compute clusters. In
total, 19 participants were involved, who are highly
skilled in terms of data science or data engineering on
distributed resources, on average 3.84 out of 5 (self-
rating). Experts for cluster administration were in-
cluded as well. Furthermore, participants spend on
average 68% of their working week dealing with com-
pute clusters and they come from various industry
fields, representing medium to large-sized companies.
Despite the actual features of an interactive data
analysis platform, the questionnaire and interviews
also focused on infrastructure, frameworks or soft-
ware for data analysis in use as well as individual
preferences and dislikes in terms of interactive devel-
opment. The presented results in the following sec-
tions are constituting only the most important findings
of the requirements engineering process.
The next section deals with the intermediate re-
sults of the requirements engineering process.
3.1 Results
The first fundamental finding of the requirements en-
gineering process is the fact, that on-premises infras-
tructure is widely represented. As found out, on-
premises infrastructure is more popular among par-
ticipants than cloud (58%). Especially big companies
tend to have their own compute clusters.
All on-premises clusters have one thing in com-
mon: They rely on the Hadoop ecosystem with YARN
as a resource manager. In contrast, participants
working with cloud infrastructure, above all, use the
Databricks platform, which offers an own implemen-
tation of interactive notebooks.
Regarding solutions used to work interactively on
previously stated infrastructure, three possibilities are
taken into account. Firstly, solutions included in com-
mercial platforms or services, e.g. Databricks. This
group accounts for 42% of all participants. Secondly,
CLOSER 2021 - 11th International Conference on Cloud Computing and Services Science
68

custom solutions, e.g. self-deployed Jupyter or Zep-
pelin notebooks, which are used by 32%. Finally, it
is possible that a participant does not work with any
interactive environment, which was stated by 26% of
all participants. Thus, in total, 74% of all participants
work with an interactive environment. The 42% refer-
ring to a commercial solution belong entirely to cloud
users, thus every participant relying on cloud infras-
tructure uses an interactive environment. On the other
hand, only 55% of on-premises users work with an
interactive component.
The fact that 45% of on-premises users don’t work
with any interactive environment demonstrates the
need for improvement, especially after a deeper anal-
ysis of answers provided by this group of users. 60%
of them consider features regarding interactive note-
books (which will be discussed further) important,
which suggests, they are interested in working inter-
actively.
Next, the actual setup used to work interactively
is evaluated. This step provides the second major
finding: a huge discrepancy in terms of quality be-
tween solutions utilized on on-premises and cloud in-
frastructure. Thus, the assumption that on-premises is
lacking in terms of a holistic platform for interactive
data science is confirmed.
The platform of choice for cloud are notebooks
included in the Databricks UDAP. It is used by 88% of
the participants working in the cloud. The remaining
12% belong to Microsoft HDInsight. However, not
much information has been provided for Microsoft’s
platform, besides the average satisfaction score of 3
out of 5.
3.1.1 Cloud: Databricks
Databricks UDAP, as stated by the participants, of-
fers good revision history and tight integration with
Microsoft Azure or Amazon AWS services, e.g. stor-
age. Furthermore, Spark is well integrated into the
platform.
The biggest named disadvantage of Databricks is
the missing flexibility as it can only be used together
with the cloud offered by Microsoft or Amazon. It
also delivers limited customization possibilities, as
the platform is not open-source, allowing no mean-
ingful modification possibilities.
In spite of the above negative aspects, Databricks
is a powerful tool offering various different features.
With on average 3.85 points on a scale from 1 to 5,
participants awarded Databricks UDAP with a rather
high rating. The highest given score was 4. In addi-
tion, this score confirms that for cloud there are in-
deed reliable products available, that allow working
with distributed data interactively. For on-premises,
however, the situation is entirely different, as shown
below.
3.1.2 On-premises: Custom Solutions
Participants using on-premises infrastructure are
working with custom solutions. The word custom has
been used, since those solutions are not offered as
part of a holistic platform or service. They are con-
figured and deployed manually by the cluster owner.
50% of said solutions consist of a manual deployment
of Jupyter notebooks (or JupyterLab), the remaining
50% include Zeppelin notebooks.
Further, users were asked to describe their setting
in a few words and especially during interviews, this
aspect was discussed deeply. As a result the setting
depicted in Figure 1, is given.
In terms of negative aspects or missing function-
alities, plenty of issues were provided. 50% of users
working with a custom solution complain about poor
or no Spark integration within their interactive envi-
ronment. Furthermore, Zeppelin notebooks, as found
out during interviews, are very unstable and since the
Spark Driver runs within the notebook, one has to kill
the application manually if the notebook stops work-
ing. As a result, a lot of restarts of Spark applications
may be necessary.
Another common issue is poor user management,
criticized by around 50% of participants. Poor flexi-
bility in terms of resource allocation for a notebook is
also a major issue.
The lacking transparency of running applications
inside the cluster was mentioned as well. Only the
YARN UI is available, which, although very useful,
is not quite user-friendly and a bit too technical for
non experienced users. Another stated issue is poor
flexibility in terms of notebook customization.
Provided drawbacks are reflected in the average
satisfaction score which is 2.67 out of 5. The highest
given score was 3. Thus, the situation with interactive
data science and development is much worse for on-
premises infrastructure than with cloud solutions.
3.1.3 Framework for Distributed Data
The question: What frameworks for large amounts
of distributed data do you use in your current setup?
provided strong and important insight, namely, every
single participant uses mostly Apache Spark, despite
other frameworks like e.g. Dask or Apache Flink be-
ing available on the market. Furthermore, 90% of par-
ticipants who use an interactive environment, utilize it
together with Spark.
The survey also illustrated that working inter-
actively with a framework like Spark for ad-hoc
A Platform for Interactive Data Science with Apache Spark for On-premises Infrastructure
69

data analysis is of crucial importance to participants,
which is indeed another important finding.
3.1.4 Features
The last part of the questionnaire and interview dealt
with features or functionalities that a platform of this
kind should support. Participants were asked, how
important certain features are and whether they are
supported by participant’s current setup. Here again,
the differences between cloud and on-premises solu-
tions are tremendous. While important features are
mostly supported by cloud services or platforms, they
are missing for most of the on-premises solutions.
The most important features, that are also mostly
lacking for on-premises solutions (in descending or-
der in terms of importance):
1. Specifying own resources for an interactive envi-
ronment,
2. Transparent and easily accessible overview of al-
located and free cluster resources,
3. Transparent and easily accessible overview of
workloads running on the cluster,
4. Connecting to a Spark cluster from a local note-
book session,
5. A UI from where a user can start notebook ses-
sions.
Based on gathered results, we specified require-
ments a platform for interactive development with
distributed data should fulfill. This is discussed in the
following section.
3.2 Resulting Requirements
Providing a comprehensive software requirements
specification would be out of scope for this paper,
therefore only the most crucial ones are presented and
explained below.
(R1). The platform should support on-premises ar-
chitecture with YARN as resource manager.
(R2). Scalability. In order to support multiple users,
the components that scale with the number of
users need to be distributed through the whole
cluster and not only on a single node (e.g. edge-
node).
(R3). The platform should provide the possibility of
interactive development with distributed data.
(R4). The platform should offer a UI to start an inter-
active environment with a simple click.
(R5). The platform should offer a UI with a possibil-
ity to create new environments for notebooks with
parameters like programming language and extra
libraries.
(R6). The platform should offer a UI with a function-
ality to specify cluster-resources for said environ-
ments.
(R7). It should be possible for an administrator to set
limits on specifying own resources and, if wished,
to disable this feature and allow only default val-
ues.
(R8). The platform should offer a UI with a quick to
grasp cluster overview, showing its resources and
applications running on the cluster.
(R9). Each user should have his personal storage to
save notebooks or data for interactive analysis.
(R10). Isolation of users and their workloads. The in-
teractive environment of each user should be sep-
arated from other users in terms of resources and
personal storage, i.e. the users should not disturb
each other while working.
(R11). The native cluster storage should be accessi-
ble from a notebook.
(R12). It should be possible to work with Spark on
the cluster resources from a local notebook, e.g.
a notebook running on a laptop and not running
within the platform.
In the next section, we propose an architecture that
fulfills the stated requirements.
4 ARCHITECTURE
The resulting architecture is presented in Figure 4. To
the platform contribute custom made components like
the Web-UI or the API-server as well as individual
open-source components or frameworks presented in
Section 2.
The illustrated architecture consists of a Kuber-
netes and a Hadoop YARN cluster. As stated in
Requirements Engineering supporting Hadoop with
YARN is required. However, running notebooks as
managed resources leveraging underlying resource
manager is quite challenging on a Hadoop cluster.
Since notebooks are running as containers and
Kubernetes was designed for orchestrating container-
based workloads, distributing the notebooks across all
available nodes is possible without much effort. The
actual computing, however, happens on the YARN
side. Thus, in the proposed architecture, the note-
books are subject to Kubernetes while their kernels
CLOSER 2021 - 11th International Conference on Cloud Computing and Services Science
70
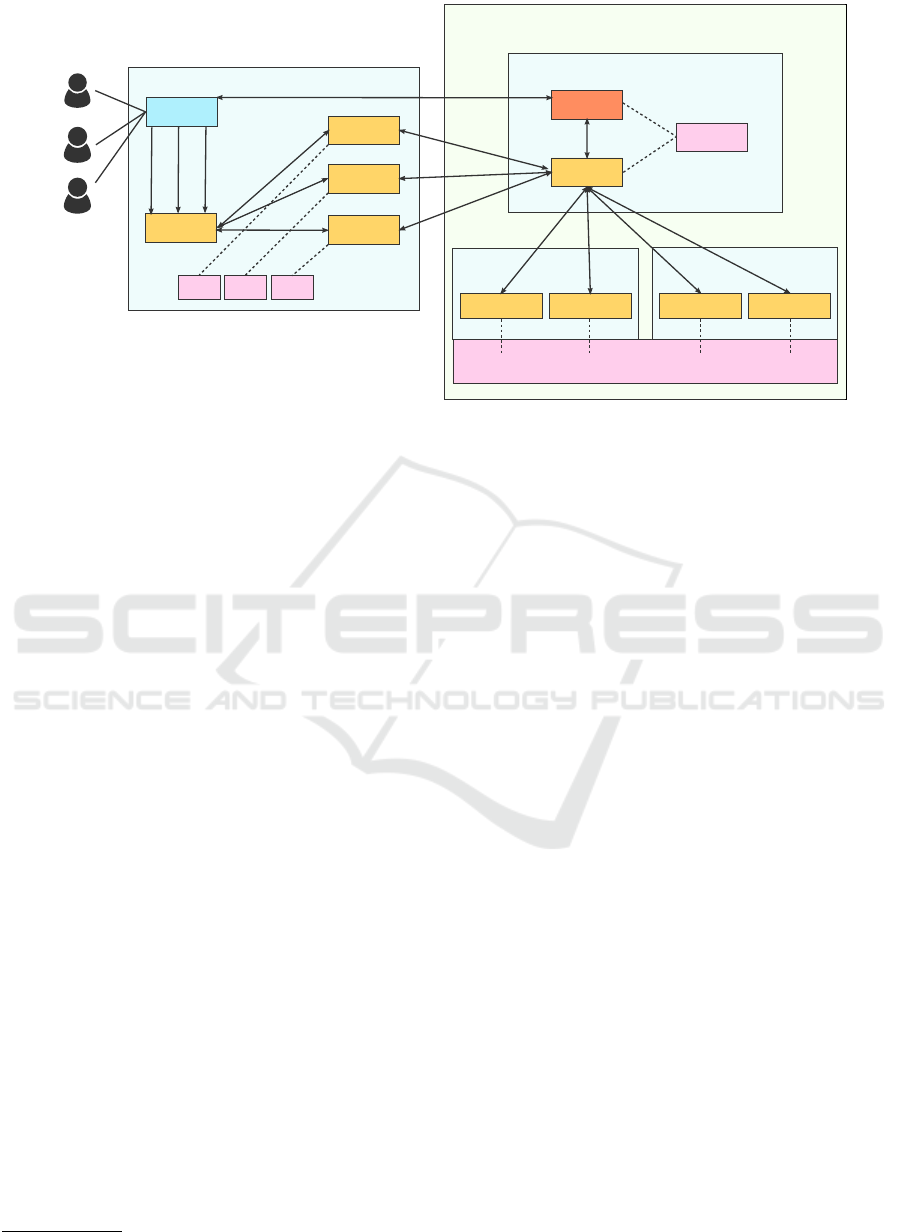
Kubernetes cluster
Hadoop & YARN
JupyterHub
Notebook A
Notebook C
Web-UI
A
B
A
C
A
C
C
B
Notebook B
B
PVC A
PVC B PVC C
Hadoop cluster with YARN
YARN edge node
API-Server
Kernels
HDFS
KERNEL A
KERNEL B
Kernel
Gateway
node 1
KERNEL A
KERNEL B
node 2
Figure 4: Architecture based on YARN and Kubernetes. Distributing notebooks in Kubernetes and using YARN to manage
the kernels.
run as manageable resources within the YARN clus-
ter. As a result, a separation of view (Kubernetes) and
compute logic (YARN) is given. The usage of Kuber-
netes results from the fact, that distributing notebooks
as manageable resources under YARN is complicated
and not possible out-of-the-box. Kubernetes, on the
other hand, allows seamless distribution of notebooks
assuring scalability even with large amounts of users
working simultaneously. Additionally, since the Ku-
bernetes cluster does not handle any heavy workloads,
it can be rather small and it is possible to utilize the
light-weighted version of Kubernetes
10
for it.
As shown in Figure 4, the Web-UI acts as an en-
try point of the whole platform from where a user,
redirected to the notebook hub, can start an interac-
tive session. The Web-UI offers several functionali-
ties, that are presented in Section 4.1 in more detail.
In order to have a multi-user management for
notebooks, JupyterHub was used. It spawns a Jupyter-
Lab instance on behalf of a user and manages its life
cycle. While creating a JupyterLab container for a
new user, a PVC (Persistent Volume Claim) is cre-
ated, which specifies access to persistent storage of
predefined size for each user within the Kubernetes
cluster. The usage of the PVC offers a good encapsu-
lation against other users.
From JupyterLab a user can select the desired ker-
nel to work with. As a result, a notebook file is opened
which utilizes selected kernel as an interpreter. Each
notebook created within the Kubernetes cluster is
connected to the kernel gateway which runs within
the Hadoop cluster. The kernel gateway is realized by
10
https://microk8s.io/
the open-source Jupyter Enterprise Gateway allowing
utilization of remote kernels that are running indepen-
dently and separated from the actual notebook con-
tainer within Kubernetes. Those kernels are started
on behalf of a notebook user and are distributed as
YARN-applications across the cluster-nodes. This en-
capsulation between view and computation results in
a robust and isolated setup where YARN takes over
the responsibility of managing the application and re-
sources allocated. Having the regular manual setup
depicted in Figure 1 in mind, it is now possible to
overcome the bottleneck of all notebook processes
running on the edge-node and distribute all kernels
throughout the available cluster-nodes, which in fact
is a huge advantage in a multi-user setup.
Each started kernel runs on one or many (dis-
tributed) worker nodes of the YARN cluster and has
access to HDFS. Thus, a user using a notebook run-
ning within the Kubernetes cluster can access a shared
HDFS storage, where e.g. large datasets might reside.
In order to start a kernel, the kernel gateway needs
to have access to the kernel specifications. Each spec-
ification represents a kernel to be executed together
with its environment, e.g. additional packages or li-
braries. Such an environment can be added by a user
from the Web-UI. The kernel specifications are stored
in a Kernels directory visible in Figure 4.
In order to enable communication between the
Web-UI (Kubernetes) and the Hadoop YARN cluster,
a custom API-server has been included in the plat-
form. It does the heavy lifting as it implements func-
tionalities triggered by the user through the Web-UI.
These functionalities are discussed in the next section.
A Platform for Interactive Data Science with Apache Spark for On-premises Infrastructure
71
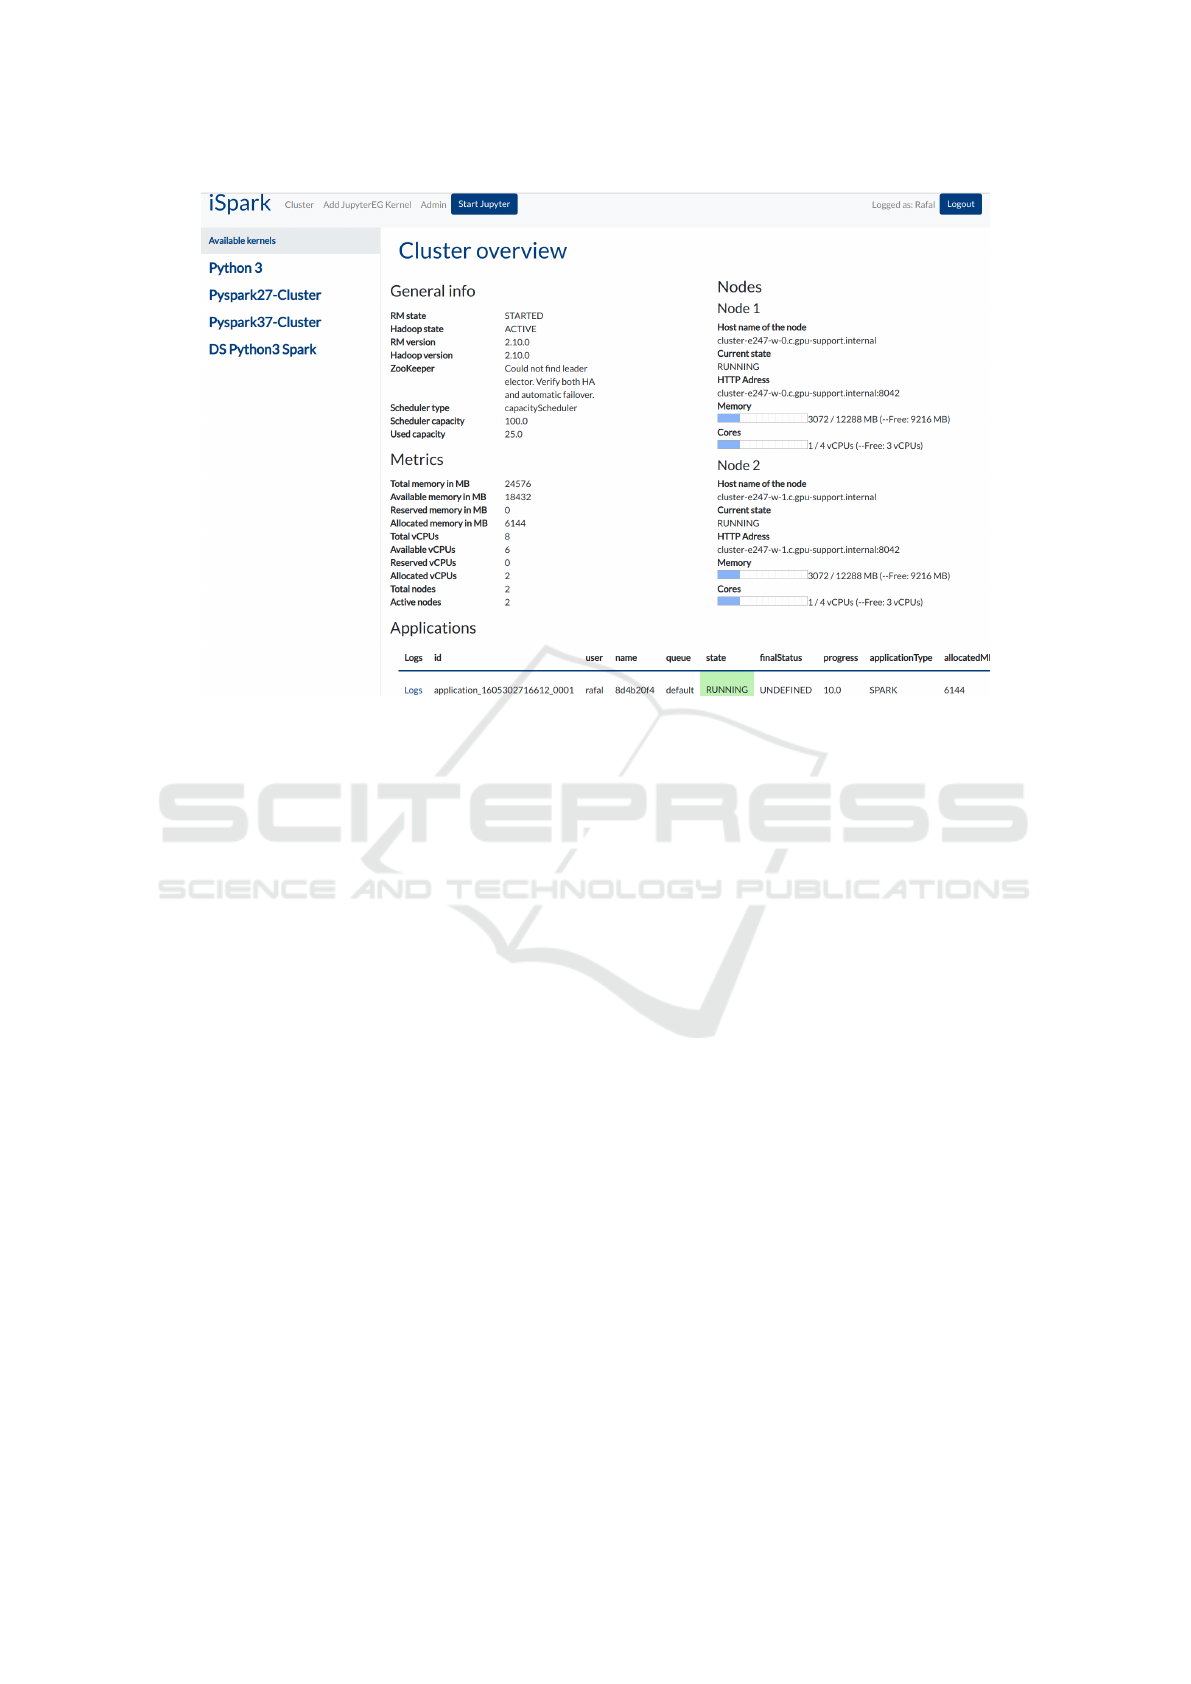
Figure 5: After logging in, the user is presented with this cluster overview page of the Web-UI.
4.1 User Interactions and
Functionalities
The main place of user interactions, besides the in-
teractive environment itself, is the Web-UI. As previ-
ously stated, it is the entry point of the whole plat-
form. After reaching the Web-UI in the browser, a
user has to provide his/her credentials in order to log
in. After logging in, the user is taken to the cluster
overview page, depicted in Figure 5. This page con-
sists of three major components: the navigation bar in
the top, a cluster overview in the center and a list of
all kernels, that are discovered by the kernel gateway.
The central element provides detailed information
about the current state of the Hadoop cluster. Var-
ious metrics about resources are provided. Further-
more, the right column display information about sin-
gle nodes. The resource utilization of said nodes is
given in form of a loading bar in order to increase the
user-friendliness. All of the information presented in
said element is delivered by YARN’s API.
The table below provides an overview of current
workloads running on the cluster whereas applica-
tions owned by a user are color-coded. It improves
the overall overview as a user directly sees how many
applications are running and how many are owned by
him/her. Furthermore, it is possible to kill a running
application or view the logs of it. Both functionali-
ties are provided by the custom made API-server, as
YARN’s API does not offer them.
Further, in the left component, available kernels
are listed. After clicking on such a kernel, detailed
information about resources or installed packages is
given. It is also possible to modify selected kernel in
terms of resources or delete it. In this case, the custom
made API-server is used as well.
From the navigation menu (displayed on the top),
a user can select the Add JupyterEG kernel view.
From there it is possible to add an own interactive
environment (kernel) by specifying the desired pro-
gramming language, additional packages (installed
by Conda and Pip package managers) and resources.
Since the environment is strictly connected with a
Spark kernel, the resource specification is typical to
the one of a Spark application. The information pro-
vided by a user is then sent to the custom API-server
which handles the creation of a corresponding ker-
nel specification. It is the heaviest functionality of
the API-server, as many steps are necessary to create
a functioning kernel. Besides creating files directly
related to the kernel, a whole (Conda) environment
has to be created and archived. The compressing is
required, since a kernel may run distributed on vari-
ous nodes and thus during the launch of a kernel, the
compressed environment is distributed to correspond-
ing nodes to guarantee an appropriate environment for
the execution of the kernel. The compressed zip file
is referenced in the main kernel specification file (as
a part of the Spark launch command).
CLOSER 2021 - 11th International Conference on Cloud Computing and Services Science
72

If the logged-in user is an administrator, from the
Admin view it is possible to set limits for users in
terms of resources. Specifying maximal and default
values is possible. Further, if desired, specifying own
resources while adding new kernels can be disabled
completely. In this case, default values are taken.
Last but not least, in order to start an interactive
environment from the Web-UI, a blue button Start
Jupyter has been placed in the navigation bar. The
button is available from all other views and after click-
ing on it, a user is taken to JupyterHub, from where it
is possible to start a JupyterLab session. If a Jupyter-
Lab container has been previously created and is still
running within Kubernetes, the user is directly taken
to his/her JupyterLab session.
5 EVALUATION
The proposed architecture was realized as a proof-
of-concept prototype and is available under the MIT
open-source license
11
. The technical requirements,
e.g. Spark in cluster-mode from within a notebook
or scalability were especially important. However,
the design of user-interfaces plays a big role as well,
since the platform should ease the life of a data sci-
entist and thus needs to be user-friendly. Therefore
we have taken various evaluation approaches. Firstly,
we provide reasons on why the specified require-
ments are fulfilled. Then, in order to prove high user-
friendliness, we have conducted a user-evaluation. Fi-
nally, since the platform should outperform previ-
ously used solutions, we have compared our solu-
tion to the one described by the participants during
requirements engineering (Figure 1). A pure perfor-
mance evaluation is not given, as the performance
strictly results from the underlying systems, espe-
cially Spark, which is already well documented and
not distorted by our approach, e.g. in (Ahmed et al.,
2020).
5.1 Fulfilment of the Specified
Requirements
Some of the stated requirements are satisfied as a re-
sult of the proposed architecture, e.g. scalability. Oth-
ers, e.g. adding own interactive environments are im-
plemented as a functionality of the Web-UI. In this
section we evaluate whether specified requirements
are satisfied or not.
Requirement (R1) is completely fulfilled. If it is
possible to install YARN (which is already available
11
https://github.com/inovex/ispark
in most cases) and Kubernetes, any given infrastruc-
ture is suitable. In regards to (R2), a good scalabil-
ity has been achieved. The only components running
on the YARN edge-node are the ones that do not re-
quire to be scaled. The notebooks are subject to the
Kubernetes scheduler whereas their kernels are han-
dled by YARN, both using all available cluster nodes.
Furthermore, usage of Spark in cluster-mode results
in more fine-grained components and thus enhanced
distribution possibilities.
Requirement (R3) is satisfied as well. The combi-
nation of JupyterHub, JupyterLab and Jupyter Enter-
prise Gateway allows working with interactive note-
books together with Spark kernels thus utilizing dis-
tributed cluster resources. Requirements (R4) to (R8)
are fully satisfied and the realization of them is dis-
cussed in Section 4.1.
Regarding storage and encapsulation, i.e. require-
ments (R9)-(R11), as discussed in Section 4, personal
(PVC) and shared (HDFS) storage is accessible from
the notebook. Further, encapsulation is given since
interactive environments (JupyterLab) are running as
separate containers and the kernels of each notebook
are separately managed by the kernel gateway. Thus,
all three requirements are satisfied.
The requirement (R12), i.e. utilizing cluster re-
sources from a local notebook, is satisfied. It is pos-
sible to connect to Jupyter Enterprise Gateway from
a local notebook session. While starting such a note-
book, it is only necessary to provide the address of
the kernel gateway, i.e. edge-node address and cor-
rect port.
The specified requirements are fully satisfied.
However, especially the ones dealing with user inter-
faces need to be evaluated additionally. Although they
are implemented, it is necessary to check, whether
they are actually usable. Thus, a user-evaluation is
discussed next.
5.2 User-evaluation
It is important to see, whether provided functionali-
ties are usable in a user-friendly manner. An evalu-
ation session with every participant consisted of two
parts: solving 6 tasks with the platform followed by
questions regarding user-friendliness and at the end,
the User Experience Questionnaire (UEQ) (Schrepp
et al., 2014), which consists of 8 questions.
In total, 20 participants contributed to this evalua-
tion. The average score of data science experience is
3.05 of 5. Experience in using interactive notebooks
2.95 and general software usage 4.8. 90% of them
have a computer science related background (bache-
lor, master degree or higher) and 80% actively work
A Platform for Interactive Data Science with Apache Spark for On-premises Infrastructure
73
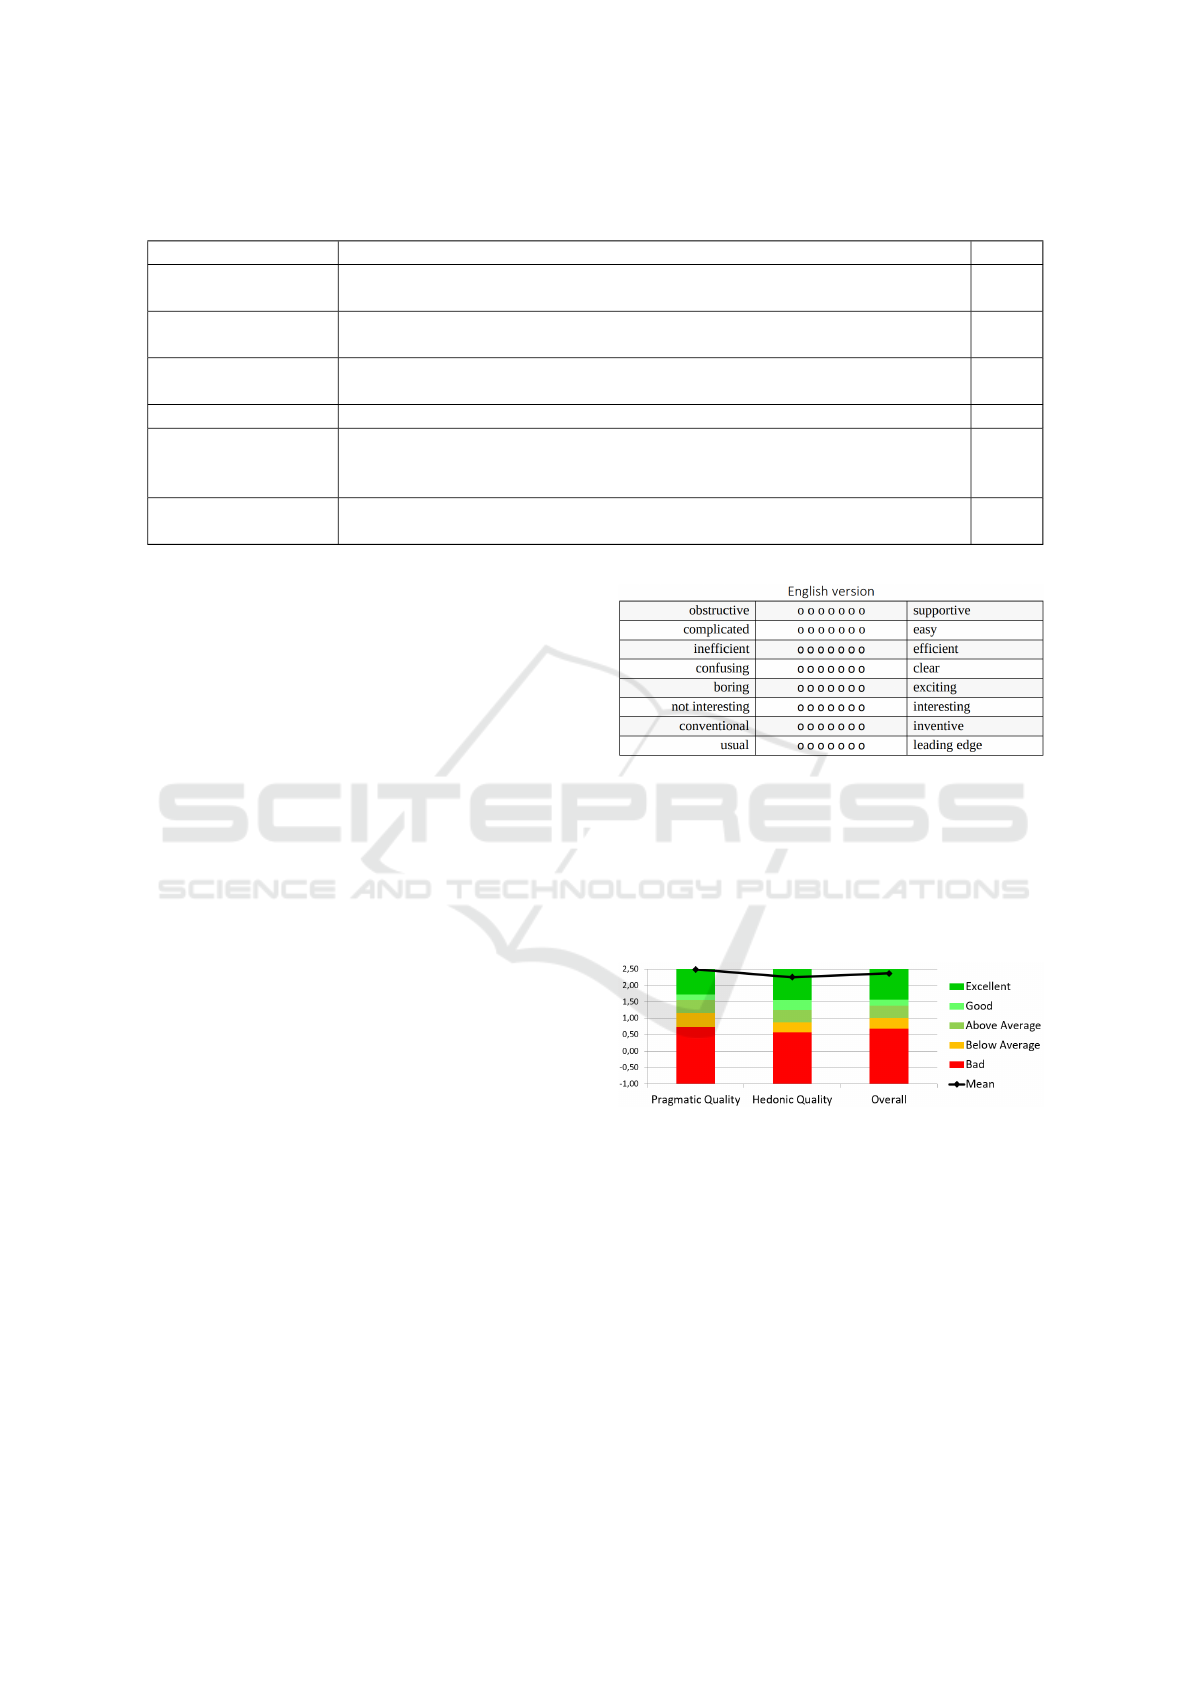
Table 1: The six tasks, each representing a core functionality of the platform with the corresponding score for achieved
user-friendliness.
Task Description Score
Kernel overview Browsing available kernels; finding a kernel that has a specific package (pan-
das) installed and modifying its resources
4.75
Cluster overview Describing the current state of the (YARN) cluster in regards to specific as-
pects (e.g. general RAM usage) on the cluster overview page
4.2
Adding a new kernel Creating a new kernel (new interactive environment) with provided specifi-
cation
4.6
JupyterLab Starting JupyterLab and selecting the previously created kernel 4.75
Viewing logs Viewing logs of the running notebook application and killing it. A remark
was added that this happens from the Web-UI and not from the JupyterLab
opened in last task
4.6
Setting limits The last task required logging out and logging in as an administrator in order
to set specified limits for users
4.6
in IT-related companies (middle sized).
Task-oriented Evaluation. Firstly, a user was
asked to solve six tasks that refer to the major func-
tionalities of the platform. Each task was followed
with questions regarding user-friendliness. Answers
were possible within a range from 1 to 5, where 5 is
the best score. Table 1 briefly explains the tasks and
provide the achieved user-friendliness score.
As shown in the below table, the general user-
friendliness of the platform is very high. One of the
reasons for it, is the simplicity of provided functional-
ities and the fact, that there are only a few core func-
tionalities. The named issues are mostly of a rather
aesthetic nature and the high score proves that the ac-
tual functionalities are present and well implemented.
User Experience Questionnaire. The UEQ pro-
vides a benchmark that allows comparison to other
software products using the data provided by 14056
persons from 280 studies. After completing the 6
tasks, each participant was asked questions from the
short version of the UEQ template. The posed ques-
tions are based on 8 items as presented in Figure 6,
e.g. the first question was: How supportive do you
find this platform? The left side of the scale has a
negative meaning, e.g. obstructive and the right a pos-
itive, e.g. supportive. Thus, the middle of the scale re-
sults in a neutral answer and as a result, a scale from
-3, through 0, to +3 is given.
Based on the results for each of the 8 items, three
major qualities are generated. Firstly, the pragmatic
quality, i.e. usefulness, efficiency and ease of use.
The second one is the hedonic quality, e.g. whether
presented functionalities are original, interesting, en-
gaging or exciting. Finally, an overall quality is given.
Figure 6: The 8 items of the short UEQ template. Each of
these items was formed into a question the participant was
supposed to answer.
The resulting qualities can be seen in Figure 7. As
shown, the platform achieved a very high score and
placed itself in the excellent class. Below results for
every item are briefly discussed.
Figure 7: The benchmark provided by the UEQ template.
Referring to the scale from -3 to +3, for the first item,
whether the participant finds the platform supporting,
an average score of 2.6 is given. This high score can
be explained by the simple fact, that creating Spark
kernels and the general way to a notebook is indeed
very easy. Even users with lacking experience in
data science and Jupyter notebooks can easily create a
Spark kernel with desired libraries within a few min-
utes. They don’t even have to specify resources since
default ones are suggested.
Further, as shown previously, the general user-
friendliness is very high and every task was rather
CLOSER 2021 - 11th International Conference on Cloud Computing and Services Science
74

easy to solve, hence the next three items, complicated
- easy, inefficient - efficient, confusing - clear, have
got high scores as well, accordingly, 2.6, 2.6 and 2.2.
The weakest item is the boring - exciting item,
which is part of the hedonic quality. Its average score
is 1.8, which still is a good result. Although such a
platform is not meant to be exciting per se, as stated
by users, the architecture and provided functionalities
are exciting to them. Further, other users were re-
luctant to describe the platform as boring. The item
not interesting/interesting has an average score of 2.8
which is caused by the fact, that single functionalities
offered by the platform are interesting, e.g. adding
own Spark kernels or the simple way to use note-
books. More technical users found the architecture
very interesting.
Finally, the conventional - inventive and usual -
leading edge items have got a score 2.4 and 2.1 ac-
cordingly. Some users were not familiar with data
science platforms, hence for them it was something
never seen before. Other users with more profound
knowledge were aware that similar platforms exist,
however, not for on-premises infrastructures and not
with Spark in cluster-mode from within a notebook,
hence for them it was something new as well.
As discussed above, the users took into account
not only the bare user interfaces, but also the actual
functionalities that said UIs represent. Hence the pre-
sented score is not only about the aesthetic of the plat-
form, but rather about the advantages it brings, e.g.
quick way to a Spark notebook or the cluster overview
that offers rapid information about its current state.
In terms of aesthetics, simplicity played a major role,
e.g. while adding a new kernel, only simple informa-
tion need to be provided.
5.3 Comparison against Previous
Architecture
The architecture used previously for on-premises in-
frastructure has been presented in Section 2. The plat-
form proposed in this paper brings several advantages
over that solution.
The scalability has been greatly improved. In-
stead of spawning on one specific node (edge-node),
as shown in Figure 1, the notebooks are distributed
through the whole Kubernetes cluster, thus avoiding
the bottleneck situation and utilizing cluster resources
more optimally. Furthermore, Spark in cluster-
mode allows much better and fine-grained distribu-
tion, since smaller components are present and thus
the scalability factor is additionally increased.
A huge step forward has been made in terms of
isolation as well. Since the kernel does not reside
within the notebook, the Spark driver program is also
separated from the notebook as it exists within the
kernel. In result, Spark in cluster-mode is given and
thus the problem of collecting distributed data back
to the notebook, as described in Section 2, does not
have any consequences for other users. Since the ker-
nel with the Spark driver is a YARN container (man-
ageable resource), it is strictly restricted in terms of
resources. In the worst case, such an operation would
lead to failing the application without causing a fail-
ure of the whole node.
The almost non-existent user-friendliness for the
previous solution has increased tremendously. Above
all, because of the included Web-UI (and the API-
server in back-end). Firstly, the fundamental func-
tionality of starting interactive environments. Instead
of a manual deployment of notebooks from the edge-
node (via terminal), besides logging in into the plat-
form, a simple click on the Start Jupyter button is
enough.
Further, managing interactive environments, e.g.
creating new environments or modifying their re-
sources is now available from a simple UI, allowing
access to unified environments for all users. Even in-
experienced users are able to easily create their own
kernels and utilize them. This was certainly not the
case in the previous solution, as manual deployment
requires technical knowledge in terms of Spark and
notebooks in general (e.g. in terms of specifying re-
sources). Furthermore, restricting user actions was
not possible in the previous solution, thus everyone
could acquire as many resources as he/she desired, ef-
fectively blocking other users from starting their ses-
sions. This again has been improved in the proposed
solution, as it is possible to set limits for users.
The cluster overview provided by the Web-UI is
a functionality, that was missing in the previous so-
lution as well, which only offered the rather compli-
cated and technical YARN and Spark UIs. The pro-
posed solution, as already discussed, offers a simplis-
tic and easy to grasp overview of the current cluster
state.
It is important to notice, that this proof-of-concept
prototype is not meant as a direct competition to com-
mercial cloud services and platforms like Databricks.
Thus, a deeper comparison of the proposed prototype
to such a service in terms of performance and avail-
able features is not in focus. Our platform is meant
to fill the niche for on-premises infrastructure, where
usually only ad-hoc setups are utilized as no holistic
solutions exist.
A Platform for Interactive Data Science with Apache Spark for On-premises Infrastructure
75

6 CONCLUSION
In the paper at hand, we conducted an intensive re-
quirements engineering process that evaluated the
situation of holistic platforms for interactive data
science on distributed resources. As found out,
while such platforms are available for cloud, the on-
premises infrastructure is certainly missing in this as-
pect. The used solutions are rather primitive and
are lacking in terms of scalability, isolation and user-
friendliness.
Based on the data gathered during requirements
engineering process, we specified requirements, that
such a platform should fulfill. As next, we proposed
the architecture for such a platform. The proposed
solution offers high isolation of working users and
is scalable, supporting even large amount of users
working simultaneously. It provides users with in-
teractive notebooks with Spark integrated out-of-the-
box. Furthermore, the centralized Web-UI offers ker-
nel management, allowing users to create their own
environments in a user-friendly way and provides an
overview of the current cluster state.
The proposed solution was then evaluated. Firstly,
the specified requirements are fully satisfied. Further,
a usability evaluation was conducted, which provided
very high results, proving, the functionalities are in-
deed given and well implemented. Finally, a compar-
ison to a previously used solution was made, showing,
that the proposed platform outperforms it in terms of
scalability, isolation and user-friendliness.
As next step, a more dedicated user-management
system should be implemented, including an authen-
tication system like Kerberos
12
. The one used cur-
rently is rather simplified and offers only two groups
of users: a normal user and an administrator.
Despite the future steps stated above, the pro-
posed solution is already fully usable, providing a
user-friendly data science platform for data scien-
tists working with on-premises infrastructure. Since
the offered solution is available under the MIT open-
source license, it’s free to use for commercial pur-
poses and could even be further adapted to the on-
premises infrastructure at hand.
REFERENCES
Ahmed, N., Barczak, A. L., Susnjak, T., and Rashid, M. A.
(2020). A comprehensive performance analysis of
apache hadoop and apache spark for large scale data
sets using hibench. Journal of Big Data, 7(1):1–18.
12
https://tools.ietf.org/html/rfc4120#section-1.6
Bocchi, E., Castro, D., Gonzalez, H., Lamanna, M., Mato,
P., Moscicki, J., Piparo, D., and Tejedor, E. (2019).
Facilitating collaborative analysis in swan. EPJ Web
of Conferences, 214:07022.
Chrimes, D., Moa, B., Zamani, H., and Kuo, M.-
H. (2016). Interactive healthcare big data ana-
lytics platform under simulated performance. In
2016 IEEE 14th Intl Conf on Dependable, Au-
tonomic and Secure Computing, 14th Intl Conf
on Pervasive Intelligence and Computing, 2nd
Intl Conf on Big Data Intelligence and Comput-
ing and Cyber Science and Technology Congress
(DASC/PiCom/DataCom/CyberSciTech), pages 811–
818. IEEE.
Contu, R. and Pang, C. e. a. (2019). Forecast: Public Cloud
Services, Worldwide, 2017-2023, 3Q19 Update. Gart-
ner.
Dean, J. and Ghemawat, S. (2010). Mapreduce: a flexible
data processing tool. Communications of the ACM,
53(1):72–77.
Hosseini Shirvani, M., Rahmani, A. M., and Sahafi, A.
(2018). An iterative mathematical decision model for
cloud migration: A cost and security risk approach.
Software: Practice and Experience, 48(3):449–485.
McPadden, J., Durant, T. J., Bunch, D. R., Coppi, A., Price,
N., Rodgerson, K., Torre Jr, C. J., Byron, W., Hsiao,
A. L., Krumholz, H. M., et al. (2019). Health care
and precision medicine research: analysis of a scal-
able data science platform. Journal of medical Inter-
net research, 21(4):e13043.
Piparo, D., Tejedor, E., Mato, P., Mascetti, L., Moscicki,
J., and Lamanna, M. (2018). Swan: A service for
interactive analysis in the cloud. Future Generation
Computer Systems, 78:1071–1078.
Ramachandran, M. and Mahmood, Z. (2017). Require-
ments engineering for service and cloud computing.
Springer.
Schrepp, M., Hinderks, A., and Thomaschewski, J. (2014).
Applying the user experience questionnaire (ueq) in
different evaluation scenarios. In International Con-
ference of Design, User Experience, and Usability,
pages 383–392, Heraklion, Crete, Greece. Springer.
Vavilapalli, V. K., Murthy, A. C., Douglas, C., Agarwal,
S., Konar, M., Evans, R., Graves, T., Lowe, J., Shah,
H., Seth, S., et al. (2013). Apache hadoop yarn: Yet
another resource negotiator. In Proceedings of the 4th
annual Symposium on Cloud Computing, pages 1–16.
Zaharia, M., Xin, R. S., Wendell, P., Das, T., Armbrust,
M., Dave, A., Meng, X., Rosen, J., Venkataraman, S.,
Franklin, M. J., Ghodsi, A., Gonzalez, J., Shenker,
S., and Stoica, I. (2016). Apache spark: A uni-
fied engine for big data processing. Commun. ACM,
59(11):56–65.
Zhang, Z. (2007). Effective requirements development-
a comparison of requirements elicitation techniques.
Software Quality Management XV: Software Quality
in the Knowledge Society, E. Berki, J. Nummenmaa, I.
Sunley, M. Ross and G. Staples (Ed.) British Computer
Society, pages 225–240.
CLOSER 2021 - 11th International Conference on Cloud Computing and Services Science
76
