
Morocco's Trade, between Free Trade Agreements and Integration
into the African Union: Which Potential for Morocco's Foreign
Trade?
Oumaima Saadallah and Benaceur Outtaj
Laboratory of Economic Analysis and Modeling (LEAM), Research Center CIRPEC,
Mohammed V University of Rabat, Morocco
Keywords: Globalization, Free Trade Agreements, the African Continent, Trade Flows, Gravity Model, Trade Potential.
Abstract: In a context characterized by a remarkable consolidation of Morocco's efforts to effectively integrate the
globalization process, represented mainly by the signing of free trade agreements and the orientation towards
intra-regional trade with the African continent, this work aims at analyzing the trade flows of Morocco and
its two main trading partners; those of the African continent and those with which it has signed free trade
agreements, over the period 2000-2018. For this purpose, we use an augmented gravity model to estimate
trade between Morocco and these two groups of partner countries, and then simulate and calculate the trade
potential between Morocco and these countries. The results we generated demonstrate the existence of a trade
potential not yet exploited by Morocco in the two cases studied. The effective exploitation of the latter would
allow the Kingdom to boost its trade.
1 INTRODUCTION
In recent decades, the world economy has
experienced accelerated growth. This growth has
been largely sustained by the even faster growth in
international trade. Growth in trade can result from
technological advances as well as specific efforts to
promote trade and remove barriers. Thus, many
developing countries have opted to open up their
economies in order to take advantage of the
development opportunities offered by foreign trade.
However, the majority of these countries still do not
adopt this approach.
Morocco, as a developing country, has become
aware of the importance of trade openness as a key
factor in accelerating the development of its
economy. To this end, since the end of the 1990s, the
opening of the Moroccan economy has been
characterized by a remarkable and diversified
progress, particularly with the signing of free trade
agreements with the European Union, Egypt, Tunisia,
Jordan, the United States, Turkey and the United
Arab Emirates. This openness continues to develop
over time with the integration of Morocco into the
African Union and the strengthening of its relations
with its African neighbors by signing more than a
thousand agreements since 2000. The main objective
of this paper is to conduct empirical research to
analyze the trade between Morocco and its trading
partners, whether under free trade agreements or
those of the African continent. Such an analysis will
mainly allow to identify the potential of trade that the
kingdom has with its partners and the opportunities it
can get out of it to reduce its trade deficit. To do so,
we use a gravity model to estimate the magnitude of
trade between Morocco and the countries with which
it has signed FTAs on the one hand and Morocco and
countries on the African continent on the other. Based
on these estimates, it will be possible to simulate the
potential bilateral trade between Morocco and its
partners and to understand the weaknesses and
strengths of these trade relationships to finally
determine the countries with which it would be
beneficial to strengthen trade relations.
2 THE STRUCTURE OF
MOROCCO’S FOREIGN
TRADE
The openness rate of the Moroccan economy is
characterized by a growing trend: a remarkable
decrease from 2009 because of the global economic
80
Saadallah, O. and Outtaj, B.
Morocco’s Trade, between Free Trade Agreements and Integration into the African Union: Which Potential for Morocco’s Foreign Trade?.
DOI: 10.5220/0010447400800088
In Proceedings of the 3rd International Conference on Finance, Economics, Management and IT Business (FEMIB 2021), pages 80-88
ISBN: 978-989-758-507-4
Copyright
c
2021 by SCITEPRESS – Science and Technology Publications, Lda. All rights reserved
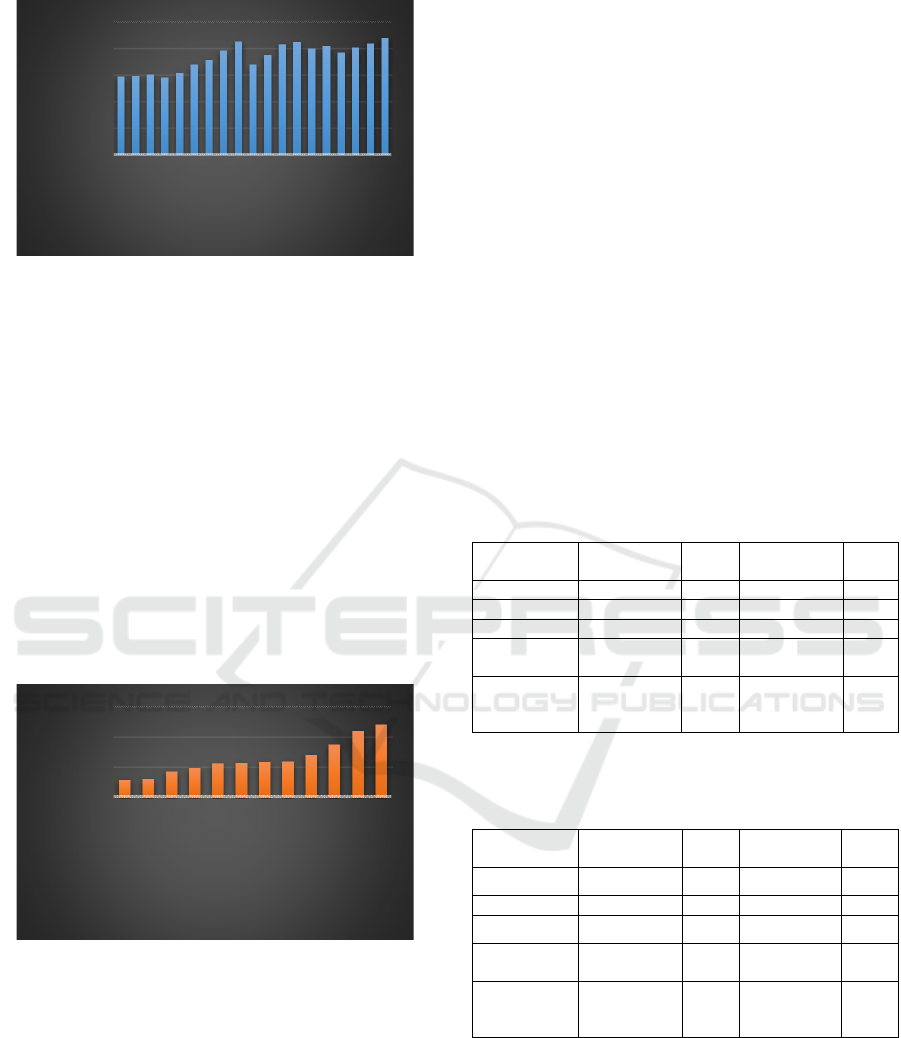
Source: Generated by the author from UNCTADstat database.
Figure 1: Morocco’s opening rate during the period from
2000 to 2018.
crisis and a recovery since then to return to pre-crisis
levels.
Morocco's trade was multiplied by 4.5 from 1999
to 2018, rising from USD 17.5 billion to USD 80.1
billion according to the World Bank). The kingdom's
openness rate (calculated as the ratio (exports +
imports) to GDP) increased from 54.62% in 1999 to
87.99% in 2018.
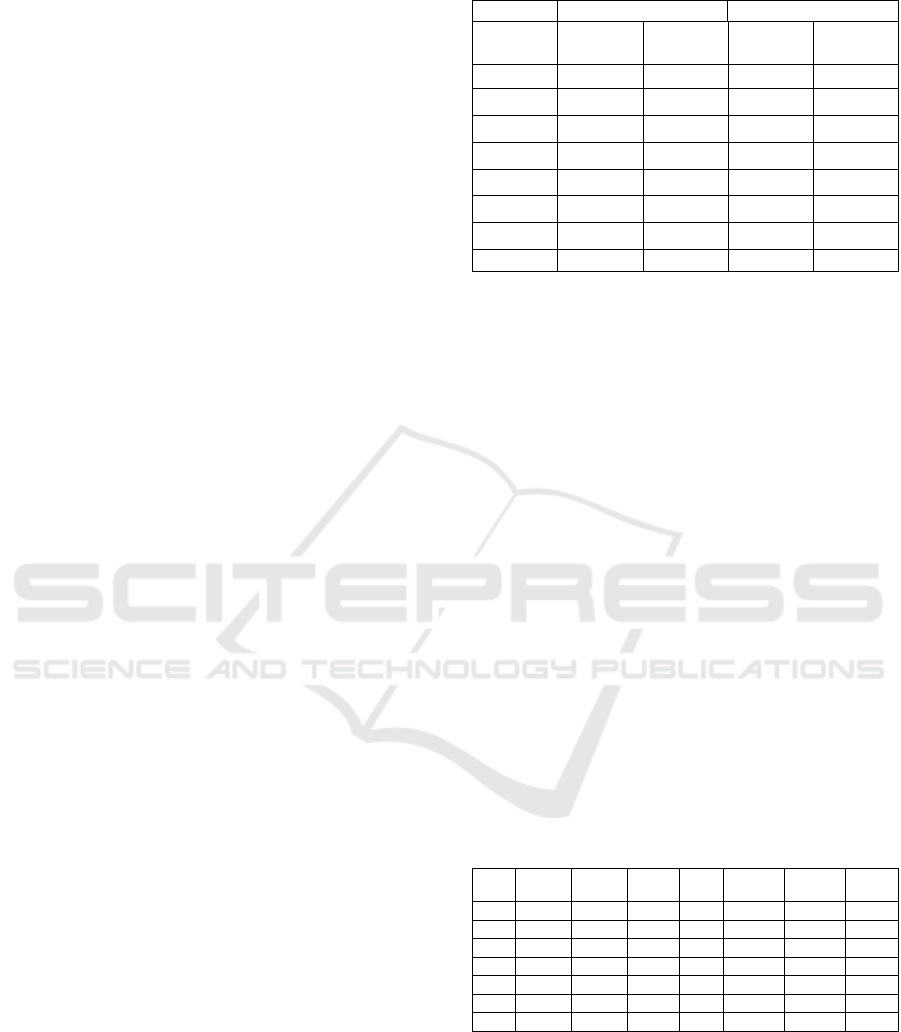
Comparing Morocco to other middle-income
countries, the Moroccan economy is more open than
Brazil’s with a rate of 29.08%, Argentina with 30.7%,
India with 43.37%, Algeria (56%) or Turkey (60%),
but it’ less than Tunisia (99%) or Mauritania (126%),
and is almost at the average for the Arab world (89%).
Source: Generated by the author from UNCTADstat database.
Figure 2: the opening rate of a panel of emerging countries
in 2018.
The principal source of this openness to foreign
trade is the strong growth in imports, which has
resulted in a significant worsening of the trade deficit.
The trade deficit widens for the third consecutive
year, to reach 205.9 billion DH in 2018 representing
18.5% of GDP against 17.8% in 2017.
In 2018, Morocco's trade balance shows a deficit
with all continents except Africa, with which
Morocco records a trade surplus.
2.1 Foreign Trade between Morocco
and Its African Partners
Trade between Morocco and its African partners has
grown remarkably (from an average of US$342.78
million during the period 1995-1999 to an average of
US$1.08 billion in 2000-2018 for exports and
US$469.64 million to US$1.58 billion for imports
over the same periods), However, if we reason in
terms of weight, their share in Morocco's total trade
has remained almost the same for both imports and
exports, yet we note that the share of Morocco's trade
with the European Union still represents the largest
share of the kingdom's trade with the rest of the world
(more than 50% of exports and also imports). In
addition, the weight of North Africa remains
important in Moroccan trade with the African
continent. However, over the last two decades, North
Africa has ceded its position in favor of sub-Saharan
Africa in terms of exports with the Kingdom.
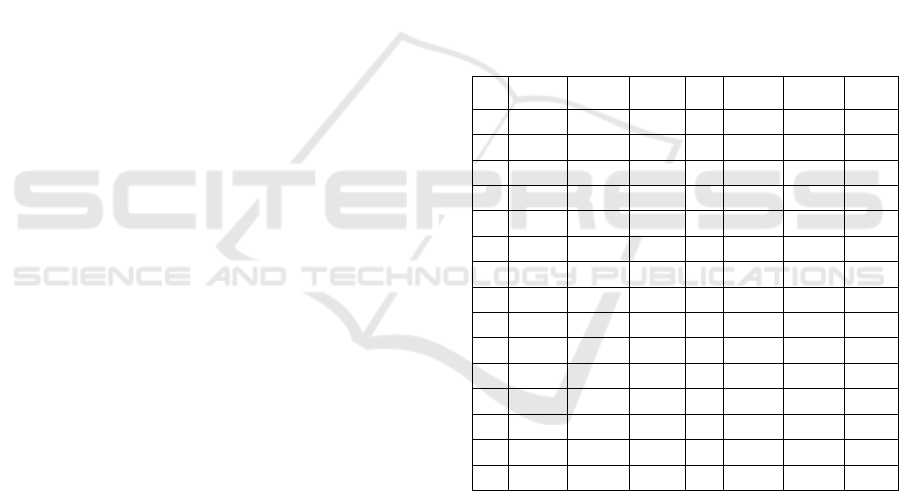
Table 1: Morocco’s exports to the African continent in
thousands of U.S. dollars.
Partner Average
1995-1999
Part Average
2000-2018
Part
World 7090602.33 1.00 16856013.81 1.00
Africa 342778.83 0.05 1082939.39 0.06
North of Africa 226326.65 0.03 314399.90 0.02
Sub-Saharan
Africa
118034.25 0.02 754652.98 0.04
EU28
(European
Union)
4752639.11 0.67 10713593.65 0,64
Source: Generated by the author from UNCTADstat database.
Table 2: Morocco’s imports from the African continent in
thousands of U.S. dollars.
Partner Average
1995-1999
Part Average
2000-2018
Part
World 10065480.81 1.00 32095669.11 1.00
Africa 469637.30 0.05 1583563.85 0.05
North of Africa 242532.78 0.02 379422.13 0.01
Sub-Saharan
Africa
227417.13 0.02 1204689.29 0.04
EU28
(European
Union)
5306733.78 0.53 16865816.36 0.53
Source: Generated by the author from UNCTADstat database.
The classification of Moroccan exports to the
African continent by country confirms that North
African countries are the most dominant, notably
Algeria, Tunisia, Libya and Egypt which still retain
their position among the top 10 preferred destinations
for Morocco's exports on average over the two
periods 1999-1995 and 2000-2018, with Libya as
0
20
40
60
80
100
2000
2002
2004
2006
2008
2010
2012
2014
2016
2018
Opness rate
Years
0
50
100
150
Brazil
Argentina
India
Perou
Bolivia
Algeria
South Africa
Turkey
Paraguay
Morocco
Tunisia
Moauritania
Opness rate
Emerging countries
Morocco’s Trade, between Free Trade Agreements and Integration into the African Union: Which Potential for Morocco’s Foreign Trade?
81

Morocco's main African customer in 1999-1995,
before being replaced by Algeria over the period from
2000 to 2018, Tunisia still retains its place as
Morocco's second largest customer. As far as sub-
Saharan Africa is concerned, countries such as
Senegal, Côte d'Ivoire and Nigeria are still among
Morocco's first partners over both periods. What
these countries have in common is that they have
signed trade agreements with Morocco dating back to
at least 1980.
2.2 Trade between Morocco and FTA
Morocco's trade under FTAs accounts for the
majority of Morocco's overall trade (more than two-
thirds of exports and imports are to or from these
countries).
The agreement with the European Union remains
the main free trade agreement with a very large share.
Exports benefiting from this agreement amount to
US$10.71 billion in the period from 2000 to 2018.
Reasoning in terms of share, we note that the weight
of Morocco's exports to the EU fell from 67%
between 1995 and 1999 to 63% in the period from
2000 to 2018. On the import side, we note a
stagnation of the share of EU countries with a
percentage of 53%.
The agreement with the Arab Free Trade Area
represents the second dominant group in the trade
carried out within the framework of FTAs, with a
very low share compared to the agreement with the
European Union (0.04 for exports and 0.11 for
imports in the period from 2000 to 1018). The
agreement with the United States ranks third before
the agreement with Turkey. For all the free trade
agreements signed by Morocco, it is noticeable on the
one hand that the level of exports over the periods
1995-1999 and 2000-2018 has decreased and on the
other hand that imports have increased. Over time, the
latter eventually outweighed exports to reach 74%.
Table 3: Moroccan exports in the framework of FTAs in
thousands of U.S. dollars.
Partner Average
1995-1999
Part Average
2000-2018
Part
World 7090602.33 1.00 16874528.08 1.00
EU28
(European
Union)
4752639.11 0.67 10706101.84 0.63
AFTA 352872.25 0.05 655513.82 0.04
Turkey 55487.75 0.01 324059.04 0.02
USA 274914.86 0.04 682100.88 0.04
Others 68755.84 0.01 212007.75 0.01
FTAs 5435913.97 0.77 12367775.58 0.73
Source: Generated by the author from UNCTADstat database.
Table 4: Moroccan imports within the framework of the
FTAs in thousands of U.S. dollars.
Partner Average
1995-1999
Part Average
2000-2018
Part
World 10065480.8 1.00 32076261.8 1.00
EU28
(European
Union)
5306733.78 0.53 16860506.7 0.53
AFTA 870965.32 0.09 3656892.75 0.11
Turkey 89138.17 0.01 971340.30 0.03
USA 606946.28 0.06 2042314.97 0.06
Others 118559.58 0.01 316112.27 0.01
FTAs 6992343.13 0.69 23847166.99 0.74
Source: Generated by the author from UNCTADstat database.
The classification of Moroccan exports to the
European Union by country shows that France, Spain,
Germany, Italy, Belgium, Portugal and Poland are
still at the top of the list of preferred destinations for
Morocco's exports on average over the two periods
1999- 1995 and 2000 and 2018, with France and
Spain still holding their leadership as Morocco's first
and second customer respectively since 1995.
Germany was Morocco's third European customer in
1999-1995, before leaving its place to Italy over the
period from 2000 to 2018. The United States, in turn,
occupies a very important place in Moroccan trade to
the world; it is among the top ten preferred
destinations for Morocco on average during both
periods with a remarkable improvement; moving
from sixth position in the 1995-1999 period to fourth
in the following period. Such improvement is also
noticeable in trade with Turkey, from eleventh to
ninth rank in both periods respectively.
But it should be noted that the Kingdom has not been
able to take advantage of these agreements. In fact,
out of more than fifty countries with which it has
signed free trade agreements, it has a trade deficit
except with Jordan.
3 GRAVITATIONAL MODEL:
LITERATURE REVIEW
3.1 The Theoretical Foundations of the
Gravity Model
The International Trade Gravity Model is considered
to be the most effective model for forecasting and
explaining bilateral trade from an econometric
perspective. This model is based on the principle of
the Newtonian theory of gravitation; it highlights
trade between two economies as a function of their
GDP, which represents the economic power of the
FEMIB 2021 - 3rd International Conference on Finance, Economics, Management and IT Business
82

countries, and the distance between them, which
represents transport costs.
Anderson (1979)
1
was among the firsts to attempt
to provide a theoretical basis for gravity models.
Anderson's theory is based on a hypothesis that was
considered innovative at the time, namely, that each
nation produced a unique good that was only
imperfectly substitutable for the goods of other
nations.
The next set of theoretical foundations for the
gravity equation came when Bergstrand (1985)
2
sought to provide theoretical foundations based on
monopolistic competition; in particular, he develop
the idea discussed by Paul Krugman (1980)
3
, and
Helpman and Krugman (1985)
4
. In this model, similar
countries trade differentiated goods because each
consumer has a preference for variety.
This approach, which theoretically derives the
equation from the gravity model, is mainly used to
explain intra-industry trade. More generally, the
emergence of the "new trade theory" in the late 1970s
and early 1980s explained the volume of trade
between two countries by the size of the economies,
distance, price levels, and the exchange rate. In light
of this trend of studies, the gravity model has moved
from too few theoretical bases to too many. This
theory is particularly successful in approximating the
potential for trade between developed countries.
A. Presentation of the gravity model :
The simple gravity model is written as
:
𝑋
=𝑐
𝑌
𝑌
𝐷
With:
X
: is the level of exports from country i to country j;
c : is a constant;
Y
: is the volume of GDP of country i;
Y
: is the volume of GDP of country j;
D
: is the distance from country i to country j;
We take this equation in logarithmic form so that we
can interpret the coefficients of each explanatory
variable in terms of elasticity:
log(𝑋
) = log(𝑐) + 𝛼
log𝑌
+𝛼
log𝑌
+𝛼
log𝐷
1
Anderson J. (1979) A Theoretical Foundation for the Gravity
Equation, American Economic Review, vol. 69, n° 1, 106-116
2
Bergstrand, J.H. (1985). The gravity equation in international
trade: Some microeconomic foundations and empirical evidence.
Review of Economics and Statistics num. 67
3
Krugman, P. (1980). Scale economies, product differentiation,
and the pattern of trade. The American Economic Review, n° 70.
This so-called simple model takes only GDP and
distance as explanatory variables, but in reality
foreign trade is not only influenced by these two
factors, hence the need for the augmented gravity
model that adds other potential determinants to
broaden the scope of the model and better capture the
effect of other characteristics of trading partners.
The first augmented gravity model emerged through
the work of Tinbergen, Linneman (1966)
5
by
including a single "population" variable as an
explanatory variable in the simple gravity equation.
Then, recent empirical studies (Frankel, 1997;
Frankel et al., 1995; Glick and Rose, 2002; Anderson
and van Wincoop, 2003; Carrère, 2004) have
attempted to add other variables that influence trade
in order to further increase the simple gravity model
such as: the level of economic development measured
by GDP per capita, cultural factors such as common
language and common colonizer; trade agreements;
common borders; etc. The first model of augmented
gravity was developed by Tinbergen, Linneman
(1966) by including a single "population" variable as
an explanatory variable in the simple gravity
equation.
Taking these improvements into account, the
logarithmically augmented gravity model can be
written in the following generalized form:
log(𝑋
) = log(𝑐) + 𝛼
log𝑌
+𝛼
log𝑌
+𝛼
log𝐷
+𝛾
log𝐵
+𝜀
Where:
X
: is the level of exports from country i to country j;
c : is a constant;
Y
: is the volume of GDP of country i;
Y
: is the volume of GDP of country j;
D
: is the distance from country i to country j;
B
: any other variables that influence trade such as
population sizes, trade agreements (Ghosh and
Yamarik, 2004; Carrère, 2004), common language
and common border, etc.
4
Helpman, E. & P. Krugman (1985). Market structure and foreign
trade: Increasing returns. Imperfect Competition and the
International Economy. Cambridge, MA: MIT Press
5
Linnemann, H. (1966). An econometric study of international
trade flows. Dissertation. Netherlands School of Economics.
Morocco’s Trade, between Free Trade Agreements and Integration into the African Union: Which Potential for Morocco’s Foreign Trade?
83

4 ESTIMATION METHODS AND
RESULTS
4.1 Data Base
Our estimates are based on two samples: a sample of
44 countries that includes Morocco's African partners
and the second sample of 43 countries that includes
the various countries with which Morocco has signed
free trade agreements (see Annex 1). Our study
analyzes the period from 2000 to 2018. The export
variable was collected from the UNCTADstat
database. GDP, GDP per capita, area and population
are available in the World Bank's database (WDI).
The distances between Morocco and each partner and
the common language and border dummy were
collected from the database available on geo-cepii.
Trade and investment agreements are extracted from
the UNCTAD database. All estimates were made
using Stata 15 and Eviews 9 software.
4.2 Expected Signs of the Variables
The expected signs of the variables give an idea of
their effects on trade flows.
The expected sign of GDP is positive because the
more developed countries are, the more they will tend
to trade. Weighted distance is a proxy for transport
costs and presents an obstacle to exchange, so it
negatively affects trade (negative sign).
The existence, or otherwise, of a common border
between two countries should have a considerable
effect on the volume of trade. The expected sign for
the coefficient on this variable is therefore positive.
Sharing a common official language in turn
considerably reduces trade barriers. This ease of
communication should also have a positive impact on
trade flows. To this end, we anticipate a positive sign
for this variable.
The presence of an investment agreement is often
followed by the establishment of trade agreements.
This variable leads to a reduction in resistance to
trade, which would then imply an improvement in
export flows. The expected sign of this variable then
is positive.
The surface area of importing countries is used to
express market size. The expected sign of this
variable is then positive.
4.3 Specification of the Model
We retain for our study an augmented specification of
the gravity model in the following form:
log(𝑋
) = 𝛼
+𝛼
log𝑌
+𝛼
log𝑌
+𝛼
log𝑃𝑂𝑃
+𝛼
log𝑃𝑂𝑃
+𝛼
log𝑆𝑢𝑝
+𝛼
log𝐷
+𝛼
𝐶𝑜𝑛𝑡𝑖𝑔
+𝛼
lang𝑜𝑓𝑓
+𝛼
𝐴𝐼
+𝑏
+𝑐
+𝑢
+𝜀
Where:
𝑋
: Exports of goods from the country to country j in
thousands of $US.
𝑌
𝑎𝑛𝑑 𝑌
The volume of GDP of country i and j in
constant US$ 2011;
𝑃𝑂𝑃
𝑎𝑛𝑑 𝑃𝑂𝑃
: The volume of the population of
country i and j;
𝑆𝑢𝑝
: The area of country j Km2;
log𝐷
: The weighted distance between countries i
and j;
𝐶𝑜𝑛𝑡𝑖𝑔
: The common border between i and j, takes
the two values 0 and 1;
lang𝑜𝑓𝑓
: The common language between i and j,
takes the two values 0 and 1;
𝐴𝐼
: Investment agreements between i and j (this
variable is devoted to the gravity model used to
estimate Morocco's trade with its African partners,
takes the two values 0 and 1);
𝑏
: Country specific effects i;
𝑐
: The country-specific effects j;
𝑢
: Individual effects specific to country pairs.
*These variables are in logarithmic form in the
model, which makes it possible to interpret their
coefficients in terms of elasticity.
4.4 Estimation Methods
Today, studies working on gravity models use panel
data estimates instead of time-series estimates. This
method makes it possible to exploit more
information-rich data with a greater number of
observations and a lower risk of collinearity, more
accurate and more efficient estimators.
In this study we use the following forms of panel
econometric models in order to find the best
estimates:
- Specific effects model estimation (fixed or random
effect) according to Hausman test results.
- The Generalized Least Squares model, in order to
be able to fill in the gaps of the fixed effects model
and the random effects model.
4.5 Estimation Results
The results of the estimation of the random-effect
model appear to be more relevant than the results
FEMIB 2021 - 3rd International Conference on Finance, Economics, Management and IT Business
84
estimated using the fixed-effect model. This model
takes into account dummy variables and assigns a
coefficient to each one. For comparison purposes, we
estimated the same equation using the Generalized
Least Squares Method; this model gives us better
results because it allows correlation and error
heteroscedasticity to be corrected.
The following summary table shows that the
variable Morocco's GDP and the GDP of importing
countries (whether African partners or those with
which Morocco has signed FTAs) have positive and
significant coefficients, in accordance with the
expected signs.
The distance variable is always negative and
significant. The values of these coefficients indicate
that exports are highly inelastic with respect to
resistance factors related to purchase costs.
Concerning the "common language", the coefficients
associated with this variable are positive and
significant. The values of these coefficients show that
exports are highly elastic in relation to the common
language (strictly greater than 1).
These results are robust because they are invariable
with the different estimation methods used, and in the
two different cases studied in our study (Morocco
with the African continent and Morocco with the
countries with which it has signed FTAs).
The coefficient of the surface area of the importing
country is not significant, and this is invariable with
the different estimation methods used.
With respect to trade and investment agreements,
used as a dummy variable in the case of gravity model
estimation between Morocco and African countries,
the coefficient of this variable is positive with all
three estimation methods and significant with the
random effect method.
All the signs of the coefficients of the gravity
models used for the two cases studied show their
conformity with the hypotheses formulated
previously. With the exception of the common border
between two countries, the expected sign is positive,
but the estimates show the opposite. This may be
justified by the fact that Morocco cannot cope with
the problems associated with tariff and especially
non-tariff barriers, such as the presence of complex
customs and administrative procedures and
regulations, inefficient and costly transport systems,
etc. The reason for this may be that Morocco is not
able to cope with the problems associated with tariff
and especially non-tariff barriers, such as the
presence of complex customs and administrative
procedures and regulations, inefficient and costly
transport systems.
Table 5: Estimation results of the gravity model.
Africa FTAs
Methods
Random
effect
GLS
Random
effect
GLS
log𝑌
1.01* 2.51** 1.66* 1.81*
log𝑌
2.52* 0.49** 1.31* 1.08*
log𝑆𝑢𝑝
-1.09 0.04 -0.15 -0.03
log𝐷
-2.51* -2.39* -1.70* -1.76*
𝐶𝑜𝑛𝑡𝑖𝑔
-1.96** -0.87* -0.61 -0.76*
lang𝑜𝑓𝑓
0.58** 0.39* 0.23*** 0.21*
𝐴
𝐼
0.49*** 0.07 - -
C -19.98* -21.91* -22.75* -22.1*
Source: Generated by the author from the eviews9 software.
Note: ***, ** and * refer to the significance of the
coefficients at the 1%, 5% and 10% thresholds
respectively.
5 ANALYSIS OF TRADE
POTENTIAL
Based on our previous estimates using the
Generalized Least Square Method, we calculate the
trade potential, which is the ratio of observed exports
to estimated exports.
A ratio that exceeds 100% means that there is no
untapped trade potential. On the contrary, a ratio
below 100 % means that there is trade potential to be
exploited and that the importing country should take
greater advantage of trade opportunities with the
partner country.
5.1 The Case of Trade between
Morocco and the African Continent
Table 6: Morocco’s trade potential with Africa.
Id export
estimated
export
trade
potential
CODE Export
estimated
export
trade
potential
BFA 1000.38
26525.53
3.77% SWZ 48.41 320.02 15.13%
CAF 1342.23 2182.72 61.49% SYC 321.20 427.50 75.13%
EGY 112.73
53061.59
0.21% TCD 5187.60 9004.10 57.61%
ETH 3568.57 3677.13 97.05% TUN
110003.16 125574.69
87.60%
LBY
62647.74 65723.74
95.32% UGA 2202.33 2222.36 99.10%
MWI 336.65 526.99 63.88% ZMB 18.44 1224.65 1.51%
RWA 1948.48 2954.31 65.95% ZWE 19.63 902.63 2.17%
Source: Author’s calculations using estimates
Estimating the ratios of Morocco's export trade
potential with these African partners allows the
following findings to be derived:
There is a category of countries with which
Morocco has no trade potential, where the ratio
calculated exceeds 100%. This group represents
almost 70% of our sample of African countries,
Morocco’s Trade, between Free Trade Agreements and Integration into the African Union: Which Potential for Morocco’s Foreign Trade?
85
including Algeria, Angola, Côte d' Ivoire, Kenya,
Mauritania, and South Africa.
A second category of countries with which
Morocco has a trade potential below 100%. In this
category, there is a group of countries with which the
kingdom has a trade potential that is below 50%, with
Egypt leading the way with the greatest potential for
adjustment (the lowest foreign trade potential),
followed by Zambia, Zimbabwe, Burkina Faso and
Eswatini. And a second group, countries with which
Morocco has a trade potential of more than 50%,
which are 9 of which: Central African Republic,
Ethiopia, Libya, Tunisia, and Uganda.
In general, we can see that Morocco manages to
exploit the full range of possible export potential with
African countries, with an average trade potential of
the entire sample exceeding 400 percent. This is
mainly due to Morocco's efforts to consolidate its
relations with the continent by signing more than
1,000 preferential agreements with its neighboring
countries. Moreover, when analyzing for each partner
country, the Kingdom needs to strengthen its efforts
to further boost trade with economies whose potential
is not fully exploited.
To boost Morocco's intra-African trade further, a
number of problems need to be addressed that impede
the exploitation of the continent's full export
potential. The problem of competitiveness of
Moroccan products relative to those of other countries
outside the continent is among the major problems
that need to be addressed. There are cases where
products that could have been supplied by Morocco
to other African countries are instead supplied by
other economies outside the continent because of
Morocco's lack of competitiveness. The latter is
associated in most cases with technical progress and
production processes, but there are other factors that
emerge particularly in the shipping and marketing
phase, such as the existence of complex customs and
administrative procedures and regulations, inefficient
and costly transport systems, differences in rules of
origin, and product and transport standards.
Therefore, it is essential to review and simplify
customs procedures to take full advantage of the
benefits offered by this market.
Infrastructure, in turn, is a major problem that
impedes such trade on the continent. Indeed,
inadequate and inefficient infrastructure is one of the
main causes behind the low level of trade between the
Kingdom and the African continent, and the lack of
competitiveness not only of Morocco but of the
continent in general. The establishment of solid
infrastructure (road, rail, and air) at the continental
level would undoubtedly lead to an optimization of
the costs and time required for the transport of goods.
The existence of appropriate financing
mechanisms is, for its part, a prerequisite for an
optimal and efficient exploitation of the trade
potential between African countries. The absence of
a common currency, regional institutions for
financing enterprises, and the lack of a continent-
wide currency are all factors that discourage many
enterprises and slow down the development of trade.
The development of continental financial institutions,
as well as regulatory frameworks to govern and
encourage trade and financial exchanges among
countries on the continent, are therefore necessary
conditions for African trade to begin to flourish.
5.2 The Case of Trade between
Morocco within the Framework of
Free Trade Agreements
Table 7: Morocco’s trade potential under FTAs.
Id Export
estimated
export
trade
potential
Id Export
estimated
export
trade
potential
ARE 89620.22 90631.17 98.88% IRQ 22642.95 84210.57 26.89%
AUT
184254.84 203603.54
90.50% ITA
1212853.3
3
1784329.7
4
67.97%
BEL
410076.78 504136.54
81.34% KWT 20769.57 34805.94 59.67%
BHR 6611.26 9832.33 67.24% LBY 62647.74 74190.20 84.44%
CYP 1919.67 5439.96 35.29% LTU 10197.99 20182.60 50.53%
CZE
128156.00 154389.20
83.01% LUX 4945.79 52295.07 9.46%
DNK 34560.13 98802.10 34.98% LVA 2823.26 10564.49 26.72%
EGY 112.73
407137.67
0.03% OMN 8604.60 15665.87 54.93%
EST 5103.07 7576.29 67.36% POL
290786.08 390329.98
74.50%
FIN 13731.12 47465.64 28.93% PRT
307833.95 1206630.5
0
25.51%
GBR
819553.47 1822898.90
44.96% SAU
148308.41 339048.62
43.74%
GRC 21400.30 101372.99 21.11% SWE
124708.36 134182.28
92.94%
HRV 19141.75 43495.10 44.01% TUN
110003.16 157639.52
69.78%
HUN 32175.81
102990.05
31.24% USA
1493148.111569362.01
95.14%
IRL 81596.83
200864.59
40.62% DEU
977399.41 2265120.77
43.15%
Source: Author’s calculations using estimates
According to this table, which groups together the
various countries with which Morocco has an export
trade potential of less than 100%, we can see that
Morocco exploits its full trade potential just with 13
countries in our sample of 43 countries, namely:
Bulgaria, Spain, Algeria, Malta, France, Jordan,
Lebanon, Netherlands, Qatar, Romania, Slovenia,
Sweden and Turkey.
The rest of the countries in the table with which
Morocco has a trade potential of less than 100 percent
can be subdivided into two categories: the one with
which Morocco has a high trade potential, which
includes 14 countries, including Denmark, and
FEMIB 2021 - 3rd International Conference on Finance, Economics, Management and IT Business
86

Germany, Egypt, Greece, Libya, and Portugal, and
one that brings together countries with which there is
a potential greater than 50% including: Austria,
Belgium, Kuwait, Tunisia and USA.
On average, we note that Morocco does not
manage to exploit all the potentialities of possible
exploitation with its partners within the framework of
the Free Trade Agreements, with an average trade
potential of the whole sample of 95%, which does not
exceed 100%. However, when analyzing in
individual terms, Morocco should focus more on
those countries with which it benefits from a partially
exploited trade potential.
The key to maximizing the trade potential that
exists between Morocco and the countries with which
it has signed FTAs is to first address the
competitiveness of Moroccan products vis-à-vis
products supplied by other developing countries such
as China, Turkey, and India. As already mentioned
above, to increase competitiveness, Morocco must
focus on simplifying customs and administrative
procedures in parallel with technical progress and
production processes.
It is also essential to strengthen the negotiating
team in the administrations. Especially when
negotiating with large nations, negotiators must have
the capacity to defend national interests. Transport
infrastructure is also a component that requires
development by Morocco.
6 CONCLUSIONS
The consolidation of trade relations between
Morocco and the rest of the world, in order to
integrate into the globalization process in an effective
manner, requires first and foremost the
implementation of reforms and sound and efficient
trade policies at the regional and global levels. The
results of the analysis of trade relations between
Morocco and the countries of the African continent
on the one hand and Morocco and the countries with
which it has signed free trade agreements on the
other, have shown the existence of a more or less
remarkable trade potential in both cases. Analyzing in
terms of Morocco's individual trade potential with
each group of partners, we find that:
The kingdom manages to exploit its full trade
potential with 70% of the African partner countries in
our sample. This result is satisfactory and shows that
Morocco manages to benefit effectively from the
relations consolidated with the African continent in
recent decades.
On the other hand, within the framework of free
trade agreements, Morocco has a trade potential with
32 countries. This result is not surprising and reveals
the weakness of relations between Morocco and these
partners. In fact, based on a logic based on the
Kingdom's trade balance, it can be seen that out of all
the countries with which it is linked by free trade
agreements, it records a trade deficit except with
Jordan.
These observations show that the Kingdom's trade
relations with its partners (from the African continent
and especially the countries with which it has signed
free trade agreements) can be pushed beyond their
current levels by focusing especially on economies
whose potential is not fully exploited.
In order to benefit from this trade potential,
Morocco must address several problems to increase
its international competitiveness, notably through the
substantial reduction of tariff and especially non-
tariff barriers (the presence of complex customs and
administrative procedures and regulations, inefficient
and costly transport systems, differences in rules of
origin and product and transport standards) in order
to significantly boost exports. Indeed, these problems
are very often identified as major barriers to
sustainable growth in Morocco's trade. The reduction
of these barriers will have to go hand in hand with the
development of a competitive and harmonized
business ecosystem to facilitate trade, as well as a
focus on the development of an integrated transport
infrastructure scheme to reduce transaction costs over
time.
ACKNOWLEDGEMENTS
Authors would like to thank the National Center for
Scientific Research (CNRST) of Morocco for its
support for this research through the excellence
scholarship.
REFERENCES
Achy L. (2006) Le commerce en Afrique du Nord :
évaluation du potentiel de l’intégration régionale,
Rapport pour le Bureau Afrique du Nord de la CEA,
Rabat, 32 p
Alain Pirotte (2013), Econométrie des données de panel:
Théorie et applications, édition ECONOMICA, 2011.
Albert Millogo, Nassim Oulmane (2012), Potentiel De
Commerce Dans L'espace Maghrébin, Cairn.info pour
De Boeck Supérieur, DOI: 10.3917/med.158.0115.
Morocco’s Trade, between Free Trade Agreements and Integration into the African Union: Which Potential for Morocco’s Foreign Trade?
87
Anderson J. (1979) A Theoretical Foundation for the Gravity
Equation, American Economic Review, vol. 69, n° 1,
106-116
Anderson J., Van Wincoop E. (2003) Gravity with Gravitas:
A Solution to the Border Puzzle, American Economic
Review, vol. 93, n° 1, 170-192.
Bergstrand, J.H. (1985). The gravity equation in international
trade: Some microeconomic foundations and empirical
evidence. Review of Economics and Statistics num. 67.
Carrere, C. (2003). Revisiting the effects of regional trade
agreements on trade flows with proper specification of
the gravity model. European Economic Review, 50(2),
223-247.
Frankel J. A., Stein, E., & Wei, S. J. (1997). Regional trading
blocs in the world economic system. Peterson Institute.
Ghazi Tayeb, Msadfa Yassine, Potentiel du commerce
exterieur entre le Maroc et ses partenaires africains :
Application d’un modèle de gravité, Equilibres externes,
competitivite et processus de transformation structurelle
de l’economie Marocaine.Etude réalisée par OCP Policy
center et le laboratorie d’économie appliquée, de
l’Université Mohamed V de Agdal (Maroc).
Ghosh and Yamarik (2004). Are regional trading
arrangements trade creating? An application of extreme
bounds analysis. The University of Akron (Akron) and
Tufts University (Medford).
Helpman, E. & P. Krugman (1985). Market structure and
foreign trade: Increasing returns. Imperfect Competition
and the International Economy. Cambridge, MA: MIT
Press.
Karima Ben Slimane, Mohamed Ayadi et Med Salah Rejeb
(2007), Estimations du potentiel de commerce dans la
zone méditerranéenne en présence d’accords de
commerce: Approches par l’économétrie Spatiale
(Version Préliminaire).
Krugman, P. (1980). Scale economies, product
differentiation, and the pattern of trade. The American
Economic Review , n° 70.
LABRAR Sara, TABIT Safae, Creation et detournement du
commerce sous les accords de libre-echange signes par le
Maroc : les enseignements d’un modele de gravite en
donnees de Panel.
Linnemann, H. (1966). An econometric study of international
trade flows. Dissertation. Netherlands School of
Economics.
Raouf, R. & Ghoufrane, A. (2015). Trade potentiel between
morocco and Senegal: An evaluation unsing an
augmented gravity model. Etude conjointe realisee par la
Chaire de l’OMC de l’Universite Mohammed V-Souissi
(Maroc) and la Chaire de l’OMC del’Universite Sheikh
Anta-Diop (Senegal).
William GREENE, Econométrie, 7eme édition, Edition
francophone dirigé par Dodier SCHLACTHER.
(2020) The Mondiale Bank website. [Online]. Available:
https://donnees.banquemondiale.org/
(2020) The CNUCED website. [Online]. Available:
https://investmentpolicy.unctad.org/international-
investment-agreements/advanced-search
(2020) The CNUCED website. [Online]. Available:
https://unctadstat.unctad.org/wds/ReportFolders/reportF
olders.aspx?sCS_ChosenLang=fr
APPENDIX
Annexe 1: Code and name of the countries of the 2 samples.
FTAs Africa
Country Name
Country
Code
Country
Code Country Name
United Arab
Emirates ARE AGO Angola
Austria AUT BDI Burundi
Belgium BEL BEN Benin
Bulgaria BGR BFA Burkina Faso
Bahrain BHR CAF African Republic
Cyprus CYP CIV Côte d'Ivoire
Czech Republic CZE CMR Cameroon
Denmark DNK COD
Congo, Democratic
Republic of the
Algeria DZA COG Congo, Republic of the
Egypt, Arab
Republic of EGY COM Comoros
Spain ESP CPV Cabo Verde
Estonia EST DZA Algeria
Finland FIN EGY Egypt, Arab Republic of
France FRA ETH Ethiopia
United Kingdom GBR GAB Gabon
Greece GRC GHA Ghana
Croatia HRV GIN Guinea
Hungary HUN GMB Gambia
Ireland IRL GNB Guinea-Bissau
Iraq IRQ GNQ Equatorial Guinea
Italy ITA KEN Kenya
Jordan JOR LBR Liberia
Kuwait KWT LBY Libya
Lebanon LBN MDG Madagascar
Libya LBY MLI Mali
Lithuania LTU MOZ Mozambique
Luxembourg LUX MRT Mauritania
Latvia LVA MWI Malawi
Malta MLT NAM Namibia
Netherlands NLD NER Niger
Oman OMN NGA Nigeria
Poland POL RWA Rwanda
Portugal PRT SEN Senegal
Qatar QAT SLE Sierra Leone
Romania ROU SWZ Eswatini
Russian Federation RUS SYC Seychelles
Saudi Arabia SAU TCD Chad
Slovenia SVN TGO Togo
Sweden SWE TUN Tunisia
Tunisia TUN TZA Tanzania
Turkey TUR UGA Uganda
USA USA ZAF South Africa
Allemagne DEU ZMB Zambia
ZWE Zimbabwe
FEMIB 2021 - 3rd International Conference on Finance, Economics, Management and IT Business
88
