
Characterization of Network Management Traffic in OpenStack
based on Virtual Machine State Changes
Adnei W. Donatti
1 a
, Charles C. Miers
1 b
, Guilherme P. Koslovski
1 c
, Maur
´
ıcio A. Pillon
1 d
and Tereza C. M. B. Carvalho
2 e
1
Graduate Program in Applied Computing (PPGCA), Santa Catarina State University (UDESC), Brazil
2
Laboratory of Sustainability in ICT, University of S
˜
ao Paulo (USP), Brazil
Keywords:
Characterization, Cloud Computing, Network Traffic, OpenStack.
Abstract:
OpenStack is a popular and versatile solution for creating IaaS clouds. OpenStack has several private cloud
issues implementations regarding its network infrastructure with which organizations are not always familiar.
In this context, this work characterizes the administrative network traffic of OpenStack clouds. Administrative
traffic has a separate network, which can affect the performance of the cloud as a whole. We set up an induced
lifecycle for virtual machines (VMs) and measured network traffic and Application Programming Interface
(API) calls for each task with different operating system (OS) images. Moreover, we also provide an analysis
and characterization of the measured network traffic in the management security domain of OpenStack, as
well as verify the possibility of using a linear regression model for predicting the traffic volume produced for
each task.
1 INTRODUCTION
OpenStack (https://www.openstack.org) is one of the
most popular private and public IaaS cloud solutions.
OpenStack allows administrators to customize their
network configuration and induces the networks of
the cloud should be divided into three security do-
mains: public, guest, and management (OpenStack,
2019b). This configuration aims to guarantee basic
traffic isolation and security along with the cloud net-
work. Moreover, traffic isolation is necessary for pre-
venting cloud administrative operations from affect-
ing the user’s network performance and degrading the
performance of hosted applications.
The network infrastructure in a data center is es-
sential for satisfactory performance (Maswood and
Medhi, 2017). If the network is slow, some cloud-
hosted service may be slow too (OpenStack, ). Cloud
administrators need to plan this infrastructure cor-
rectly to avoid performance problems / bottlenecks.
OpenStack allows the customization of the service
a
https://orcid.org/0000-0002-4085-9640
b
https://orcid.org/0000-0002-1976-0478
c
https://orcid.org/0000-0003-4936-1619
d
https://orcid.org/0000-0001-7634-6823
e
https://orcid.org/0000-0002-0821-0614
module distribution within the data center. The
servers and all service module can be placed fol-
lowing the administrator’s objective (e.g., high avail-
ability, consolidation, and load balancing). In this
context, we discuss how common VM management
tasks may impact the administrative network of an
OpenStack-based cloud. In this sense, a network traf-
fic analysis and characterization are performed. We
share some of the fundamental concepts of (Donatti.
et al., 2020), but we expressively deepened the discus-
sion on traffic characterization with 8 more operating
systems, different flavors, and using a completely new
monitoring tool developed by us.
The research gap here addressed is about the lack
of information regarding how user-generated tasks
(e.g., creating an instance of VM) may impact on
the most internal network domain of OpenStack.
The main contributions of the present paper are: (i)
the characterization of administrative network traffic
based on user’s actions (VM states changes); (ii) ex-
perimental results considering multiple OS images;
and (iii) linear regression to support the estimation of
traffic useful for bandwidth management.
This work is organized as follows. Section 2
defines the network-related concepts of OpenStack
clouds, and Section 3 discusses the related work. Sec-
tion 4 presents the characterization method, while
232
Donatti, A., Miers, C., Koslovski, G., Pillon, M. and Carvalho, T.
Characterization of Network Management Traffic in OpenStack based on Virtual Machine State Changes.
DOI: 10.5220/0010447102320239
In Proceedings of the 11th International Conference on Cloud Computing and Services Science (CLOSER 2021), pages 232-239
ISBN: 978-989-758-510-4
Copyright
c
2021 by SCITEPRESS – Science and Technology Publications, Lda. All rights reserved

Section 5 details the testbed, experimentation pro-
cesses, and results. Section 6 discusses the analysis,
and Section 7 considerations / future directions.
2 OpenStack INFRASTRUCTURE
OpenStack works as a cloud operating system for
a large pool of computational resources (Open-
Stack, 2019d), controlling all data center servers.
Inter-service communication is commonly performed
through a messaging queue service, but REST re-
quests can also be executed. The messaging queue
services implement the Advanced Message Queu-
ing Protocol (AMQP), usually a RabbitMQ solu-
tion (OpenStack, 2020). It is worthwhile to high-
light, the messaging queue service is fundamental for
OpenStack even though there is no specific module
for these services.
The data center (DC) network design and con-
figuration for OpenStack clouds may change accord-
ing to the demand of the cloud administrator. Al-
though there are several ways to configure a DC net-
work for OpenStack, there are a few common points,
which must be considered. OpenStack documenta-
tion states the division of the network traffic into se-
curity domains: public, guest, and management (Fig-
ure 1)(OpenStack, 2019a).
Network Node
Cloud
Controller
Node
neutron-server
SQLdb
nova-scheduler
keystone
AMPQ
nova-api
Dashboard
HorizonAPI
Internet
External
Guest
Management
neutron-*-plugin-agent
neutron-L3-agent
neutron-DHCP-agent
neutron-metadata-agent
Network Node
neutron-*-plugin-agent
neutron-L3-agent
neutron-DHCP-agent
neutron-metadata-agent
Network Node
neutron-*-plugin-agent
neutron-L3-agent
neutron-DHCP-agent
neutron-metadata-agent
SDN Service
Node
Compute Node
nova-compute
neutron-plugin-agent
Project Network
PNET1
VM1
VM2
PNET2
VM3
VM4
Compute Node
nova-compute
neutron-plugin-agent
Project Network
PNET1
VM1
VM2
PNET2
VM3
VM4
Compute Node
nova-compute
neutron-plugin-agent
Project Network
PNET1*
VM1
VM2
PNET2*
VM3
VM4
* PNET1 = Project Network 1
* PNET2 = Project Network 2
Figure 1: Standard OpenStack networking setup (Donatti.
et al., 2020).
The Public Domain is formed by the API and External
networks. The External network provides Internet ac-
cess to VMs, while the API network is used to access
OpenStack APIs. The Guest Domain network is basi-
cally the only network in the Guest Security Domain
used by VM communication within the cloud deploy-
ment; and the Management Domain is the most in-
ternal security domain reachable only within the data
center. The Management Domain is composed by
the Management network, but may also includes the
Database network. OpenStack components commu-
nication as well as the access to VM images and vol-
umes, for example, are held over the Management Se-
curity Domain.
3 RELATED WORK
The cloud infrastructure analysis is often seen from
the user’s perspective (Aishwarya. K and Sankar,
2015; Shete and Dongre, 2017; Chaudhary et al.,
2018; Alenezi et al., 2019), relinquishing the internal
operations and behavior of the cloud provider. There
is a lack of information regarding how user generated
tasks (e.g., VM launch) may impact the behavior of
the management network (Donatti. et al., 2020). Be-
sides, cloud performance can be evaluated by analyz-
ing its behavior while its usage (Bruneo, 2014).
This paper offers the use of an analysis and char-
acterization approach for the understanding of the net-
work traffic into the provider’s management network
regarding consumer submitted tasks in VMs (e.g., cre-
ating, stopping, shelving instances of VMs). This net-
work traffic understanding helps cloud administrators
to better design all the cloud architecture elements
(e.g., network topology, bandwidth). In this sense, we
defined five criteria which are used to compare this
work to the other works in this area (Table 1).
Table 1: Related work comparison.
Criteria
(Sankari et al.,
2015)
(Flittner
and
Bauer,
2017)
(Gustamas
and
Shidik,
2017)
(Venzano
and
Michiardi,
2013)
(Sciammarella
et al., 2016)
(Donatti. et al., 2020)
Collect traffic on the
OpenStack cloud man-
agement network
Partially. Focus on
analyzing the SDN
traffic of DCs
No Yes No Yes Yes
Classify the network
traffic regarding the state
changes of VMs
No No No No
Partially. Only VM
creation and termi-
nation
Yes
Analyze the collected
traffic for identify-
ing which service the
packets are related
No No No No No
Partially. Significant
”MISC” traffic and
RabbitMQ traffic was
still not characterized
Store the characterized
traffic into a database
N.I. N.I. No N.I. N.I. Yes
Identify the timing in
which packet was col-
lected (timestamp)
Yes N.I. No N.I. Yes Yes
4 CHARACTERIZATION
METHODOLOGY
Traffic analysis and characterization are both ap-
proaches, which can be used to understand and solve
performance issues in computer networks (Dainotti
et al., 2006), being generally composed by two steps:
(i) measurement: the collection of data being trans-
mitted over the network; and (ii) traffic analysis: real-
ized to identify/classify relevant characteristics. The
traffic measurement can employ tools to capture data
traveling across the network (e.g., TCPdump). De-
pending on how measurement is performed, it can
be classified as (Williamson, 2001): Active (network
traffic creation by the monitoring system, inducing
specific situations), and Passive (capture only exist-
ing network traffic).
Among the classification techniques (port-based,
statistical, pattern matching, and protocol decoding)
commonly used to classify internet traffic (Dainotti
Characterization of Network Management Traffic in OpenStack based on Virtual Machine State Changes
233

et al., 2012; Finsterbusch et al., 2014), a port-based
approach fits well when characterizing the Open-
Stack management network. All the services run-
ning in this context are supposed to use well defined
ports, e.g., Nova API (compute services) uses port
TCP/8774. However, when deploying a naive port-
based approach, the traffic generated by inter-services
communication is masked as RabbitMQ network traf-
fic, since it uses RabbitMQ’s port (TCP/5672) and
not the application port itself. For improving the net-
work traffic characterization, we adopted a different
strategy to characterize the packets. A reviewed port-
based approach is used, we also run lsof GNU/Linux
utility filtering the RabbitMQ’s port. This approach
allows to identify which process is listening to Rab-
bitMQ during the network traffic collection. More-
over, we adopted an active measurement of the con-
sumer operations on a VM instance. Since we found
no information to serve as a baseline for operations
on VM instances, we chose the Active approach and
defined the sequence of operations, called here as in-
duced VM lifecycle. Each task/operation the user per-
forms to a VM may cause change in its state, e.g.,
when the user shutoffs a VM, the operation here is
STOP and the VM will go to the STOPPED state as
result.
The VM status cannot be measured at once, as an
absolute representation of the VM. For understand-
ing the status of a VM, OpenStack has three different
types of states for VMs (Wiki, 2014). The combina-
tion of these states provides a more precise informa-
tion about the VM current status: TASK STATE pro-
vides information about ongoing tasks, e.g., when an
user creates a VM, then the ongoing task is CREAT-
ING. VM STATE means the current stable (not tran-
sition) state, e.g., if a VM is created then it achieves
the ACTIVE state. POWER STATE reflects a snap-
shot of the hypervisor state and reveals if the ma-
chine is still running and if there was a failure (e.g.,
RUNNING, SHUTDOWN). In this article, when the
term VM state is used it refers to VM STATE. Open-
Stack has a total of 12 possible VM states (Open-
Stack, 2018b). However, by analyzing the operations
of users on our private OpenStack cloud, we find out
the vast majority of our users typically have their VMs
in only 6 states (Figure 2).
INITIALIZED
ACTIVE
STOPPED
SUSPENDED
SHELVEDSHELVED_OFFLOADED
1.CREATE()
2.SUSPEND()
3.RESUME()
4.STOP()
5.SHELVE()
Figure 2: Induced VM lifecycle.
In Figure 2, when the VM is being created (operation
CREATE is being performed), the VM will transition
from its initial state, INITIALIZED, to an ACTIVE
state. Which means the VM is ready to be used. Once
the VM is ACTIVE, we then suspend its operation,
by performing SUSPEND procedure, which causes
the VM to hit the SUSPENDED state. Next, the
VM is reactivated by the RESUME operation, then
it is stopped and shelved (STOP and SHELVE op-
erations). The final state, SHELVED OFFLOADED
is hit when the OS image is no longer used by the
hypervisor anymore. Therefore, this image may be
discarded from the compute node. In our tests, we
perform the induced life cycle 30 times each OS im-
age. We collected traffic to identify the amount of
data transmitted, the elapsed operation time, and the
number of API calls for each state change enumerated
in Figure 2. The collected data is stored in a database
for further analysis.
5 TESTBED, EXPERIMENTS,
AND RESULTS
CloudLab was chosen as our testbed for deploying
OpenStack, Stein release. CloudLab provides re-
searchers with 256GB RAM and two 2.4Ghz proces-
sors servers. The default OpenStack m1.small flavor,
composed of 1 vCPU, 2GB RAM and 20GB storage,
was adopted in all the experiments. All instances were
interconnected by a 1Gb/s network link. A proof-
of-concept cloud topology was prepared as described
by Figure 3. The two nodes topology is enough to
configure the networks (as stated in Section 2) and
to identify the communication between nodes. In
fact, we have several modules/services running on the
controller node (here is also relevant network traffic
into loopback interface), in which our monitoring tool
runs, too.
Controller Node
SQLDB AMQP
External Services
KEYSTONE HORIZON
NEUTRON GLANCE
NOVA-API
NOVA-
SCHEDULER
OpenStack Services
Network Interface Card
VLAN1 - Management
VLAN2 - Guest / Public
VLAN1 - Management
VLAN2 - Guest / Public
Compute Node
NEUTRON-PLUGIN-AGENT
NOVA-COMPUTE
Network Interface Card
OpenStack Services
OpenStack Services
AMQP
External Services
Figure 3: CloudLab testbed setup.
We created the OpenStack Network Monitor (ONM)
6
6
Developed in Python 3.6, using TCPdump for packet
CLOSER 2021 - 11th International Conference on Cloud Computing and Services Science
234

tool organized into two main functions: (i) induced
lifecycle - packet capture; and (ii) traffic analysis.
ONM was customized to automate the experiments,
being possible to specify VM parameters (e.g., image,
flavor) and VM operations sequence (operations enu-
merated in Figure 2). It also supports working with
VM image cache, which was not used in the experi-
ments described in this article.
The induced lifecycle (Figure 2) is executed on 10
different OS images for instances of VMs. FreeBSD
version 12.0, 454 MB image; GNU/Linux Fedora
Cloud version 31-1.9, 319 MB image; GNU/Linux
Fedora Cloud version 32-1.6, 289 MB image;
GNU/Linux Ubuntu Server version 18.04 LTS (Bionic
Beaver), 329 MB image; MS-Windows Server version
2012 R2, 6150 MB image; GNU/Linux CirrOS ver-
sion 0.4.0, 15 MB image; GNU/Linux CentOS ver-
sion 7, 898 MB image; GNU/Linux CentOS version
7, 1300 MB image; GNU/Linux Debian version 10,
550 MB image; and GNU/Linux Ubuntu Server ver-
sion 20.04 LTS (Focal Fossa), 519 MB image. All im-
ages are QCOW2-based, except MS-Windows Server
using QCOW2.GZ.
Table 2 shows a summary of data collected for
all OSs. Each operation (CREATE, SUSPEND, RE-
SUME, STOP, and SHELVE) was executed 30 times
for each OS image of VM, and results are reported
using the metrics: (i): Elapsed time of the operation
execution; (ii): Total network traffic generated by the
operation; and (iii): Total number of API calls identi-
fied on each operation.
All operations on the state of the VM have ac-
tions on the hypervisor, as well as on the Controller
Node. However, an operation initiated at the Con-
troller Node does not imply heavy network traffic. For
example, a SUSPEND operation just removes the VM
out of memory and releases the vCPUs, but the image
file remains on the Compute Node. Thus, the results
of some operations may vary depending on the sys-
tem call implementation and we do not intent to eval-
uate those differences. The data collected shows that
CREATE and SHELVE operations have the greatest
impact on the volume of network traffic. This hap-
pens because there is a need to transfer the image
from Glance service, inside the Controller Node (Fig-
ure 3), to the respective Compute Node at the time
of CREATE. Likewise, in SHELVE the updated im-
age in Compute Node needs to be transferred back to
Glance service. Table 2 reveals the number total traf-
fic to CREATE and SHELVE are not largely spread,
between 0.02% to Windows Server and 2.17% to Cir-
rOS, among the 30 observations. The rest of the VM’s
collection, and employing OpenStack Python APIs: github.
com/Adnei/openstack monitor
Table 2: Data summary of the analyzed metrics.
Image Operation Total Traffic - MB (mean +/- sd) Total API Calls (mean +/- sd) Execution Time - seconds (mean +/- sd)
Ubuntu Bionic Beaver CREATE 358.759 +/- 1.988 67 +/- 2.801 25.433 +/- 1.455
Ubuntu Bionic Beaver RESUME 1.821 +/- 0.404 13 +/- 0.745 4 +/- 0
Ubuntu Bionic Beaver SHELVE 1129.658 +/- 5.195 85 +/- 10.845 37.767 +/- 1.695
Ubuntu Bionic Beaver STOP 3.291 +/- 0.874 16 +/- 2.985 9.8 +/- 0.761
Ubuntu Bionic Beaver SUSPEND 2.359 +/- 0.773 10 +/- 1.717 6 +/- 0
Centos 7 (1300 MB) CREATE 1419.955 +/- 0.709 100 +/- 2.541 48.6 +/- 1.776
Centos 7 (1300 MB) RESUME 2.007 +/- 0.215 13 +/- 0.407 4.1 +/- 0.316
Centos 7 (1300 MB) SHELVE 1424.304 +/- 0.639 108 +/- 1.442 57.2 +/- 1.229
Centos 7 (1300 MB) STOP 1.518 +/- 0.21 6 +/- 0.651 4 +/- 0
Centos 7 (1300 MB) SUSPEND 3.232 +/- 0.293 13 +/- 1.453 8.1 +/- 0.316
Centos 7 (898 MB) CREATE 876.562 +/- 0.738 79 +/- 3.886 33 +/- 1.563
Centos 7 (898 MB) RESUME 2.031 +/- 0.255 14 +/- 0.548 4 +/- 0
Centos 7 (898 MB) SHELVE 936.403 +/- 0.453 82 +/- 3.806 39.8 +/- 1.317
Centos 7 (898 MB) STOP 2.556 +/- 0.308 11 +/- 3.218 6 +/- 0
Centos 7 (898 MB) SUSPEND 2.736 +/- 0.324 11 +/- 2.535 6.3 +/- 0.675
Cirros CREATE 25.65 +/- 0.559 55 +/- 1.94 16.3 +/- 0.675
Cirros RESUME 1.998 +/- 0.198 14 +/- 2.583 4 +/- 0
Cirros SHELVE 33.749 +/- 0.271 31 +/- 2.833 7.2 +/- 0.632
Cirros STOP 22.649 +/- 0.187 96 +/- 0.675 63.2 +/- 0.422
Cirros SUSPEND 1.85 +/- 0.314 7 +/- 2.533 4 +/- 0
Debian 10 CREATE 592.787 +/- 0.676 78 +/- 2.644 32 +/- 0.667
Debian 10 RESUME 1.989 +/- 0.139 13 +/- 1.031 4 +/- 0
Debian 10 SHELVE 1539.051 +/- 0.808 119 +/- 2.062 63 +/- 1.563
Debian 10 STOP 2.339 +/- 0.509 10 +/- 3.059 5.6 +/- 0.843
Debian 10 SUSPEND 2.563 +/- 0.384 9 +/- 0.801 6 +/- 0
Fedora 31 CREATE 368.741 +/- 2.292 71 +/- 5.238 24.633 +/- 1.608
Fedora 31 RESUME 1.803 +/- 0.405 13 +/- 0.838 3.967 +/- 0.183
Fedora 31 SHELVE 993.256 +/- 3.7 73 +/- 9.138 30.033 +/- 0.669
Fedora 31 STOP 1.999 +/- 0.536 10 +/- 2.684 5.767 +/- 0.728
Fedora 31 SUSPEND 2.359 +/- 0.808 11 +/- 2.606 6 +/- 0
Fedora 32 CREATE 317.146 +/- 0.667 71 +/- 2.282 26.4 +/- 0.968
Fedora 32 RESUME 1.918 +/- 0.311 13 +/- 0.89 3.967 +/- 0.183
Fedora 32 SHELVE 853.332 +/- 0.797 83 +/- 4.452 40 +/- 1.145
Fedora 32 STOP 2.44 +/- 0.372 10 +/- 2.683 5.867 +/- 0.507
Fedora 32 SUSPEND 3.29 +/- 0.251 13 +/- 1.437 8.067 +/- 0.254
Ubuntu Focal Fossa CREATE 555.52 +/- 1.143 75 +/- 4.109 28.8 +/- 1.229
Ubuntu Focal Fossa RESUME 2.17 +/- 0.282 14 +/- 1.96 4 +/- 0
Ubuntu Focal Fossa SHELVE 1391.565 +/- 0.695 118 +/- 3.347 61.7 +/- 1.947
Ubuntu Focal Fossa STOP 4.318 +/- 0.607 17 +/- 3.161 10.2 +/- 0.632
Ubuntu Focal Fossa SUSPEND 4.317 +/- 0.6 17 +/- 3.607 10.2 +/- 0.632
FreeBSD 12 CREATE 487.157 +/- 1.812 66 +/- 4.554 23.367 +/- 1.991
FreeBSD 12 RESUME 1.675 +/- 0.51 13 +/- 1.597 4.067 +/- 0.365
FreeBSD 12 SHELVE 483.855 +/- 1.243 44 +/- 3.809 15.533 +/- 0.507
FreeBSD 12 STOP 18.031 +/- 0.567 97 +/- 2.837 62.833 +/- 0.379
FreeBSD 12 SUSPEND 1.329 +/- 0.419 7 +/- 2.139 4 +/- 0
MS Windows Server CREATE 6645.582 +/- 1.593 163 +/- 10.563 94.9 +/- 2.771
MS Windows Server RESUME 1.829 +/- 0.368 13 +/- 1.234 4 +/- 0
MS Windows Server SHELVE 6668.887 +/- 7.262 230 +/- 6.801 137.967 +/- 4.03
MS Windows Server STOP 18.084 +/- 0.463 98 +/- 2.511 62.933 +/- 0.254
MS Windows Server SUSPEND 1.24 +/- 0.433 6 +/- 1.517 4 +/- 0
state changes do not imply intensive network traffic,
only API calls and local operations in Compute Node.
For better presenting the OpenStack participation in
the operation perform, we split the metrics network
traffic volume and number of API calls by OpenStack
service (Tables 3 and 4).
The number of observed API calls may vary ac-
cording to the implementation of the induced lifecy-
cle and VM configurations, e.g., additional configura-
tions on the network would cause an increased num-
ber of Neutron-API calls. We used OpenStack Python
APIs on our experiments, but there are other ways
of performing those operations. OpenStack Connec-
tion.Compute (OpenStack, 2018a) was employed to
run VM operations (e.g., CREATE, and SUSPEND).
The results reveals the variation of API calls obtained
was between 1.3% (CentOS) and 12.75% (Ubuntu
Bionic Beaver). Although, CREATE operation of MS
Windows Server has a Standard Deviation (SD) value
a bit higher when comparing to the others SD val-
ues for all the operations and OS images. The high-
est SD value, in all operations, was caused by SUS-
PEND operation of CirrOS and MS Windows Server
summarizing 36.2% and 34.9%, respectively. Table 4
presents API calls by services. Table 2 reveals CRE-
ATE and SHELVE operations are responsible for pro-
ducing the highest amounts of traffic and those oper-
ations with longer time to finish.
Analyzing Table 3, Glance, the module which
works as the manager of the VM images, is the
responsible for most the network traffic. Also,
each CREATE operation for all OS images produces
Characterization of Network Management Traffic in OpenStack based on Virtual Machine State Changes
235

Table 3: Traffic Volume (MB) / Service (Mean +/- SD).
Operation Image Ceilometer Cinder Designate Glance Heat Keystone Magnum Manila MISC Neutron Nova RabbitMQ Sahara Trove
Ubuntu Bionic Beaver 0.022 +/- 0.004 0.008 +/- 0.007 0.105 +/- 0.012 346.61 +/- 0.01 0.073 +/- 0.087 0.14 +/- 0.016 0.012 +/- 0.019 0.007 +/- 0.007 9.552 +/- 1.605 0.345 +/- 0.159 1.11 +/- 0.194 0.249 +/- NA 0 +/- 0.001 0.011 +/- 0.017
Centos 7 (1300 MB) 0.018 +/- 0.015 0.195 +/- 0.016 1398.295 +/- 0.093 0.19 +/- 0.186 0.195 +/- 0.027 0.166 +/- 0.345 0.006 +/- 0.005 18.041 +/- 0.919 0.902 +/- 0.36 1.739 +/- 0.449 0.257 +/- NA 0.002 +/- 0.002 0.158 +/- 0.351
Centos 7 (898 MB) 0.01 +/- 0.006 0.142 +/- 0.008 860.562 +/- 0.123 0.223 +/- 0.298 0.163 +/- 0.027 0.245 +/- 0.474 0.006 +/- 0.007 13.229 +/- 1.015 0.55 +/- 0.293 1.362 +/- 0.232 0.001 +/- 0.001 0.049 +/- 0.055
Cirros 0.003 +/- 0.004 0.061 +/- 0.004 15.784 +/- 0.004 0.084 +/- 0.142 0.145 +/- 0.026 0.033 +/- 0.049 0.001 +/- 0.002 7.938 +/- 0.404 0.434 +/- 0.276 1.129 +/- 0.04
NA
0.001 +/- 0.002 0.015 +/- 0.031
Debian 10
0.022 +/- 0.001
0.01 +/- 0.007 0.137 +/- 0.018 575.644 +/- 0.005 0.362 +/- 0.095 0.146 +/- 0.023 0.033 +/- 0.047 0.004 +/- 0.004 14.482 +/- 0.537 0.481 +/- 0.164 1.366 +/- 0.357 0.305 +/- NA 0.002 +/- 0.002 0.067 +/- 0.061
Fedora 31 0.021 +/- 0 0.007 +/- 0.006 0.116 +/- 0.048 356.159 +/- 0.017 0.1 +/- 0.124 0.137 +/- 0.027 0.032 +/- 0.035 0.065 +/- 0.146 9.547 +/- 1.734 0.374 +/- 0.236 1.025 +/- 0.209 NA 0.001 +/- 0.001 0.025 +/- 0.034
Fedora 32 0.021 +/- 0.004 0.009 +/- 0.009 0.339 +/- 0.106 303.511 +/- 0.011 0.09 +/- 0.126 0.141 +/- 0.023 0.028 +/- 0.043 0.005 +/- 0.007 11.6 +/- 0.638 0.362 +/- 0.135 0.988 +/- 0.236 0.321 +/- NA 0.041 +/- 0.047
Ubuntu Focal Fossa 0.022 +/- 0.001 0.005 +/- 0.005 0.127 +/- 0.014 539.857 +/- 0.003 0.295 +/- 0.049 0.159 +/- 0.033 0.018 +/- 0.023 0.004 +/- 0.004 13.408 +/- 1.038 0.447 +/- 0.177 1.094 +/- 0.185 NA 0.081 +/- 0.066
FreeBSD 12 0.023 +/- 0.005 0.008 +/- 0.005 0.092 +/- 0.01 476.316 +/- 0.003 0.06 +/- 0.08 0.151 +/- 0.037 0.019 +/- 0.03 0.003 +/- 0.003 8.58 +/- 1.673 1.051 +/- 0.155 0.828 +/- 0.15
0.001 +/- 0.002
0.014 +/- 0.025
CREATE
MS Windows Server 0.022 +/- 0.001 0.024 +/- 0.006 0.452 +/- 0.115 6615.876 +/- 1.037 0.233 +/- 0.178 0.243 +/- 0.033 0.057 +/- 0.041 0.012 +/- 0.005 25.98 +/- 1.927 1.16 +/- 0.606 1.429 +/- 1.006
0.292 +/- NA
0.004 +/- 0.006 0.08 +/- 0.132
Ubuntu Bionic Beaver 0.001 +/- 0.002 0.024 +/- 0.009 0.025 +/- 0.055 0 +/- 0.001 0.009 +/- 0.018 0.003 +/- 0.002 1.775 +/- 0.556 0.035 +/- 0.042 0.156 +/- 0.034 0 +/- 0 0.009 +/- 0.023
Centos 7 (1300 MB)
0.009 +/- 0
0.005 +/- 0.006 0.033 +/- 0.004 0.04 +/- 0.092 0.012 +/- 0.02 0.005 +/- 0.005 0.004 +/- 0.004 2.808 +/- 0.327 0.127 +/- 0.111 0.185 +/- 0.119 0.001 +/- 0.002 0.013 +/- 0.034
Centos 7 (898 MB) 0.011 +/- 0.007 0.002 +/- 0.003 0.026 +/- 0.006
0.003 +/- 0.002
0.008 +/- 0.005 0.004 +/- 0.007 0.08 +/- 0.077 0.002 +/- 0.003 2.436 +/- 0.345 0.059 +/- 0.028 0.153 +/- 0.021 0 +/- 0 0.003 +/- 0.003
Cirros 0.009 +/- 0 0.003 +/- 0.004 0.014 +/- 0.003 0.001 +/- 0.001 0.009 +/- 0.009 0.012 +/- 0.017 0.002 +/- 0.001 0.005 +/- 0.003 1.599 +/- 0.288 0.03 +/- 0.008 0.181 +/- 0.07 NA 0.007 +/- 0.004
Debian 10 0.009 +/- 0.001 0.003 +/- 0.005 0.002 +/- 0.002 0.108 +/- 0.106 0.002 +/- NA 0.008 +/- 0.007 0 +/- 0 2.237 +/- 0.38 0.076 +/- 0.126 0.104 +/- 0.045 0.001 +/- 0.001
Fedora 31 0.001 +/- 0.003
0.021 +/- 0.002
0.001 +/- 0.001 0.03 +/- 0.053 0.012 +/- 0 0.012 +/- 0.021 0.013 +/- 0.037 1.694 +/- 0.579 0.038 +/- 0.041 0.145 +/- 0.034
0 +/- 0
0.002 +/- 0.002
Fedora 32
0.009 +/- 0
0.006 +/- 0.007 0.108 +/- 0.033 0.004 +/- 0.005 0.022 +/- 0.058 0.006 +/- 0.01 0.016 +/- 0.025 0.001 +/- 0.003 2.937 +/- 0.277 0.071 +/- 0.085 0.116 +/- 0.074 0.001 +/- 0.001 0.016 +/- 0.031
Ubuntu Focal Fossa 0.011 +/- 0.007 0.003 +/- 0.004 0.044 +/- 0.013 0.003 +/- 0.003 0.153 +/- 0.164 0.008 +/- 0.014 0.036 +/- 0.053 0.003 +/- 0.003 3.815 +/- 0.513 0.097 +/- 0.119 0.155 +/- 0.09 0.002 +/- 0.002 0.006 +/- 0.005
FreeBSD 12 0.013 +/- 0.004 0 +/- 0 0.006 +/- 0.005 0 +/- 0 0.002 +/- 0.002 0.002 +/- 0.002 1.054 +/- 0.425 0.174 +/- 0.053 0.072 +/- 0.025 0.01 +/- 0.021
SUSPEND
MS Windows Server
0.002 +/- 0.004
0.031 +/- 0.031 0.003 +/- 0.005 0.019 +/- 0.05 0.001 +/- 0.003 0.016 +/- 0.025 1.03 +/- 0.422 0.085 +/- 0.05 0.064 +/- 0.015
0 +/- 0
0.004 +/- 0.008
Ubuntu Bionic Beaver 0.001 +/- 0.004 0.014 +/- 0.005 0.036 +/- 0.065 0 +/- 0 0.011 +/- 0.021
0.002 +/- 0.003
1.46 +/- 0.395 0.041 +/- 0.057 0.2 +/- 0.041 0.001 +/- 0.002 0.01 +/- 0.023
Centos 7 (1300 MB)
0.009 +/- 0
0.009 +/- 0.01 0.017 +/- 0.006
0.001 +/- 0.002
0.088 +/- 0.122 NA 0.044 +/- 0.079 0 +/- 0 1.626 +/- 0.22 0.056 +/- 0.021 0.207 +/- 0.055 0.004 +/- 0 0.097 +/- 0.125
Centos 7 (898 MB) 0.003 +/- 0.005 0 +/- 0 0.014 +/- 0.022 0.001 +/- NA 0.093 +/- 0.106 0.002 +/- 0.003 1.624 +/- 0.238 0.093 +/- 0.108 0.241 +/- 0.11 0 +/- 0 0.004 +/- 0.005
Cirros
0.009 +/- 0.001
0 +/- 0
0.015 +/- 0.004
0.001 +/- 0.001 0.009 +/- 0.012 0.032 +/- 0.046 0.001 +/- 0.002 1.733 +/- 0.189 0.032 +/- 0.017 0.194 +/- 0.019 0 +/- NA 0.004 +/- 0.003
Debian 10 0.004 +/- 0.004 0.016 +/- 0.005 0.005 +/- 0.009 0.093 +/- 0.003
NA
0.039 +/- 0.06 0.006 +/- 0.002 1.671 +/- 0.147 0.052 +/- 0.025 0.128 +/- 0.046 0.001 +/- 0.002 0.008 +/- 0.006
Fedora 31 0.013 +/- 0.003 0 +/- 0 0.023 +/- 0.027 0.006 +/- 0.007 0.011 +/- 0.02 0.002 +/- 0.003 1.383 +/- 0.397 0.051 +/- 0.047 0.189 +/- 0.033 0.001 +/- 0.001 0.001 +/- 0
Fedora 32
0.003 +/- 0.004
0.104 +/- 0.031 0.002 +/- 0.004 0.008 +/- 0.026 0.012 +/- 0.011 0.012 +/- 0.026 0.003 +/- 0.003 1.646 +/- 0.287 0.033 +/- 0.018 0.106 +/- 0.037 0.001 +/- 0.002 0.004 +/- 0.005
Ubuntu Focal Fossa 0.002 +/- 0.003 0.013 +/- 0.005 0.002 +/- 0.002 0.1 +/- 0.013 0.037 +/- NA 0.03 +/- 0.049 0 +/- NA 1.863 +/- 0.309 0.035 +/- 0.017 0.127 +/- 0.087 0 +/- NA 0.003 +/- 0.003
FreeBSD 12 0.002 +/- 0.004 0.014 +/- 0.005 0 +/- 0 0.008 +/- 0.007 0.02 +/- 0.033 0.004 +/- 0.003 0.001 +/- 0.002 1.345 +/- 0.505 0.205 +/- 0.05 0.094 +/- 0.029 0.001 +/- 0.002 0.004 +/- 0.006
RESUME
MS Windows Server 0.002 +/- 0.003 0.033 +/- 0.038 0.002 +/- 0.004 0.009 +/- 0.01 0.013 +/- 0.021 0.013 +/- 0.024 0 +/- 0 1.545 +/- 0.345 0.123 +/- 0.067 0.1 +/- 0.033 0.002 +/- 0.002 0.013 +/- 0.016
Ubuntu Bionic Beaver
0.009 +/- 0
0.003 +/- 0.004 0.039 +/- 0.004 0.002 +/- 0.002 0.013 +/- 0.011 0.016 +/- 0.018 0.006 +/- 0.014 0.004 +/- 0.003 2.823 +/- 0.91 0.053 +/- 0.02 0.198 +/- 0.068 0.001 +/- 0.001 0.014 +/- 0.026
Centos 7 (1300 MB) 0.009 +/- 0.001 0.001 +/- 0.002 0.016 +/- 0.008 0.001 +/- 0.001 0.048 +/- 0.107 0.021 +/- 0.04 0.001 +/- 0.002 1.253 +/- 0.229 0.046 +/- 0.046 0.141 +/- 0.059 0.007 +/- 0.01
Centos 7 (898 MB) 0.009 +/- 0 0.004 +/- 0.004 0.024 +/- 0.003 0.002 +/- 0.002 0.008 +/- 0.005
NA
0.072 +/- 0.107 0.004 +/- 0.003 2.195 +/- 0.306 0.072 +/- 0.129 0.192 +/- 0.09
0 +/- 0
0.002 +/- 0.002
Cirros 0.011 +/- 0 0.014 +/- 0.005 0.247 +/- 0.007 0.02 +/- 0.003 0.16 +/- 0.144 0.013 +/- 0.001 0.085 +/- 0.044 0.007 +/- 0.004 20.769 +/- 0.301 0.451 +/- 0.166 0.795 +/- 0.105 0.004 +/- 0.001 0.08 +/- 0.05
Debian 10 0.011 +/- 0.007 0 +/- 0 0.028 +/- 0.022 0.002 +/- 0.002 0.067 +/- 0.02 0.009 +/- 0.014 0.002 +/- 0.001 0.003 +/- 0.004 2.086 +/- 0.49 0.027 +/- 0.012 0.1 +/- 0.083 0 +/- 0 0.025 +/- 0.048
Fedora 31 0.01 +/- 0.004 0.001 +/- 0.004 0.021 +/- 0.005 0.001 +/- 0.001 0.042 +/- 0.068 0.009 +/- 0.009 0.009 +/- 0.02 1.607 +/- 0.548 0.039 +/- 0.043 0.138 +/- 0.047 0.001 +/- 0.001 0.015 +/- 0.027
Fedora 32 0.009 +/- 0 0.004 +/- 0.005 0.085 +/- 0.027 0.002 +/- 0.002 0.038 +/- 0.097 0.007 +/- 0.007 0.018 +/- 0.034 2.161 +/- 0.367 0.032 +/- 0.012 0.093 +/- 0.051 0.002 +/- 0.002 0.015 +/- 0.034
Ubuntu Focal Fossa 0.011 +/- 0.007 0.004 +/- 0.004 0.046 +/- 0.015 0.001 +/- 0.002 0.074 +/- 0.035 0.009 +/- 0.014 0.008 +/- 0.006
0.001 +/- 0.002
3.94 +/- 0.574 0.124 +/- 0.144 0.098 +/- 0.036 0 +/- 0 0.013 +/- 0.024
FreeBSD 12 0.013 +/- 0.007 0.014 +/- 0.005 0.258 +/- 0.009 0.004 +/- 0.004 0.1 +/- 0.099 0.018 +/- 0.023 0.029 +/- 0.034 0.007 +/- 0.003 15.12 +/- 0.663 1.939 +/- 0.182 0.482 +/- 0.205 0.001 +/- 0.001 0.051 +/- 0.04
STOP
MS Windows Server 0.015 +/- 0.009 0.016 +/- 0.006 0.293 +/- 0.067 0.018 +/- 0.009 0.162 +/- 0.126 0.024 +/- 0.018 0.034 +/- 0.035 0.009 +/- 0.004 16.308 +/- 0.771 0.664 +/- 0.426 0.486 +/- 0.123 0.054 +/- 0.096
Ubuntu Bionic Beaver 0.033 +/- 0.002 0.01 +/- 0.006 0.151 +/- 0.011 1113.557 +/- 0.088 0.105 +/- 0.099 0.072 +/- 0.02 0.024 +/- 0.032 0.01 +/- 0.012 11.663 +/- 1.583 0.307 +/- 0.141 0.824 +/- 0.114 0.025 +/- 0.031
Centos 7 (1300 MB) 0.035 +/- 0.001 0.029 +/- 0.028 0.233 +/- 0.014 1401.211 +/- 0.56 0.26 +/- 0.171 0.067 +/- 0.01 0.118 +/- 0.105 0.008 +/- 0.004 20.03 +/- 0.874 0.79 +/- 0.334 1.423 +/- 0.537 0.098 +/- 0.151
Centos 7 (898 MB) 0.034 +/- 0.001 0.013 +/- 0.013 0.169 +/- 0.021 919.581 +/- 0.527 0.179 +/- 0.134 0.089 +/- 0.014 0.077 +/- 0.075 0.006 +/- 0.003 14.844 +/- 0.441 0.462 +/- 0.242 0.898 +/- 0.133 0.049 +/- 0.055
Cirros 0.033 +/- 0.001 0.004 +/- 0.005 0.026 +/- 0.004 28.721 +/- 0.027 0.138 +/- 0.14 0.056 +/- 0.008 0.003 +/- 0.001 0.001 +/- 0.002 4.087 +/- 0.345 0.118 +/- 0.082 0.587 +/- 0.052
0.002 +/- 0.002
0.007 +/- 0.008
Debian 10 0.033 +/- 0.002 0.018 +/- 0.005 0.262 +/- 0.021 1512.123 +/- 0.106 0.61 +/- 0.139 0.062 +/- 0.011 0.093 +/- 0.052 0.009 +/- 0.004 24.048 +/- 0.655 0.728 +/- 0.214 0.971 +/- 0.221
NA
0.003 +/- 0.002 0.09 +/- 0.054
Fedora 31 0.033 +/- 0.001 0.01 +/- 0.008 0.148 +/- 0.06 979.696 +/- 0.071 0.116 +/- 0.113 0.064 +/- 0.011 0.014 +/- 0.023 0.028 +/- 0.057 9.809 +/- 1.647 0.269 +/- 0.143 0.654 +/- 0.1 0.273 +/- NA 0.001 +/- 0.002 0.014 +/- 0.023
Fedora 32 0.032 +/- 0.006 0.015 +/- 0.013 0.383 +/- 0.145 836.53 +/- 0.118 0.174 +/- 0.161 0.07 +/- 0.019 0.066 +/- 0.053 0.006 +/- 0.004 14.959 +/- 0.759 0.339 +/- 0.159 0.704 +/- 0.285 0.264 +/- NA 0.046 +/- 0.049
Ubuntu Focal Fossa 0.033 +/- 0.002 0.019 +/- 0.008 0.263 +/- 0.012 1365.056 +/- 0.087 0.428 +/- 0.126 0.081 +/- 0.018 0.086 +/- 0.061 0.007 +/- 0.004 23.964 +/- 0.848 0.697 +/- 0.108 0.799 +/- 0.25
0.002 +/- 0.002
0.13 +/- 0.056
FreeBSD 12 0.034 +/- 0.001 0.003 +/- 0.004 0.062 +/- 0.005 476.908 +/- 0.084 0.068 +/- 0.093 0.058 +/- 0.012 0.018 +/- 0.03 0.002 +/- 0.003 5.598 +/- 1.214 0.669 +/- 0.124 0.43 +/- 0.122 0.001 +/- 0.001 0.007 +/- 0.015
SHELVE
MS Windows Server 0.035 +/- 0.001 0.032 +/- 0.004 0.659 +/- 0.167 6406.869 +/- 1208.735 0.319 +/- 0.199 0.064 +/- 0.016 0.09 +/- 0.035 0.018 +/- 0.004 37.046 +/- 1.885 1.54 +/- 0.951 222.094 +/- 1209.865
NA
0.004 +/- 0.001 0.116 +/- 0.197
Table 4: API Calls / Service (Mean +/- SD).
Operation Image Glance Keystone Neutron Nova
Ubuntu Bionic Beaver 9 +/- 1.416 41 +/- 1.589 14 +/- 0.89
Centos 7 (1300 MB) 13 +/- 1.252 60 +/- 1.494 24 +/- 0.816
Centos 7 (898 MB) 11 +/- 1.636 47 +/- 2.066 18 +/- 1.252
Cirros 10 +/- 1.265 32 +/- 0.85 10 +/- 0.675
Debian 10 10 +/- 1.033 47 +/- 2.348 18 +/- 0.699
Fedora 31 10 +/- 1.655 41 +/- 1.691 14 +/- 0.986
Fedora 32 10 +/- 1.042 42 +/- 1.524 15 +/- 0.855
Ubuntu Focal Fossa 13 +/- 2.003 43 +/- 2.394 16 +/- 0.738
FreeBSD 12 11 +/- 2.074 39 +/- 2.313 13 +/- 0.95
CREATE
MS Windows Server
4 +/- 0
14 +/- 2.141 100 +/- 10.785 47 +/- 1.502
Ubuntu Bionic Beaver 1 +/- NA 6 +/- 1.143 4 +/- 0.484
Centos 7 (1300 MB) 2 +/- 0.707 8 +/- 0.568 5 +/- 0.422
Centos 7 (898 MB) 1 +/- NA 8 +/- 2.685 4 +/- 0.316
Cirros 2 +/- NA 5 +/- 2.406 3 +/- 0.316
Debian 10 1 +/- NA 6 +/- 0.699 3 +/- 0
Fedora 31 1 +/- 0 6 +/- 1.424 4 +/- 0.484
Fedora 32 2 +/- 0.707 8 +/- 1.39 5 +/- 0.379
Ubuntu Focal Fossa 2 +/- NA 12 +/- 2.908 6 +/- 0.675
FreeBSD 12 NA 5 +/- 2.132 3 +/- 0.183
SUSPEND
MS Windows Server 1 +/- 0 4 +/- 1.455 3 +/- 0.254
Ubuntu Bionic Beaver 1 +/- NA 11 +/- 0.774
Centos 7 (1300 MB) NA 11 +/- 0.422
2 +/- 0
Centos 7 (898 MB) 1 +/- NA 11 +/- 0.316 3 +/- 0.316
Cirros 12 +/- 2.677 2 +/- 0
Debian 10
NA
11 +/- 0.85 3 +/- 0.422
Fedora 31 1 +/- 0 11 +/- 0.679
Fedora 32 2 +/- 0.548 11 +/- 0.466
3 +/- 0.183
Ubuntu Focal Fossa 3 +/- NA 11 +/- 0.816 3 +/- 0.422
FreeBSD 12 2 +/- NA 11 +/- 1.57 3 +/- 0.254
RESUME
MS Windows Server 2 +/- 0.707 11 +/- 0.724 3 +/- 0.346
Ubuntu Bionic Beaver 2 +/- 0.535 11 +/- 2.614 6 +/- 0.607
Centos 7 (1300 MB) 4 +/- 0.632 3 +/- 0.316
Centos 7 (898 MB)
NA
8 +/- 3.373 4 +/- 0.316
Cirros 2 +/- 0.447 65 +/- 0.422 30 +/- 0
Debian 10 2 +/- 0.707 6 +/- 2.53 3 +/- 0.667
Fedora 31 7 +/- 2.811 3 +/- 0.403
Fedora 32
1 +/- 0
7 +/- 2.479 3 +/- 0.32
Ubuntu Focal Fossa 2 +/- 0.707 12 +/- 2.983 6 +/- 0.483
FreeBSD 12 2 +/- 1.166 66 +/- 1.213 31 +/- 0.669
STOP
MS Windows Server
NA
2 +/- 1.029 66 +/- 1.474 31 +/- 0.583
Ubuntu Bionic Beaver 10 +/- 0.183 6 +/- 1.383 46 +/- 4.071 19 +/- 1.159
Centos 7 (1300 MB) 6 +/- 0.85 66 +/- 0.789 27 +/- 0.471
Centos 7 (898 MB) 8 +/- 1.269 47 +/- 3.498 20 +/- 0.919
Cirros 5 +/- 0.516 14 +/- 2.547 4 +/- 0.422
Debian 10
9 +/- 0
6 +/- 0.675 74 +/- 1.43 31 +/- 0.738
Fedora 31 6 +/- 1.184 38 +/- 3.845 15 +/- 0.615
Fedora 32
10 +/- 0.183
6 +/- 1.599 49 +/- 3.83 20 +/- 0.964
Ubuntu Focal Fossa 7 +/- 1.524 72 +/- 2.716 31 +/- 0.738
FreeBSD 12 5 +/- 0.968 23 +/- 3.358 8 +/- 0.479
SHELVE
MS Windows Server
9 +/- 0
6 +/- 0.997 150 +/- 4.938 66 +/- 2.069
Glance’s network traffic around the image size. For
example, MS-Windows Server image size 6150 MB
and Glance network traffic volume for MS-Windows
Server CREATE is around to 6615.876 MB, which
confirms the transmission of the image through the
network. Therefore, we can assume the total traf-
fic produced by the operation minus the image size
is the amount of administrative network traffic. Pro-
ceeding with MS-Windows Server CREATE exam-
ple, 6645.582 MB (Table 2) - 6150 MB (image size)
= 495.582 MB of administrative network traffic. The
same logic from CREATE operation may apply to
SHELVE, but instead of the VM image being trans-
ferred through network there is a VM with the content
modified during execution. The remaining operations
do not produce massive network traffic and run on few
seconds. Figures 4 and 5 present the network traffic
measured in CREATE and SHELVE operations.
Figure 4: Box plot of traffic (MB) per second of each OS
image.
CLOSER 2021 - 11th International Conference on Cloud Computing and Services Science
236
0.00
0.25
0.50
0.75
1.00
0 100 200 300 0 50 100 150 200
Traffic (MB) Traffic (MB)
Cumulative Distribution Function
image
Centos 7 (1300 MB)
Centos 7 (898 MB)
Cirros
Debian 10
Fedora 31
Fedora 32
FreeBSD 12
Ubuntu Bionic Beaver
Ubuntu Focal Fossa
Windows Server
CREATE Operation SHELVE Operation
Figure 5: CDF plot of traffic per second for each OS image.
Figure 4 groups the network traffic volume (MB) per
second (in log10 + 1 scale) into box plots for each im-
age of OS. The outliers identified for each OS image
are due to peaks of network traffic per second when
the image transfer is occurring. The same does not
happen to MS Windows Server. The considerable size
of MS Windows Server image implies a longer net-
work transfer. In fact, it causes the network to keep
high transfer rate long enough, so this high numbers
are no longer listed as outliers of the distribution. This
high numbers become common values inside this dis-
tribution, and thus, instead of outliers, it become part
of the Q3 of the boxplot.
Figure 5 shows a Cumulative Distribution Func-
tion (CDF) for network traffic per second. CDF
graphs allow to identify the peaks of data transfer
through the network.
Figure 5 shows Fedora 31 and Ubuntu Bionic
Beaver, for example, have most part of their traffic
(around to 90% in CREATE and 80% in SHELVE op-
eration) transmitted at the beginning of the operation.
This happens when the image is traveling through
the network. The remaining operations, the network
traffic gradually increases (with smaller peaks) until
the operation is done. MS Windows Server opera-
tions analysis shows the beginning of both operations
(CREATE and SHELVE), around to 50% of the to-
tal traffic was already transmitted. Sequentially, the
CDF grows in an exponential way, which means the
high tax of transmission (traffic per second) is kept
until the operation traffic amount hits 100% and the
operation ends. In order to study the relationship be-
tween the size of the OS image and the network traf-
fic created by the operations to VMs we also set up a
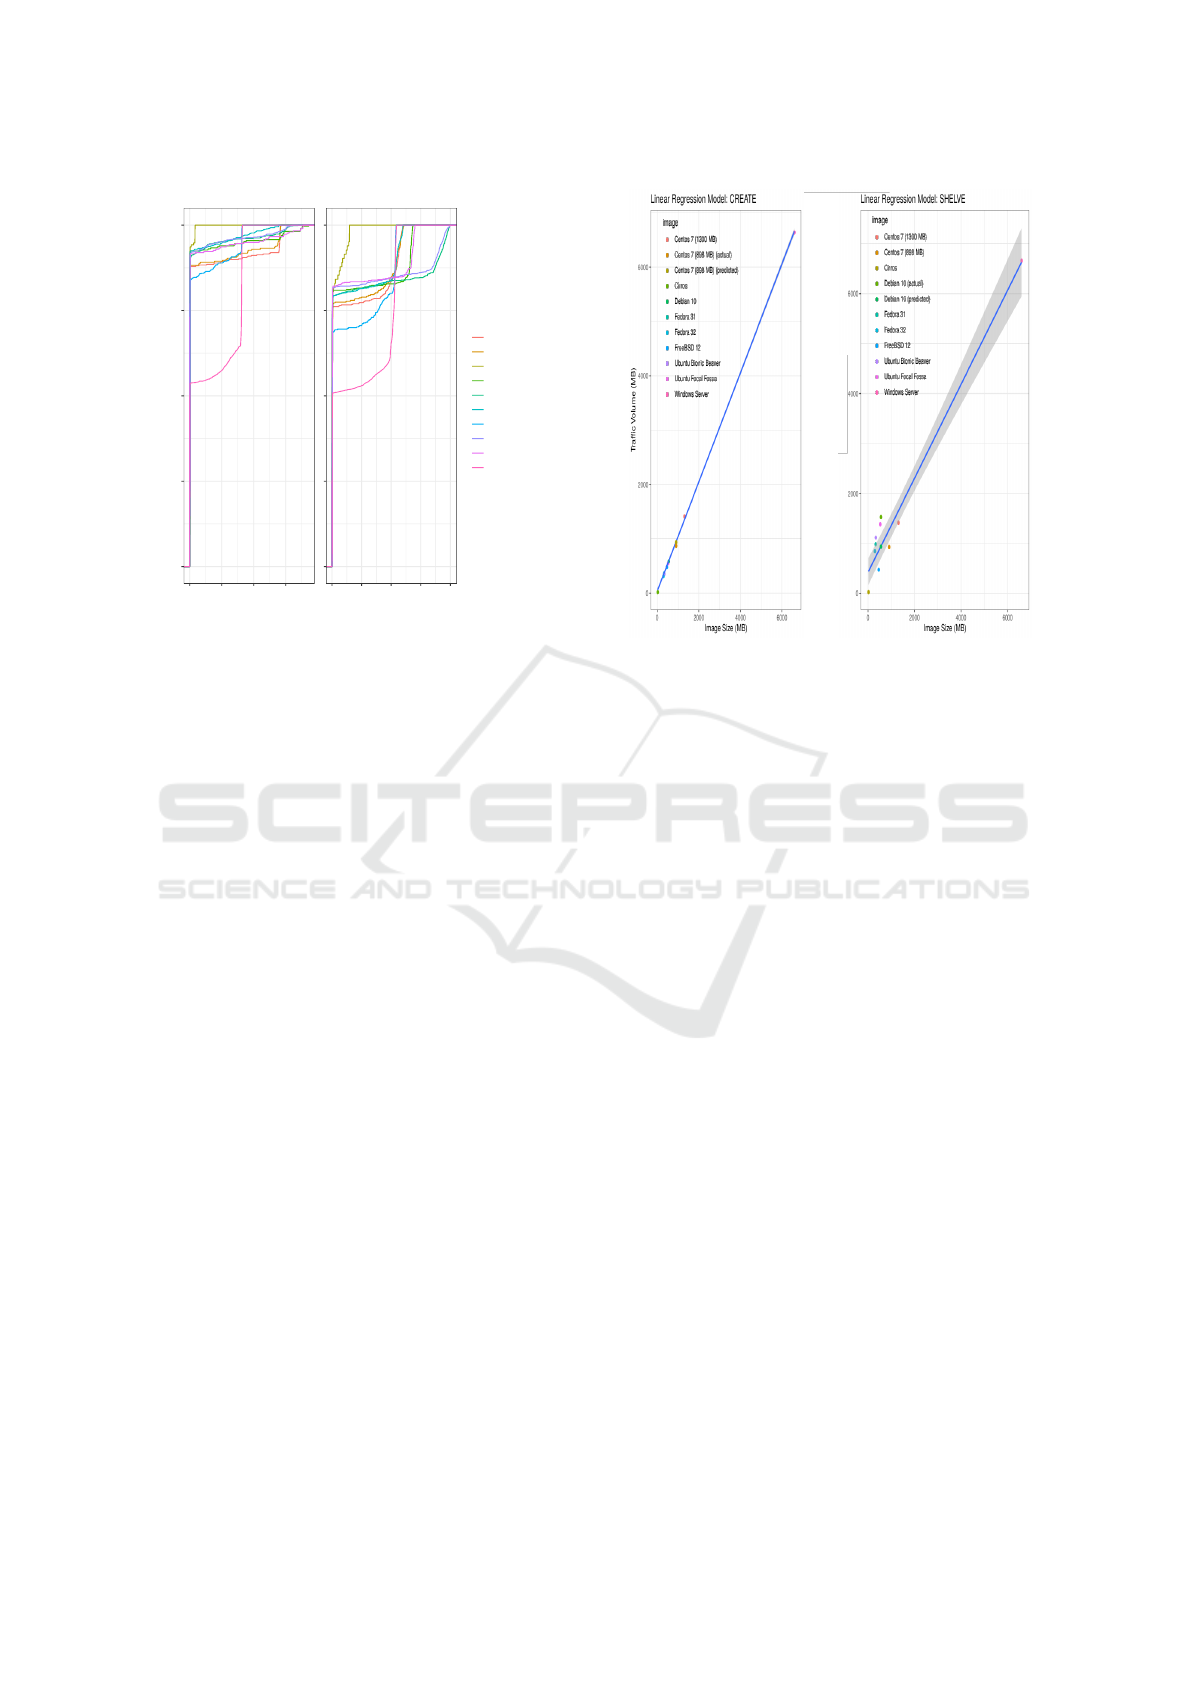
Figure 6: Linear regression model for CREATE and
SHELVE operations. Image size is the predictor and net-
work traffic is the target/response variable.
linear regression model. The linear regression model
allows to understand the growth of the network traf-
fic as a function of the image size. Therefore, we
set the image size as a predictor for the network traf-
fic, which is the target/response variable. Figure 6
shows the linear regression models for operations
CREATE and SHELVE, y = 40.700864 + 1.002707x
and y = 425.4478 + 0.9401x, respectively. Y stands
for the response variable (network traffic volume) and
X stands for the predictor (image size in MB). We em-
ployed 9 OS images and 1 other image to compare
the predicted value by the model to an actual mea-
sured value. The OS image used in the comparison
predicted vs. actual is chosen randomly.
We found good accuracy responses for CREATE
operation (Figure 6), such as a Min Max Accuracy
(MMX) = 93% (approximately) and Mean Absolute
Percentage Error (MAPE) = 7% (approximately). We
adopted a confidence level of 90%; the identified val-
ues of intercept and slope: 40.700864 and 1.002707.
Slope coefficients suggests there is a strong relation-
ship between image size and network traffic (Pr value
of 4e−14). Pr shows the probability of observing ex-
treme values leading to coefficients of value 0 (called
null hypothesis). If Pr is low enough, we can dis-
card the null hypothesis. Thus, when the value of Pr
is significant, it can be stated the null hypothesis is
discarded. Regarding intercept coefficients, the re-
lationship between image size and network traffic is
not so strong despite still valid (Pr value of 0.0139);
strongly significant R-squared and p-value: 0.9998
Characterization of Network Management Traffic in OpenStack based on Virtual Machine State Changes
237

and 3.997e − 14; and residual standard error of 32.3
MB on 7 degrees of freedom.
Regarding the linear model for SHELVE opera-
tion (Figure 6), we do not achieve high levels of ac-
curacy: MMX = 61%; and MAPE = 39%. A 90%
confidence level is adopted; we identified intercept
and slope values of 425.4478 and 0.9401. Slope co-
efficients suggests there is a strong relationship be-
tween image size and network traffic (Pr value of
1.43e − 06). Intercept coefficients suggests a valid re-
lationship between image size and network traffic (Pr
value of 0.0208). R-squared and p-value of 0.9697
and 1.425e − 06, both significant for the context; and
residual standard error of 366.5 MB on only 7 degrees
of freedom. Overall, both linear models provide a di-
rection of what to expect from the network traffic vol-
ume when performing CREATE and SHELVE oper-
ations. Also, it is evident that a larger dataset could
lead the models to better results, in terms of statisti-
cally validation, since we already have good results.
6 ANALYSIS
CREATE and SHELVE operations produce most sig-
nificant amount of network traffic. SUSPEND, RE-
SUME, and STOP operations produce low volume of
network traffic, which is very constant among our 30
observations (Table 2). Also, the networking traffic
for these operations is highly related to the execution
duration, since they basically rely on system calls and
hypervisor actions, which are performed inside the
Compute Node itself, as discussed in Section 5.
Most part of collected traffic was classified to the
service it belongs to. The traffic created between
inter-service communication handled by RabbitMQ
was also listed to its respective services. There is
still a small amount of MISC traffic (Table 3), which
is related to MySQL, since several OpenStack mod-
ules were contemplated in the classification. Also, the
number of API calls depends on how the operations
are performed. There will not be a constant number
of API calls for each operation. In fact, this may vary
depending on configurations, such as the number of
network interfaces on the VM instance.
Multiple instance creation or shelving are opera-
tions demanding a considerable amount of bandwidth.
In a minimal topology, with Controller and Compute
nodes only, for example, multiple instance creation
and/or shelving at same time will cause the network to
clog up. A basic topology, which has a dedicated stor-
age network, deals better with multiple CREATE and
SHELVE operations, since it has a separated physical
network for storage node. Even though, depending on
the available bandwidth, this storage network will still
be slow. Therefore, the prediction of network traffic
volume generated by operations such as CREATE and
SHELVE helps on solving the problem of bandwidth
allocation to a storage network, for example.
OpenStack has a feature for caching images in
Compute Nodes. Thus, when a new instance of the
same type is launched on the same Compute Node,
there is no need for transfer (network traffic) between
Controller Node and Compute Node. In this sense,
OpenStack adopts a standard policy for allocating a
new instance of the ”Worst Fit” type. For exam-
ple, if a project with 10 instances of the same type
is launched on the same Computer Node, then only
one image will be transferred. However, this alloca-
tion policy can be changed to improve reliability and
resilience. Reliability and resilience can be obtained
by allocating each instance in a different Computer
Node so that failure in one of them does not cause the
service to drop all, but this will cause an increase in
network traffic in the allocation (CREATE) and deal-
location (SHELVE). Although image caching helps
on reducing heavy network traffic, it does not fix to-
tally the problem. Considering real scenarios, there
may be several Compute Nodes distributed along the
cloud data center, so the image must be transferred
to them at least once. Also, this same image may be
updated, what makes the image cache deprecated and
new images may be created by the user. Thus, a base-
line network traffic for operations such as CREATE
and SHELVE may help on evaluating more complex
scenarios, which demand several operations to be ex-
ecuted at same time.
Another aspect analyzed was the variation in the
size of the instances’ flavors. Initially we considered
that an instance with more RAM could generate more
traffic in the SHELVE operation. However, according
to the OpenStack documentation (OpenStack, 2019c),
in the SHELVE operation a STOP type operation is
performed, implying the disposal of all information
in the RAM memory. The only operation saving the
information from RAM is a snapshot, which is not
characterized by a change of a VMstate operation.
7 CONSIDERATIONS & FUTURE
WORK
One of the key contributions of this work is to pro-
vide a baseline for the network traffic generated by
the user’s main operations of manipulating VMs in
the OpenStack management network. We accom-
plished the characterization of administrative network
traffic based on VM states changes. We also in-
CLOSER 2021 - 11th International Conference on Cloud Computing and Services Science
238

cluded RabbitMQ network traffic to the characteri-
zation, which represents the inter-services communi-
cation inside the cloud architecture. Besides the lin-
ear regression model provides parameters to estimate
the network traffic generated for any images in the
QCOW2 format.
As future work, the latest versions of the MS
Windows Server are being incorporated into the
results. In addition, some variations in operations not
included in the induced life cycle (presented in this
work) are being measured.
ACKNOWLEDGMENTS
The authors would like to thank the support of
FAPESC, LabP2D / UDESC, and CloudLab.
REFERENCES
Aishwarya. K and Sankar, S. (2015). Traffic analysis using
hadoop cloud. In (ICIIECS), pages 1–6.
Alenezi, M., Almustafa, K., and Meerja, K. A. (2019).
Cloud based sdn and nfv architectures for iot infras-
tructure. Egyptian Informatics Journal, 20(1):1 – 10.
Bruneo, D. (2014). A stochastic model to investigate data
center performance and qos in iaas cloud computing
systems. IEEE Transactions on Parallel and Dis-
tributed Systems, 25(3):560–569.
Chaudhary, R., Aujla, G. S., Kumar, N., and Rodrigues, J. J.
P. C. (2018). Optimized big data management across
multi-cloud data centers: Software-defined-network-
based analysis. IEEE Communications Magazine,
56(2):118–126.
Dainotti, A., Pescape, A., and Claffy, K. C. (2012). Issues
and future directions in traffic classification. IEEE
Network, 26(1):35–40.
Dainotti, A., Pescape, A., and Ventre, G. (2006). A packet-
level characterization of network traffic. In 2006 11th
International Workshop on Computer-Aided Model-
ing, Analysis and Design of Communication Links and
Networks, pages 38–45.
Donatti., A. W., Koslovski., G. P., Pillon., M. A., and
Miers., C. C. (2020). Network traffic characterization
in the control network of openstack based on virtual
machines state changes. In Proc. 10th CLOSER, pages
347–354. SciTePress.
Finsterbusch, M., Richter, C., Rocha, E., Muller, J., and
Hanssgen, K. (2014). A survey of payload-based traf-
fic classification approaches. IEEE Communications
Surveys Tutorials, 16(2):1135–1156.
Flittner, M. and Bauer, R. (2017). Trex: Tenant-driven net-
work traffic extraction for sdn-based cloud environ-
ments. In 2017 Fourth International Conference on
Software Defined Systems (SDS), pages 48–53.
Gustamas, R. G. and Shidik, G. F. (2017). Analysis of
network infrastructure performance on cloud comput-
ing. In 2017 International Seminar on Application for
Technology of Information and Communication (iSe-
mantic), pages 169–174.
Maswood, M. M. S. and Medhi, D. (2017). Optimal connec-
tivity to cloud data centers. In 2017 IEEE 6th Interna-
tional Conference on Cloud Networking (CloudNet),
pages 1–6.
OpenStack. What to do when things are running
slowly. https://docs.openstack.org/operations-guide/
ops-maintenance-slow.html. Accessed: 2020-08-13.
OpenStack (2018a). Openstack docs: Connection.
https://docs.openstack.org/openstacksdk/latest/user/
connection.html. Accessed: 2020-07-15.
OpenStack (2018b). Provision an instance.
OpenStack (2019a). Networking architecture.
OpenStack (2019b). Openstack documentation. https:
//docs.openstack.org. Accessed: 2020-07-15.
OpenStack (2019c). Shelve and unshelve an instance.
OpenStack (2019d). What is openstack? https://www.
openstack.org/software.
OpenStack (2020). Message queuing. https://docs.
openstack.org/security-guide/messaging.html. Ac-
cessed: 2020-07-22.
Sankari, S., Varalakshmi, P., and Divya, B. (2015). Net-
work traffic analysis of cloud data centre. In 2015
International Conference on Computing and Commu-
nications Technologies (ICCCT), pages 408–413.
Sciammarella, T., Couto, R. S., Rubinstein, M. G., Camp-
ista, M. E. M., and Costa, L. H. M. K. (2016). Analy-
sis of control traffic in a geo-distributed collaborative
cloud. In 2016 5th IEEE Cloudnet, pages 224–229.
Shete, S. and Dongre, N. (2017). Analysis amp; auditing
of network traffic in cloud environment. In 2017 In-
ternational Conference on Intelligent Computing and
Control Systems (ICICCS), pages 97–100.
Venzano, D. and Michiardi, P. (2013). A measurement
study of data-intensive network traffic patterns in a
private cloud. In Proc. IEEE/ACM 6th UCC, UCC
’13, pages 476–481, Washington/DC, USA. IEEE.
Wiki, O. (2014). Vmstate. https://wiki.openstack.org/wiki/
VMState. Accessed: 2020-07-22.
Williamson, C. (2001). Internet traffic measurement. IEEE
Internet Computing, 5(6):70–74.
Characterization of Network Management Traffic in OpenStack based on Virtual Machine State Changes
239
