
The Usability of Mobile Enterprise Resource Planning Systems
Thomas Wüllerich and Alexander Dobhan
Department of Business and Engineering, University of Applied Sciences Schweinfurt, Schweinfurt, Germany
Keywords: Usability, Usability Evaluation, User-oriented, Mobile Enterprise Resource Planning Systems.
Abstract: This paper presents a model for end-user-based evaluation of the usability of mobile ERP systems. Recent
studies show that the mobile use of ERP software is both, crucial for user satisfaction and still improvable for
many ERP systems. Therefore, ERP-specific usability models are necessary to meet the requirements of ERP
systems in comparison to e.g., apps for private use. The research objective is therefore to develop a model
that enables software providers to measure and benchmark the usability of their software products. Therefore,
we introduce after a literature research a usability model for the mobile application of ERP systems (mobile
ERP). Our usability model is based on the widely used PACMAD model. We modify the PACMAD model
for the context of ERP systems. This results in a new end-user-based model, that differs from existing models,
because of its focus on end-users and the ERP context. Subsequently, the model will be tested in an initial
study with 19 test persons. The results of the study indicate two main findings. Firstly, the model allows the
measurement of the usability of mobile ERP systems. Secondly, some key factors substantially affect the
usability of mobile ERP systems.
1 INTRODUCTION
The proliferation of smartphones and tablets has
released a discussion on mobile flexibility of business
applications, and in particular of enterprise resource
planning (ERP) systems (Bahssas et al., 2015; Omar
& Gomez, 2016; Tai et al., 2016) Today mobile ERP
applications are now part of the ERP standard.
Providers of ERP systems are responding to user
feedback by increasing the suitability of their
software for mobile devices. This enables, for
example, sales representatives to access internal data
(Bahssas et al., 2015). At the same time, users still see
a need for improvement in this area among software
providers (Trovarit AG, 2019).
Regardless of whether mobile use is realized as a
native application, web application, or hybrid
application (Gronau & Fohrholz, 2016), recent
research outcomes show that users, who complain
about the usability of ERP systems, often reduce
overall user satisfaction. The reason for the negative
usability perception is the complex and static way of
operation (Omar, 2015; Trovarit AG, 2019) caused by
a large amount of data and complex functionalities.
(Omar et al., 2016).
On the other hand, usability challenges refer to the
mobile use of ERP systems, such as limited screen
size, the reduced reliability of the mobile data
connection, and other aspects. The complexity of
ERP systems, which in the past required specific
usability approaches for desktop applications (Singh
& Wesson, 2009), makes a specific usability model
necessary for mobile ERP systems as well (Omar &
Gomez, 2017).
Therefore, researchers have already developed
usability models for mobile ERP systems. However,
these are mostly expert based, while no studies have
been conducted from the perspective of end-users
(Omar et al., 2016). Therefore, the intention of our
research in this paper is to develop an end-user-based
model for evaluating the usability of mobile ERP
applications.
Thus, the next paragraph contains an overview of
recent research outcomes. Subsequently, we
introduce a new usability model based on PACMAD.
The applicability of the new model is then tested
based on an initial study with 19 participants for two
ERP systems. The results of the study are described.
The results include some indications for inter-
dependencies between the components of our model.
2 LITERATURE REVIEW
The common use of mobile devices leads to usability
challenges such as limited screen size, different
Wüllerich, T. and Dobhan, A.
The Usability of Mobile Enterprise Resource Planning Systems.
DOI: 10.5220/0010445005170524
In Proceedings of the 23rd International Conference on Enterprise Information Systems (ICEIS 2021) - Volume 2, pages 517-524
ISBN: 978-989-758-509-8
Copyright
c
2021 by SCITEPRESS – Science and Technology Publications, Lda. All rights reserved
517
screen resolutions, limited processing, and
performance capabilities, limited data entry methods,
the diversity of mobile operating systems and security
in the mobile ERP context (Omar, 2015; Zhang &
Adipat, 2005). Another factor is the mobile
environment, as interaction with environmental
elements causes distraction (Zhang and Adipat,
2005). Mobile connectivity is often a critical feature
(Muccini et al., 2012). Furthermore, different levels
of end-user knowledge should not be neglected
(Nayebi et al., 2012). Another usability challenge
refers directly to the back-end ERP system.
Compared to other mobile applications, mobile ERP
systems process a large amount of data (Omar et al.,
2016).
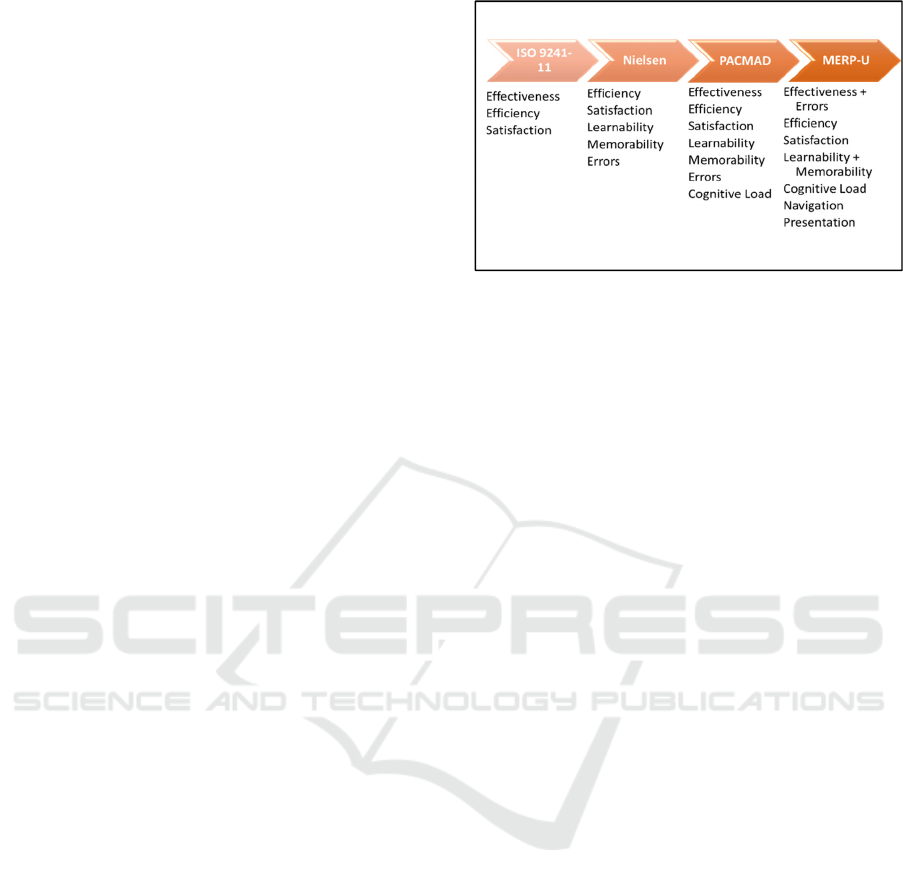
The PACMAD model of Harrison et al.(2013) is
one of the most applied usability models for mobile
applications. It considers the specific requirements of
mobile devices and offers sufficient leeway for
adaptations. PACMAD means "People At the Center
of Mobile Application Development” and is based on
the approaches of Nielsen and ISO 9241-11. The
model identifies the three factors user, task, and
context that influence the usability of an application.
Furthermore, the model has the following seven
dimensions (Harrison et al., 2013):
Effectiveness examines the ability of a user to
complete a certain task. It is measured by successful
task completion (Harrison et al., 2013; Alturki and
Gay, 2017). It has been applied similarly several
times in a similar way (Alturki & Gay, 2017; Frokjaer
et al., 2000)
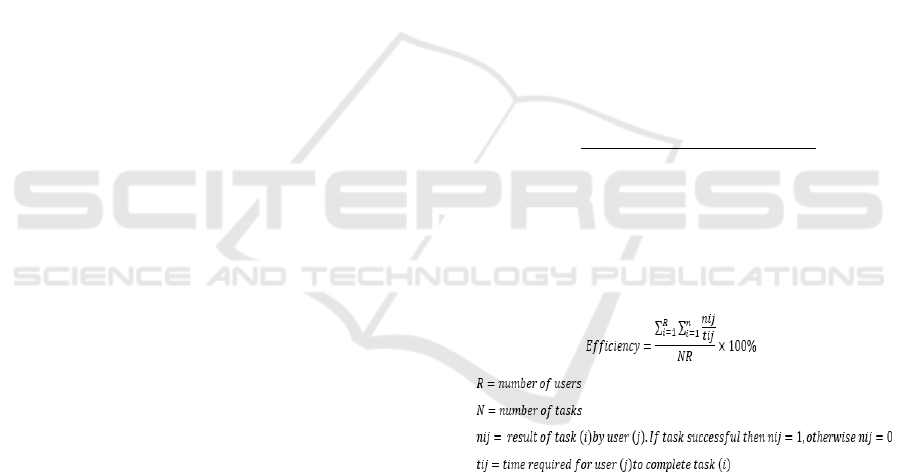
Efficiency measures the ability of a user to
perform tasks with the desired speed and accuracy
(Harrison et al., 2013). One of the measurable
indicators is the time of completion (Alturki & Gay,
2017; Cooprider et al., 2010). To calculate Efficiency,
time is put in relation to Effectiveness.
Satisfaction examines the perceived level of
comfort and friendliness of the system (Harrison et
al., 2013; Frokjaer et al., 2000; Omar, 2015). This is
measured using a questionnaire or other qualitative
techniques such as emoji cards (Harrison et al., 2013).
The Errors dimension is used to determine the
error rate during use (Nielsen, 1994). In practice, it is
measured with the number of errors (Hussain et al.,
2018). According to PACMAD, Memorability is the
ability of a user to maintain the effective use of an
application and avoid repeated learning (Harrison et
al., 2013). This can be determined by repeated
sessions after a period of inactivity (Zali, 2016) or by
using a questionnaire (Hussain et al., 2018). This
dimension is like Learnability, which is defined as an
experience that the user can gain.
The Cognitive Load refers to the amount of
cognitive processing the user can perform (Harrison
et al., 2013). This is measured with the use of eye-
tracking technology or a NASA TLX test (Alturki and
Gay, 2017).
The analysis of usability studies on mobile ERP
systems showed that no end-user-oriented approach
to usability evaluation exists yet.
3 USABILITY MODEL MERP-U
Our model aims to adapt the PACMAD model to
mobile ERP systems. In the first step, the dimensions
of the basic PACMAD model are partially
summarised and operationalized for the mobile ERP
context. After that supplementing, we add further
dimensions that are required for the end-user-oriented
assessment of mobile ERP systems.
To calculate the Effectiveness (1), the share of
successfully completed tasks is quantified. The
outcome of the following formula indicates the level
of Effectiveness:
(1)
In the context of ERP systems, the correctness of data
maintenance or data extraction is easy to quantify for
simple tasks. The number of errors is a measure for
the Errors dimension. For the present model, the
Effectiveness and the Errors are put into a ratio.
(2)
To determine the Efficiency (2) of mobile ERP
systems, the time, it takes to complete the test, is
recorded. Then we take the proportion of correct tasks
in relation to the time spent to get the Efficiency as an
outcome.
Previous studies on user Satisfaction use a
questionnaire with a 5-point Likert scale to measure
it (Hussain et al., 2018; Alturki and Gay, 2017; Omar
2018).
For the model, Learnability is combined with
Memorability. The measurement requires the record
of the time to reach and maintain a given level of
competence (Harrison et al., 2013). It is integrated
𝐸𝑓𝑓𝑒𝑐𝑡𝑖𝑣𝑒𝑛𝑒𝑠𝑠 =
𝑛𝑢𝑚𝑏𝑒𝑟 𝑜𝑓 𝑡𝑎𝑠𝑘𝑠 𝑐𝑜𝑚𝑝𝑙𝑒𝑡𝑒𝑑 𝑠𝑢𝑐𝑐𝑒𝑠𝑓𝑢𝑙𝑙𝑦
𝑡𝑜𝑡𝑎𝑙 𝑛𝑢𝑚𝑏𝑒𝑟 𝑜𝑓 𝑡𝑎𝑠𝑘𝑠 𝑢𝑛𝑑𝑒𝑟𝑡𝑎𝑘𝑒𝑛
×100%
ICEIS 2021 - 23rd International Conference on Enterprise Information Systems
518
into the questionnaire and estimated by the users
themselves.
In the context of the study, the NASA TLX test is
an indicator for the Cognitive Load (Harrison et al.,
2013; Alturki and Gay, 2017). It relies on a
multidimensional construct to derive an overall
workload score based on a weighted average of
ratings on six subscales: mental demand, physical
demand, temporal demand, performance, effort, and
frustration level (Cao et al., 2009).
According to Singh and Wesson, the criteria for
the usability of ERP systems are limited due to the
small number of corresponding studies. However,
they distinguish between six specific basic criteria for
assessing usability (Singh and Wesson, 2009):
• Navigation: navigational functions of the ERP
system
• Learnability: the degree of learnability of the ERP
system
• Task support: the ability of the ERP system to
provide effective task support
• Presentation: presentation capabilities of the ERP
system
• Customization: the ability of the ERP system to
adapt to a specific organization and individual
user
From these heuristics defined by Singh and
Wesson, we select two dimensions to expand the
operationalized PACMAD model. Learnability is not
included because it is already considered in
combination with Memorability. Furthermore, the
heuristic Task Support is included in Effectiveness
and Efficiency. The evaluation of Customization does
not take place within the scope of the study. Instead,
the dimension Presentation considers the main
problems of ERP systems: The complex screen
display and outputs that are often difficult to
understand (Singh and Wesson, 2009). Mobile
applications are particularly affected by this due to
the smaller display (Omar et al., 2016). The
dimension aims to ensure that the layout of menus,
dialogue boxes, controls, and information on the
screen is appropriate and clear (Singh & Wesson,
2009). Another important dimension for the mobile
ERP context is Navigation, as this is a design issue
for ERP systems. This examines the application's
ability to access appropriate information, menus,
reports, options, and elements (Singh and Wesson,
2009). Both, Presentation and Navigation are
subjective criteria of the questionnaire. Along with
Satisfaction participants estimate these dimensions
by using a 5-point Likert scale.
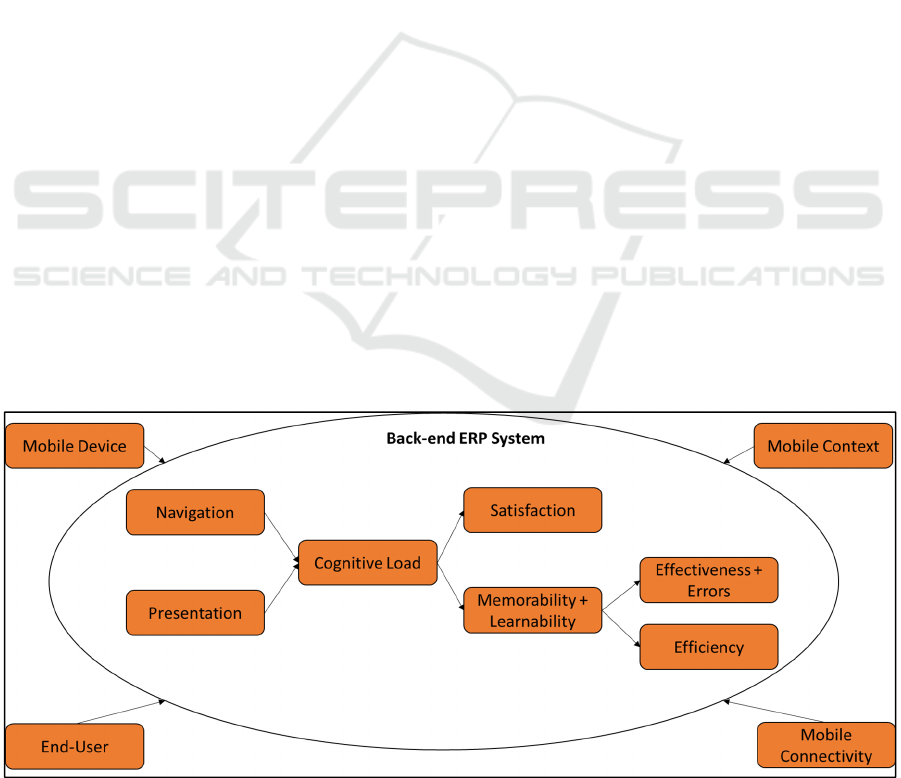
Figure 1: Extended model MERP-U.
The modified PACMAD model, MERP-U, is an
evaluation model that is especially suitable for mobile
ERP systems. It combines the best of both, ERP
usability models (Singh and Wesson) and usability
models for mobile apps (PACMAD). In summary, the
new model includes seven dimensions (see Fig. 1).
4 USABILITY STUDY
For testing the applicability of our model, we applied
it for two ERP systems in an initial study.
4.1 Research Design
The study was about two ERP software products
available on the European market. System A is a
relatively new ERP product, still unknown on most
European markets, but established on the eastern
European market with growing sales figures. It
specializes in production-oriented small or medium-
sized businesses. In contrast, System B is a mature
ERP software for SMEs that is established on the
worldwide market. Both systems are web-based. For
System B an app for mobile devices with Android and
iOS is available. System A works with all common
browsers.
The Participants of the study were 19 research
assistants, student assistants as well as Bachelor and
Master Students with professional and academic ERP
experience. All participants were able to operate in an
ERP software system before and to understand its
basics. Thus, according to Hofer et. al. (2007) the
crucial prerequisite for realistic end-users is fulfilled
Nevertheless, it must be considered that the
participants have a different level of knowledge
regarding the systems.
The Usability of Mobile Enterprise Resource Planning Systems
519
To record usability-related information, the study
includes the application of various methods, which
are:
• The (digital) test sheet (SurveyMonkey) contains
simple tasks in the mobile ERP system (e.g.,
changes in the article master). For usability
recording, answers on the test sheet and the
modified data records in the system were
evaluated for correctness and number of errors.
The results represent the indicators for the
PACMAD dimensions Effectiveness, Errors, and
Efficiency. During processing the tasks, a study
coordinator observed the behaviour of the
participants. He logged the comments of the users
and the user’s reactions. The gained observations
mainly refer to Satisfaction, Cognitive Load
Navigation, and Presentation.
• After the users completed the test sheet tasks, they
were asked to fill out some questions on
Navigation, Presentation, and Satisfaction with a
5-point Likert scale. In addition, the participants
assessed the Memorability and Learnability
Furthermore, they had the opportunity to express
further comments. The questionnaire also
contains an extended NASA TLX test.
For organizational reasons, participants were
assigned to two groups: In the case of the first group,
an online meeting took place via Zoom. The study
coordinator was available to the subjects during this
time for questions and acted as an observer. Group 1
mainly consisted of experienced users.
The members of the second group received their
credentials and access to their tenant (each user has
their client in both systems). The users also received
all instructions and links required for the test by e-
mail. The second group primarily included users with
less experience.
At the beginning of the individual online
meetings, the participants received a short
introduction to the study. Any questions were
clarified in advance so that the first digital test sheet
could be used. The participants worked through the
tasks of the test sheet on their smartphones.
Additionally, they answered the questions on the test
sheet. The study coordinator was available for any
questions and recorded comments, reactions, and
other conspicuous features.
After completion (about 10 minutes), the
participants received a feedback sheet on the ERP
system in the chat. As soon as this was completed, the
participants turned to the second system in the same
way. In the end, a summary feedback discussion took
place.
Participants of group 2 received a more detailed
introduction and worked through the process steps
according to the above structure except for
observation and feedback discussion.
4.2 Results
A total number of 19 participants completed the
study. 8 of these worked through the questions in a
live meeting and 11 completed the tasks outside of an
online session. A total of 18 feedback questionnaires
were filled out completely.
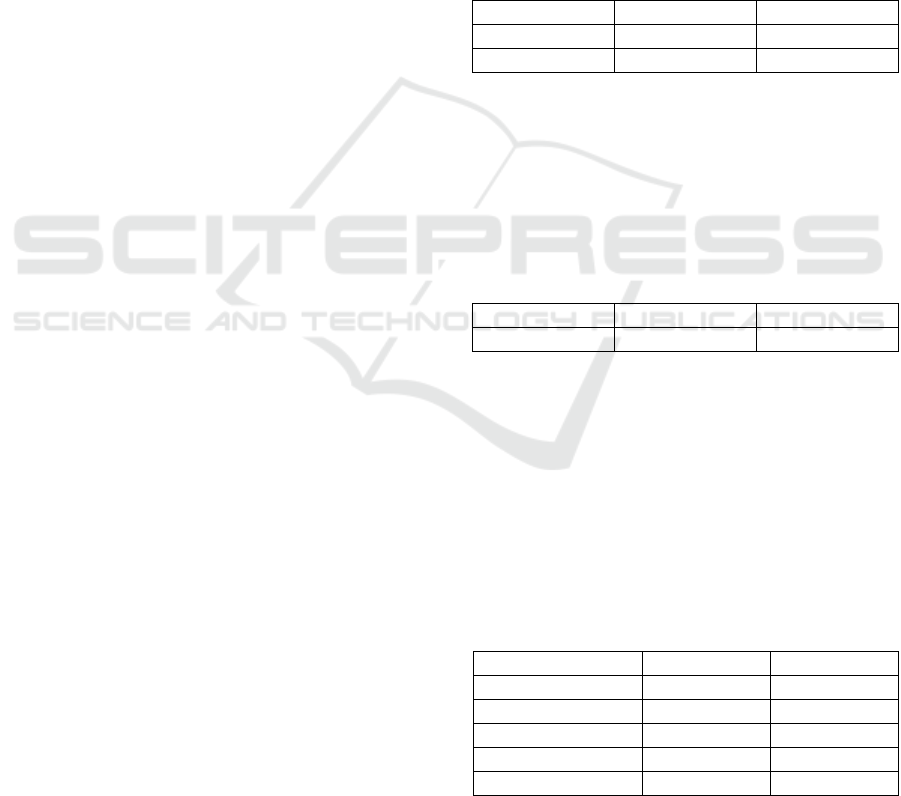
For Effectiveness and Errors, we have achieved
the following results:
Table 1: Results of the Effectiveness and Errors.
System A System B
Effectiveness 77% 63%
Errors 23% 37%
System A seems to have a higher Effectiveness and a
lower Error rate than System B. According to the
results, users completed on average one task more
correctly in System A than ins System B. It turned out
that incorrect spelling, forgotten data, or a lack of
available (in ERP system) information mostly caused
the errors.
Table 2: Results of the Efficiency.
System A System B
Efficiency 62% 39%
The results regarding the Efficiency show a better
Efficiency for System A. This is related to the fact
that the processing time for System A was on average
1.72 minutes shorter than for System B (even though
the effectiveness was better).
To capture the Satisfaction of the users with the
system, participants were supposed to rate the
following statement on a Likert scale: "The
application is satisfactory overall".
The outcome on that is given below:
Table 3: Results of the Satisfaction.
System A System B
Disagree at all 0,00% 0,00%
Disagree 16,67% 22,22%
Part/part 16,67% 27,78%
Agree 50,00% 44,44%
Clearly agree 16,67% 5,56%
When comparing the results regarding the two ERP
applications, it is obvious that users are more satisfied
with System A than with System B.
ICEIS 2021 - 23rd International Conference on Enterprise Information Systems
520
The answers regarding the statement about Learn-
ability and Memorability give the following picture:
“The functions and steps of the application are
memorable and easy to learn”.
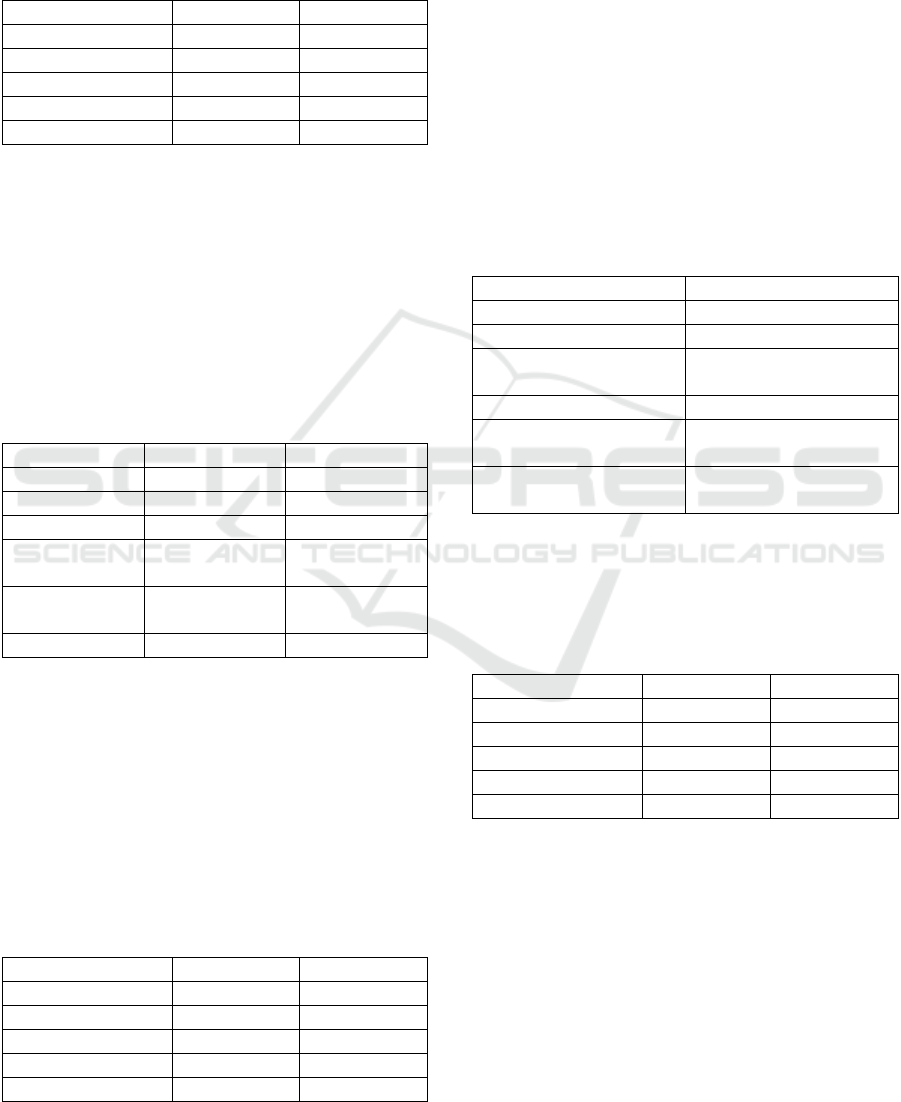
Table 4: Results of the Memorability and Learnability.
System A System B
Disagree at all 11,11% 5,56%
Disagree 0,00% 11,11%
Part/part 0,00% 22,22%
Agree 38,89% 38,89%
Clearly agree 50,00% 22,22%
The distribution of results between the two systems is
slightly similar. With System B, most users consider
the software as easy to learn and memorable.
However, compared to System A, the application
scores lower. 89% of respondents found System A to
be good to very good. 11%, on the other hand, were
very dissatisfied.
For measuring the Cognitive Load, we applied the
NASA TLX test. The table below contains the test
results:
Table 5: Results of the Cognitive Load.
System A System B
Mental effort Not at all (1,47) Little (2,29)
Physical effort Not at all (1,06) Not at all (1,37)
Time pressure Little (1,71) Little (2,35)
Satisfaction of
performance
Satisfied (4,11) Neither (3,27)
Performance
level
Less hard (1,65) Less hard (2,16)
Stress level Little (1,82) Little (2,37)
Most of the test persons feel a lower strain
accompanied by a higher self-satisfaction for System
A compared to System B. The greatest difference
arises in the mental strain and satisfaction
experienced by the participants during the processing.
To record Navigation in the questionnaire, we let
the participants rate the following statement:
"I like the menu navigation and menu structure of the
application".
The table below shows the result on Navigation:
Table 6: Results of the Navigation.
System A System B
Disagree at all 16,67% 11,11%
Disagree 5,56% 33,33%
Part/part 27,78% 27,78%
Agree 27,78% 22,22%
Clearly agree 22,22% 5,56%
System A performs better overall because the
users rate the menu navigation and the menu structure
better than for System B. The conversations and
comments of the test persons confirm that result. The
structure of System A is less extensive and the menu
navigation with its subdivision is logically arranged.
However, some users do not find their way around the
menu navigation. This is due to the poor quality of the
translation. The poorer tendency for the menu
structure of System B is mainly due to the extensive
design of the application and the ease of finding
functions. This has a negative impact on the search
for information.
From the observation and the interviews as well
as the comments in the questionnaire, factors for the
Navigation were also identified:
Table 7: Factors for the Navigation.
System A System B
+ drop-down menu + successful design
+ simple structure + good scaling
+ confirmation of
transactions
+ mature system
- not mature, many errors - overloaded input fields
- poor translation - no transaction
confirmation
- poor scaling on a
smartphone
- modules difficult to
find
The statement for Presentation is as follows: "The
application is designed clearly".
The users of both systems gave the following
feedback on this:
Table 8: Results of the Presentation.
System A System B
Disagree at all 0,00% 5,56%
Disagree 22,22% 50,00%
Part/part 27,78% 16,67%
Agree 27,78% 16,67%
Clearly agree 22,22% 11,11%
Users prefer the clarity of System A to System B. The
negative user ratings are justified by the fact that the
format of System A as a web application is not
scalable to smartphones. Nevertheless, some users
praise the clear presentation of the individual areas
and submenus. In contrast, the scaling of System B is
adapted to the smartphone. On the other hand, it is a
challenge for most users to obtain an overview to find
the desired data.
The Usability of Mobile Enterprise Resource Planning Systems
521
5 INTERPRETATION OF THE
RESULTS
The results of the study show that System A performs
better in all usability dimensions. This may be an
indicator of how the individual dimensions effect on
each other. This means that the positive or negative
result of one usability attribute has a corresponding
effect on another attribute. For this purpose, the
relationships of the dimension are presented taking
into account the external influences identified by
Omar (2015).
Here, the user forms an opinion about the menu
navigation and the presentation of the content. If users
perceive these aspects as positive, they feel low
Cognitive Load. Because of the low Cognitive Load,
there is a high level of self-satisfaction and satisfaction
in general. Furthermore, Memorability and Learn-
ability benefit from this, so that data can be learned and
memorized more easily. This in turn promotes
Effectiveness and Efficiency in the decision (Akiki et
al., 2016). The starting points of the effect chain seems
to be the newly introduced usability attributes
Navigation and Presentation (Babaian et al., 2016).
The reasons for the evaluation of the two new
dimensions are the interaction between the software
architecture and the personal attitude of the user
towards the architecture (Dabkowski & Jankowska,
2003). Therefore, users mostly justify their satisfaction
with arguments that evaluate Navigation and
Presentation. In between, is the Cognitive Load, which
has been shown to influence Satisfaction (Schmutz et
al., 2009). Nevertheless, it should be noted that the
external challenges identified by Omar (2015) also
affect the dimensions within the back-end ERP system.
In the present study, for example, the clarity of
System B was criticized by the test persons due to the
high depth of functions and the numerous options in
the input menus. This had a negative impact on user
satisfaction and usability (Singh and Wesson, 2009;
Omar, 2015). In a Trovarit study, a similar correlation
was found between the range of functions and
satisfaction, which reinforces the research conducted.
It was found out that ERP solutions with fewer
features and applications from smaller vendors scored
best in user satisfaction (Trovarit AG, 2019).
However, despite the higher usability of small
ERP systems, the decision factor for companies to
purchase them is not only usability. These would be,
for example, the desire for a high level of functional
depth. This is especially true for larger companies,
with a large amount of information (Omar and
Gomez, 2016).
6 LIMITATIONS OF RESEARCH
For this study, we designed two different settings.
The advantages of the online meeting were the direct
feedback from the users during the conversation. This
was not possible for participants outside of the online
session. However, the time flexibility was an
important factor for these users to participate in the
study. Originally, live conduction with the support of
eye-tracking was planned for the research design.
This plan was discarded due to the COVID 19 crisis,
so an alternative design without the physical presence
of the participants was intended. With the new
concept, it was consequently no longer possible to use
the eye-tracking system to test the Cognitive Load.
Figure 2: Dimensions of MERP-U.
ICEIS 2021 - 23rd International Conference on Enterprise Information Systems
522

Due to the use of digital media, the new approach
represents a modern alternative to the classic study
with the presence of the participants (Gray et al.,
2020).
Nevertheless, this approach brings challenges
compared to live execution. On the one hand, it
happened that tasks were not fully completed by the
users. Furthermore, there is the risk that participants
cheat by giving false information when completing
the test sheets. The absence of errors was not directly
observed.
Another point of criticism is that test persons in
the study were partly familiar with one of the systems.
Of the 19 users, 15 had practical experience in System
B, while one person was familiar with System A.
Three subjects only had experience in other ERP
systems before the study. Previous knowledge on
performing tasks on a particular system can
significantly influence the results. It is to be expected
that due to experience effects, the known system B
performs better. In this study, no positive tendency
towards the familiar system was noticeable. This
strengthens the result that the usability of system A is
higher than that of B.
Likewise, the system sequence during the study
should be considered, as the learning effect of the first
application probably had a positive effect on the
result of the second system. Of the 19 participants,
eleven started first with System A and eight with
System B. Although System B was mostly used
second, it performed worse in Effectiveness and
Efficiency. Thus, no clear correlation can be
discerned here.
Compared to other studies, the number of
participants in this study is lower, at 19 users
(Frokjaer et al., 2000; Raptis et al., 2013). This is
because this first study was a test of applicability
which already gives us interesting insights.
Furthermore, the results motivate us to plan a study
with by far more participants. This study will be
designed to examine our hypothesis that the
dimensions Navigation and Presentation affect all
other usability dimensions.
7 CONCLUSION
In summary, this research aimed to develop an end-
user-oriented model for the usability evaluation of
mobile ERP systems. This was achieved with the
MERP-U model. The interpretation of the study
results indicates that there are correlations between
the dimensions within the model and that a high
functional depth has a negative effect on usability.
Furthermore, the results allow us to suppose that the
dimensions Navigation and Presentation are of high
importance for mobile ERP systems.
As we emphasized in the paragraph regarding
limitations, the sample size was small compared to
other studies. Therefore, for future research, we are
planning to apply the model to further mobile ERP
applications with a higher number of participants.
The use of techniques such as eye-tracking or web
augmentation is also recommended for analysing
aspects like Navigation, Presentation or Cognitive
Load. This would allow us to automate the process
partly, with the possibility of expanding the analysis
to a higher audience. For that study, it makes sense to
slightly modify the research design to examine the
interdependencies between the dimensions.
REFERENCES
Akiki, P. A., Bandara, A. K., & Yu, Y. (2016). Engineering
Adaptive Model-Driven User Interfaces. IEEE
Transactions on Software Engineering, 42(12), 1118–
1147. https://doi.org/10.1109/TSE.2016.2553035
Alturki, R., & Gay, V. (2017). Usability Testing of Fitness
Mobile Application: Methodology and Quantitative
Results. In N. Meghanathan (Ed.), Computer Science &
Information Technology (CS & IT) (pp. 97–114).
Academy & Industry Research Collaboration Center
(AIRCC). https://doi.org/10.5121/csit.2017.71108
Babaian, T., Lucas, W., Chircu, A., & Power, N. (2016).
Evaluating Interactive Visualizations for Supporting
Navigation and Exploration in Enterprise Systems. In
S. Hammoudi, L. Maciaszek, M. M. Missikoff, O.
Camp, & J. Cordeiro (Eds.), Iceis 2016: Proceedings of
the 18th International Conference on Enterprise
Information Systems : Rome, Italy, April 25-28, 2016.
SCITEPRESS - Science and Technology Publications
Lda. https://doi.org/10.5220/0005770203680377
Bahssas, D. M., Al Bar, A. M., & Hoque, M. R. (2015).
Enterprise resource planning (ERP) systems: design,
trends and deployment. The International Technology
Management Review, 5(2), 72–81. https://www.
atlantis-press.com/journals/itmr/24089
Cao, A., Chintamani, K. K., Pandya, A. K., & Ellis, R. D.
(2009). Nasa TLX: Software for assessing subjective
mental workload. Behavior Research Methods, 41(1),
113–117. https://doi.org/10.3758/BRM.41.1.113
Cooprider, J., Topi, H., Xu, J., Dias, M., Babaian, T., &
Lucas, W. (2010). A Collaboration Model for ERP
User-System Interaction. In R. H. Sprague (Ed.), 43rd
Hawaii International Conference on System Sciences
(HICSS) (pp. 1–9). IEEE. https://doi.org/10.1109/
HICSS.2010.5
Dabkowski, A., & Jankowska, A. M. (2003).
Comprehensive framework for mobile ERP system. In
I. C. S. Staff (Ed.), 14th International Conference on
Database and Expert Systems Applications (pp. 890–
The Usability of Mobile Enterprise Resource Planning Systems
523

894). IEEE. https://doi.org/10.1109/DEXA.2003.123
2134
Frokjaer, E., Hertzum, M., & Hornbæk, K. (2000).
Measuring usability: are effectiveness, efficiency, and
satisfaction really correlated? In T. Turner & S.
Pemberton (Eds.), CHI 2000: The future is here: CHI
2000 conference proceedings : conference on human
factors in computing systems (pp. 345–352). ACM
Press. https://doi.org/10.1145/332040.332455
Gray, L. M., Wong-Wylie, G., Rempel, G. R., & Cook, K.
(2020). Expanding qualitative research interviewing
strategies: Zoom video communications. The
Qualitative Report, 25(5), 1292–1301. http://search.
proquest.com/openview/c264828516f288b941ad22c63
c576706/1?pq-origsite=gscholar&cbl=55152
Gronau, N., & Fohrholz, C. (2016). Mobiles Business mit
ERP. In M. Knoll & S. Meinhardt (Eds.), Edition HMD.
Mobile Computing: Grundlagen - Prozesse und
Plattformen - Branchen und Anwendungsszenarien
(pp. 53–64). Springer. https://doi.org/10.1007/978-3-
658-12029-0_4
Harrison, R., Flood, D., & Duce, D. (2013). Usability of
mobile applications: literature review and rationale for
a new usability model. Journal of Interaction Science,
1(1), 2–16. https://doi.org/10.1186/2194-0827-1-1
Hofer, S., Wende, S., Will, A., & Züllighoven, H. (2007).
End User Development für Leitstand-Arbeitsplätze:
Beschreibung einer Systemarchitektur. In W. Bleek, J.
Raasch, & H. Züllighoven (Eds.), Software
Engineering 2007 (pp. 131–143). Gesellschaft für
Informatik e. V. https://dl.gi.de/handle/20.500.1211
6/22756
Hussain, A., Mkpojiogu, E. O. C., Fadzil, N., Hassan, N.,
& Zaaba, Z. F. (2018). A Mobile Usability Evaluation
of a Pregnancy App. Journal of Telecommunication,
Electronic and Computer Engineering (JTEC), 10(1-
11), 13–18. http://journal.utem.edu.my/index.php/jtec/
article/view/3843
Muccini, H., Di Francesco, A., & Esposito, P. (2012).
Software testing of mobile applications: Challenges and
future research directions. In D. Hoffman (Ed.),
Proceedings of the 7th International Workshop on
Automation of Software Test (pp. 29–35). IEEE.
https://doi.org/10.1109/IWAST.2012.6228987
Nayebi, F., Desharnais, J.-M., & Abran, A. (2012). The
state of the art of mobile application usability
evaluation. In A. G. Aghdam (Ed.), 25th IEEE
Canadian Conference on Electrical and Computer
Engineering (CCECE) (pp. 1–4). IEEE. https://doi.org/
10.1109/CCECE.2012.6334930
Nielsen, J. (1994). Usability engineering. Elsevier.
https://books.google.de/books?hl=de&lr=&id=DBOo
wF7LqIQC&oi=fnd&pg=PP1&dq=usability+engineer
ing+nielsen&ots=Bl75TNFWzT&sig=XTl3WVzyV8x
V_mLuOgxBPYEj1WU
Omar, K. (2015). Towards improving the usability of
mobile ERP. A model for devising adaptive mobile us
to improve the usability of mobile ERP. In D. W.
Cunningham, K. Meer, & I. Schmitt (Eds.), Informatik
2015 (pp. 1783–1794). Gesellschaft für Informatik e.
V. https://dl.gi.de/handle/20.500.12116/2165
Omar, K., & Gomez, J. M. (2016). A selection model of
ERP system in mobile ERP design science research:
Case study: mobile ERP usability. In Proceedings of the
13th International Conference of Computer Systems
and Applications (AICCSA) (pp. 1–8). IEEE.
https://doi.org/10.1109/AICCSA.2016.7945791
Omar, K., & Gomez, J. M. (2017). An adaptive system
architecture for devising adaptive user interfaces for
mobile ERP apps. In G. Issa (Ed.), Proceedings of the
2nd International Conference on the Applications of
Information Technology in Developing Renewable
Energy Processes and Systems (IT-DREPS 2017)
(pp. 1–6). IEEE. https://doi.org/10.1109/IT-
DREPS.2017.8277812
Omar, K., Rapp, B., & Gómez, J. M. (2016). Heuristic
evaluation checklist for mobile ERP user interfaces. In
7th International Conference on Information and
Communication Systems (ICICS). IEEE.
https://doi.org/10.1109/IACS.2016.7476107
Raptis, D., Tselios, N., Kjeldskov, J., & Skov, M. B. (2013).
Does size matter? In M. Rohs & A. Schmidt (Eds.),
MobileHCI'13: Proceedings of the 15th International
Conference on Human-Computer Interaction with
Mobile Devices and Services: Association for
Computing Machinery. https://doi.org/10.1145/24931
90.2493204
Schmutz, P., Heinz, S., Métrailler, Y., & Opwis, K. (2009).
Cognitive Load in eCommerce Applications—
Measurement and Effects on User Satisfaction.
Advances in Human-Computer Interaction, 2009, 1–9.
https://doi.org/10.1155/2009/121494
Singh, A., & Wesson, J. (2009). Evaluation criteria for
assessing the usability of ERP systems. In B.
Dwolatzky, J. Cohen, & S. Hazelhurst (Eds.), ACM
Digital Library, Proceedings of the 2009 Annual
Research Conference of the South African Institute of
Computer Scientists and Information Technologists
(pp. 87–95). ACM. https://doi.org/10.1145/1632149.16
32162
Tai, Y.-T., Huang, C.-H., & Chuang, S.-C. (2016). The
construction of a mobile business application system
for ERP. Kybernetes, 45(1), 141–157.
https://doi.org/10.1108/K-02-2015-0041
Trovarit AG. (2019). ERP in der Praxis – Trovarit – the IT-
Matchmaker. https://www.trovarit.com/erp-praxis/
Zali, Z. (2016). An initial theoretical usability evaluation
model for assessing defence mobile e-based application
system. In ICICTM '16: Proceedings of the
International Conference on Information and
Communication Technology (pp. 198–202). IEEE.
https://doi.org/10.1109/ICICTM.2016.7890800
Zhang, D., & Adipat, B. (2005). Challenges,
Methodologies, and Issues in the Usability Testing of
Mobile Applications. International Journal of Human-
Computer Interaction, 18(3), 293–308. https://doi.org/
10.1207/s15327590ijhc1803_3
ICEIS 2021 - 23rd International Conference on Enterprise Information Systems
524
