
An Improved Deep Learning Application for Leaf Shape Reconstruction
and Damage Estimation
Mateus Coelho Silva
1,3 a
, Servio Pontes Ribeiro
2 b
, Andrea Gomes Campos Bianchi
1 c
and Ricardo Augusto Rabelo Oliveira
1 d
1
Departamento de Computac¸
˜
ao, Instituto de Ci
ˆ
encias Exatas e Biol
´
ogicas, Universidade Federal de Ouro Preto, Brazil
2
Departamento de Biologia, Instituto de Ci
ˆ
encias Exatas e Biol
´
ogicas, Universidade Federal de Ouro Preto, Brazil
3
Instituto Federal de Educac¸
˜
ao, Ci
ˆ
encia e Tecnologia de Minas Gerais, Campus Avanc¸ado Itabirito, Brazil
Keywords:
Conditional GAN, Leaf Damage Estimation, Leaf Shape Reconstruction, Deep Learning.
Abstract:
Leaf damage estimation is an important research method, metric, and topic regarding both agricultural and
ecological studies. The majority of previous studies that approach shape reconstruction work with parametric
curves, lacking generality when treating leaves with different shapes. Other appliances try to calculate the
damage without estimating the original leaf form. In this work, we propose a procedure to predict the original
leaf shape and calculate its defoliation based on a Conditional Generative Adversarial Network (Conditional
GAN). We trained and validated the algorithm with a dataset with leaf images from 33 different species. Also,
we tested the produced model in another dataset, containing images from leaves from 153 different species.
The results indicate that this model is better than the literature, and the solution potentially works with different
leaf shapes, even from untrained species.
1 INTRODUCTION
Computing tools are increasingly aiding in daily
tasks, as ecology (Martinez and Franceschini, 2018;
Gunnarsson et al., 2018; Muiruri et al., 2019) and
agriculture (da Silva et al., 2019; Saidov et al., 2018;
Prabhakar et al., 2019). Among the most recent appli-
cations, we enforce canopy studies (Silva et al., 2018;
Silva et al., 2019; Delabrida et al., 2017), geologi-
cal studies (Delabrida et al., 2016b; Delabrida et al.,
2016a), the agricultural management (Delgado et al.,
2013; da Silva et al., 2019; Bauer et al., 2019), among
others. The application of these devices on the field
creates new perspectives on the uprise of cutting-edge
technology.
A relevant problem in ecology and agriculture is
leaf damage estimation. According to Turcotte et
al. (Turcotte et al., 2014), the consumption of plants
by animals is a relevant factor in evolutionary and
ecological processes. This relationship, named her-
bivory, is responsible for a grand share of the macro-
a
https://orcid.org/0000-0003-3717-1906
b
https://orcid.org/0000-0002-0191-8759
c
https://orcid.org/0000-0001-7949-1188
d
https://orcid.org/0000-0001-5167-1523
scopic biodiversity. They also assess the need for ro-
bust leaf damage estimation methods. For instance,
researchers use this variable as an indicator to ana-
lyze the ecosystem interactions (Muiruri et al., 2019;
Ben
´
ıtez-Malvido et al., 2018), or even to analyze the
impact of predators in crops (Saidov et al., 2018; Bau-
dron et al., 2019).
The leaf conditions also are indicators of many
factors in plants and ecosystem health. Clement et al.
(Clement et al., 2015) reinforce that this parameter re-
flects the plant’s response to biotic and abiotic condi-
tions. Furthermore, this information also helps in un-
derstanding the strength of the plant against pests and
diseases. These factors are important in both ecolog-
ical (C
´
ardenas et al., 2015) and agricultural (da Silva
et al., 2019; Leite et al., 2019) hypotheses tests.
However, to properly understand and formulate
global hypotheses on the influence of leaf damage in
ecosystem functionality traits, such as primary pro-
ductivity or food web stability, a fair estimate of leaf
damage, in a comparative way, should be provided
across ecosystems and habitats. For instance, Kozlov
et al. (Kozlov et al., 2015) provided a global proto-
col to estimate leaf area lost, reaching the average of
5% of leaf area lost to herbivory in the planet. Nev-
484
Silva, M., Ribeiro, S., Bianchi, A. and Oliveira, R.
An Improved Deep Learning Application for Leaf Shape Reconstr uction and Damage Estimation.
DOI: 10.5220/0010444204840495
In Proceedings of the 23rd International Conference on Enterprise Information Systems (ICEIS 2021) - Volume 1, pages 484-495
ISBN: 978-989-758-509-8
Copyright
c
2021 by SCITEPRESS – Science and Technology Publications, Lda. All rights reserved

ertheless, this work ignored canopy habitats, both in
temperate as tropical forests.
On the other hand, Ribeiro and Basset
(Pontes Ribeiro and Basset, 2007; Ribeiro and
Basset, 2016) provided a protocol precisely to
estimate the canopy leaf area lost, likely to be
comparable to the ground vegetation. The constrain
to the latter protocol is the time consumed and the
risk involved in climbing to produce the data. If a
professional climber could use a wearable computing
device (dismissing the risky climbing of a scientist)
and collect the data faster and more reliable, any
better protocol capable of being reproduced on the
ground or climbing would contribute to generating
global batter estimates. Global warming and its
effects on planetary ecological functionality demand
such a methodological constraint to be quickly
overcome.
Most techniques found in the literature present ap-
plications developed for specific contexts. Some ap-
proaches lack generality in shape, while others are
specifically designed for particular species or cases.
The procedures and tests do not provide enough data
to assume the solutions’ generality in all studied
cases. Also, none of the found solutions apply Ar-
tificial Neural Networks to estimate the leaf form.
Thus, in this work, we propose a novel algorithm to
reconstruct the leaf shape using a trained Conditional
Generative Adversarial Network (Conditional GAN)
based on U-Net.
1.1 Contributions
The main contribution of this paper is:
• A novel method to reconstruct the original leaf
shape and estimate the damage, applying a U-Net
based Conditional GAN.
Secondary contributions of this work are:
• An artificial random damage generation method
to create a synthetic database;
• An analysis of the algorithm precision and its
comparison with other techniques;
• An analysis of the quality of the shape reconstruc-
tion.
The rest of this article is organized as follows: In Sec-
tion 2, we introduce the state-of-the-art presented in
the literature and the main differences between these
approaches and ours. After this, we present the pro-
posed method in Section 3. Within this section, we
introduce the databases employed in this work in Sub-
section 3.1. Subsection 3.2 displays the proposed pre-
processing technique. In Subsection 3.3, we discuss
the synthetic dataset generation method, with the ar-
tificial damage generation process to train the Con-
ditional GAN. Section 3.5 presents the Neural Net-
work employed in this method. In Subsection 3.6 we
present the calculation method for the damage esti-
mation, and in Subsection 3.7 we present the eval-
uation methods for the proposed technique. Section
4 presents the obtained results from the tests, and in
Section 5 we present the conclusions and discussion.
2 RELATED WORK
As presented before, leaf damage estimation, or defo-
liation estimation, is a significant problem. Thus, we
overview some of the state-of-the-art algorithms and
methods applied to resolve this issue.
For this matter, Da Silva et al. (da Silva et al.,
2019) used Convolutional Neural Networks and syn-
thetic damaged leaf images produced from a real
dataset to estimate defoliation. Initially, they prepro-
cess the real images to reach a limited size and bi-
narized maks. The researchers then apply an artifi-
cial defoliation technique to generate a large amount
of labeled data from damaged artificial leaves. Fi-
nally, they used the data to train Convolutional Neu-
ral Networks models (AlexNet, VGGNet, Resnet), in
which the last layer performs a regression to estimate
the damaged area value. The applied train dataset
contains images from soybean leaves. Although the
presented results display leaves from two different
species, the solution’s generality to different leaves
with varying shapes is debatable.
Also, Machado et al. (Machado et al., 2016) pro-
posed an original method to estimate the foliar dam-
age caused by herbivory. Their work presents a novel
algorithm based on parametric curves to estimate the
original leaf shape. Using this data, they determine
the estimated damage based on the predicted shape of
the original leaf. Once again, this method’s general-
ity is uncertain, as it relies on the assumption that the
leaves have non-convex shapes.
Manso et al. (Manso et al., 2019) also created a
smartphone application to detect rust in coffee leaves.
For this matter, their algorithm separates the leaf from
the background using different color spaces. Then, it
segments the damaged spaces using Otsu’s algorithm.
Finally, they identify and classify the damage using
artificial neural networks. Once again, although the
researchers presented precise results, their algorithm
cannot be generalized for various plant species and
issues.
To detect Yellowness and Esca in grapevines, Al-
Saddik et al. (Al-Saddik et al., 2018) established an
An Improved Deep Learning Application for Leaf Shape Reconstruction and Damage Estimation
485
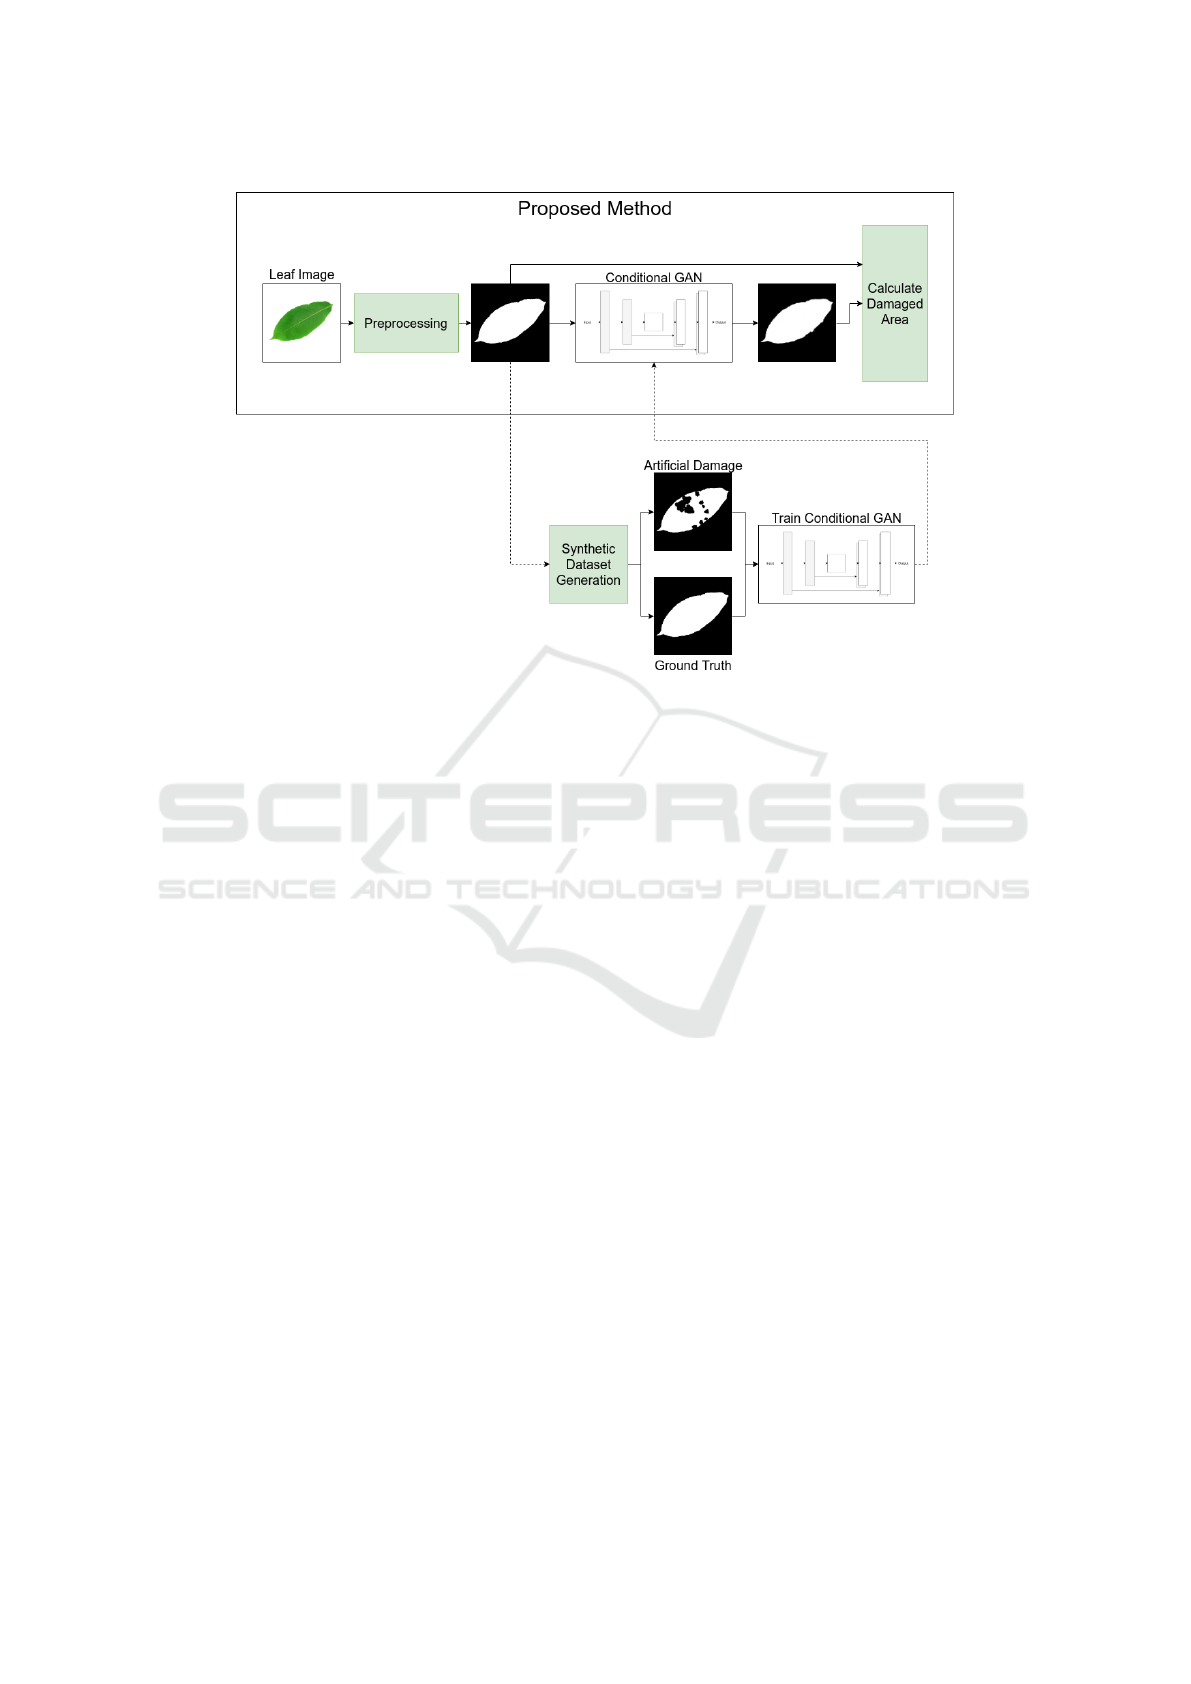
Figure 1: Proposed Method and Work Overview.
analysis based on spectral reflectance and image tex-
ture. They preprocess the images based on different
color spaces. Then, they classify them using artificial
neural networks. Once again, their work is techni-
cally sound, obtaining outstanding results. Neverthe-
less, this technique and method apply directly to the
targeted species without generality.
Liang et al. (Liang et al., 2018) created a method
to estimate leaf area, edge, and defoliation in soybean
plants. In their application, the user manually selects
a region of interest in which the algorithm examines
the requested information. They estimate the origi-
nal leaf area and calculate the leaf damage using this
procedure. Although the researchers present good re-
sults to soybean crop leaves, they do not analyze their
solution in a more general context.
Although many works present solutions regarding
this problem, most of them lack generalism. Some of
the related papers propose shape-dependant methods.
Others treat issues related to single or few species.
It is also impossible to claim how general the proce-
dures are, based on some works’ provided informa-
tion. Finally, these authors do not analyze the quality
of the shape reproduction. In this work, we present
and test a method applied to leaf images from multi-
ple species, allowing us to determine how general the
solution is in terms of shape and species.
3 METHODS OVERVIEW
In this section, we present a general overview of
the proposed method. Also, we display a general
overview of how we developed this work.
The proposed method’s main thread starts with a
preprocessing to extract a mask containing the leaf
area in the image, separated from its background.
Then, we submit the segmented image to a trained
Conditional GAN model to obtain the estimated orig-
inal leaf shape. Finally, we compare the output with
the input image to obtain the estimated percentage of
defoliation. Figure 1 illustrates this method.
Also, we used the preprocessing method to gener-
ate the masks’ database containing the entire leaves’
shapes. We used these images to generate a syn-
thetic database containing leaf masks with artificially
included damage. This database was further used to
train the Conditional GAN method to obtain the test
model, using the original masks database as ground
truth. Figure 1 also illustrates this set of stages.
3.1 Databases Description
In this work, we used two different databases. The
first one is henceforth named FLAVIA. It was pre-
sented by Wu et al. (Wu et al., 2007). This set
contains pictures from 1907 leaves from 33 different
plant species. The pictures are colored images with a
resolution of 1600x1200 pixels. We used this dataset
ICEIS 2021 - 23rd International Conference on Enterprise Information Systems
486

for the synthetic database creation and model training,
validation, and tests.
We also used the Middle European Woods dataset,
presented by Novotny and Suk (Novotn
`
y and Suk,
2013). Henceforth called MEW 2012, this set con-
tains 9745 leaf images from 153 different species and
is also available already binarized, with various reso-
lutions. We used this dataset to perform further tests
on the damage estimation process and the shape re-
construction.
3.2 Preprocessing
In the last section, we presented some of the state-
of-the-art techniques to estimate leaf damage. In this
section, we present the initial processing process to
segment leaves from the background. To capture the
leaf shape, we followed a systematical preprocessing
algorithm in six steps:
1. Insert paddings to fit the image into a square ;
2. Reduce the size of the image to 400x400;
3. Convert to grayscale;
4. Enhance the contrast using a radiometric transfor-
mation;
5. Calculate the threshold using Otsu’s method;
6. Binarize the image;
In the synthetic dataset generation, we also eliminate
internal holes to generate ideal leaf images. Finally,
we developed a novel randomly artificial damaged
leaf image creation method, with which we produced
a dataset to train the Conditional GAN.
This subsection presents the preprocessing
method’s details to segment the leaf area from the
background. Furthermore, this process is also the
basis for synthetic dataset generation.
At first, we transform the image to grayscale. Af-
ter this, we include paddings to alter the picture into a
square shape, according to its largest dimension. The
padding pixels use the maximum pixel value from the
image to support the binarization process threshold-
ing. After this primary process, we submit the image
to a contrast enhancement using a radiometric trans-
formation. For this, the application must scale the im-
age pixels in the [0,1] interval. We chose the exponent
based on experimental tests on the grayscaled frames.
This transformation darkens the intensity of the dark-
est pixels and increases the intensity of the lightest
pixels. This transformation changes the pixel value
according to the equation below:
G
f
(x,y) = G
i
(x,y)
10
(1)
Finally, after the contrast enhancement, the follow-
ing stage is the binarization. For this matter, we used
Otsu’s method (Bangare et al., 2015) to determine
the separation threshold from the leaf and the back-
ground. This method seeks to maximize the intra-
class variance function, σ
2
b
(k), given by the equation:
σ
2
b
(k) =
[µ
T
ω(k) − µ(k)]
2
ω(k)(1 − ω(k))
(2)
Where k is the highest number of all the possible
threshold values and:
ω(k) =
k
∑
i=1
p(i) (3)
µ(k) =
k
∑
i=1
i.p(i) (4)
µ
T
=
L
∑
i=1
i.p(i) (5)
Obtained from the histogram normalized as a proba-
bility density function, p(i), for the L candidate val-
ues of separation threshold in the histogram. With
this method, we estimate the ideal threshold to bina-
rize the image. The ω(k) term represents the class
probability, µ(k) term represents the class means, and
µ
T
represents the global mean. Finally, i assumes all
values present in the histogram. The identified vulner-
ability is that this preprocessing method can identify
reflection spots as damage, as it uses a single thresh-
old value. Nonetheless, this method has been demon-
strated to be reliable for image binarization. This is-
sue could misidentify these spots as a damaged area.
3.3 Synthetic Dataset Generation
In the last section, we presented the preprocessing
method to binarize leaf images and prepare them
to apply the proposed method. In this section, we
present the technique applied to produce the database
for the GAN training. In this stage, we used the
FLAVIA dataset, presented in Section 3.1.
Most leaves in the dataset present no damage.
Some of them present a small amount of damage
and some present light reflection spots. To over-
come this and create a better representation of the
ideal leaf shape, we selected the largest contour rec-
ognized after the binarization to create a complete leaf
representation. From this technique, we created the
1907 masks corresponding to the 1907 images on this
dataset. In the next stage, we need to create measur-
able artificial damage in the leaf masks to create a su-
pervised learning dataset.
An Improved Deep Learning Application for Leaf Shape Reconstruction and Damage Estimation
487
3.4 Artificial Damage Creation
In this subsection, we present how we created artifi-
cial random damage on the leaves. As Da Silva et al.
(da Silva et al., 2019), we also applied artificial dam-
age techniques to generate a training dataset.
At first, we understand that the leaf has a slightly
greater probability of having damage at its bor-
ders. Thus, we created a 2-D probability distribution,
g(x,y), centered on the (x
0
,y
0
) average center posi-
tion of the x and y coordinates of the leaf mask bina-
rized image. Equation 6 of this 2-dimensional Gaus-
sian distribution centered in (x
0
,y
0
) and a σ standard
deviation is:
g(x,y) = e
−
(x−x
0
)
2
+(y−y
0
)
2
2∗σ
2
(6)
Furthermore, we created a probability density func-
tion (PDF), p(x,y), for the damage using g(x,y) ac-
cording to the following equation:
p(x,y) =
1 − g(x, y)
2
+ P
0
(7)
Where P
0
is a minimum probability offset. Finally,
the probability of damage outside of the leaves limits
in the image must be zero. This condition happens by
multiplying the PDF function by the leaf mask. In the
first stage of this work, we chose a baseline value of
P
0
= 0.3, and σ = 100 based on the databases’ prac-
tical tests. In the second stage, we chose a baseline
value of P
0
= 0.6, and σ = 10000, to generate more
damage on average.
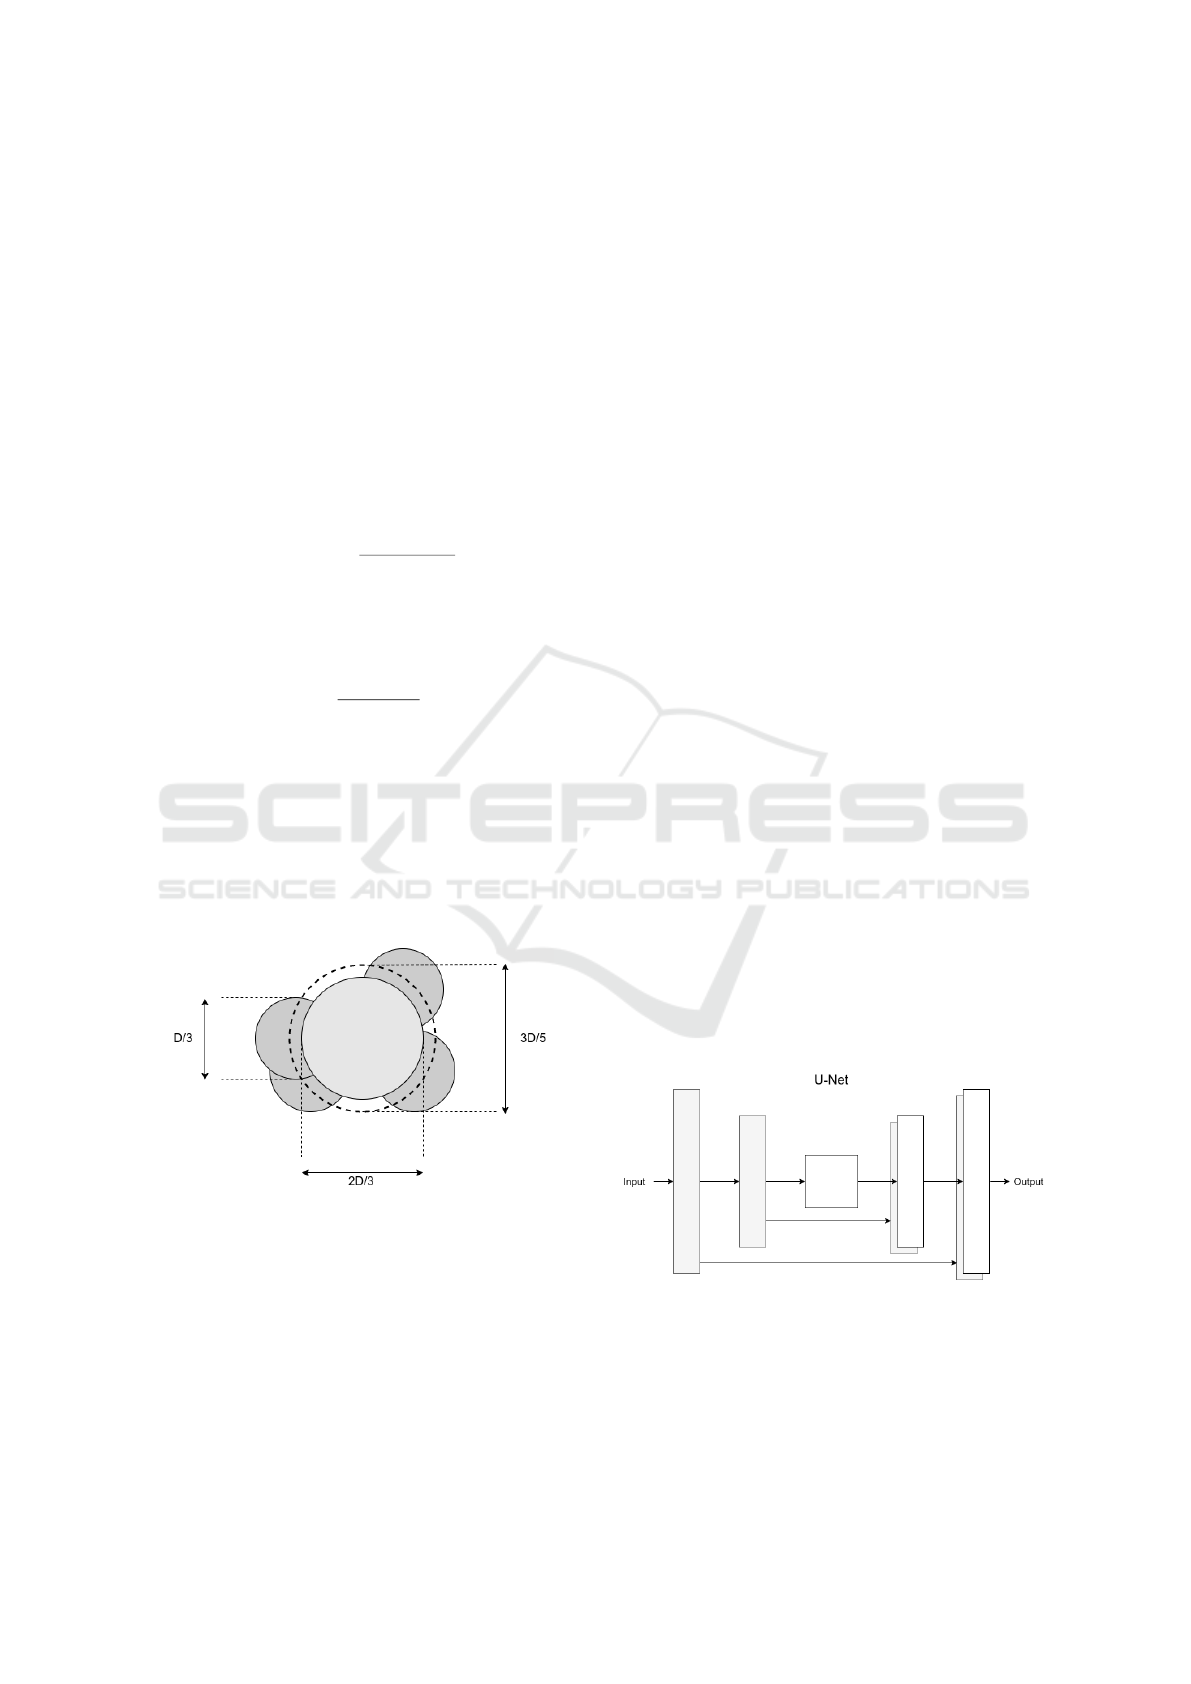
Figure 2: Punctual artificial damage generation method.
The damage generated at a point follows a pattern.
At first, we draw a circle with a 2D/3 diameter for
a given D reference size. Afterward, we draw four
circles with a D/3 diameter centered in random points
located in a virtual circle of 3D/5 diameter. Figure 2
presents the punctual artificial generation method.
The artificial damage generation algorithm takes
several random coordinates and checks the PDF to de-
termine whether it should insert damage at that point.
In the case of a positive answer, it injects the loss at
the spot, randomly selecting a reference size. The
area has a 10% probability of having a 60-pixel ref-
erence value, 40% probability of having a 30-pixel
reference value, and 50% of having a 20-pixel refer-
ence value.
To generate the synthetic dataset, we produced
12 versions of each leaf with random losses. For
this matter, we chose a pixel located in a coordinate,
(x,y), as a candidate for receiving the artificial dam-
age. The damage only occurs if the pixel is located
in the boundaries of the leaf. For the first four im-
ages, we ran the method with 100 coordinates. For
the fifth to the eighth, we executed the procedure with
200 coordinates. For the final four, we performed it
with 300 coordinates. The resulting dataset presented
22884 shapes with various levels of artificially gener-
ated damage.
3.5 Conditional GAN Architecture
In the last section, we presented the preprocessing
procedure used to feed the shape reconstruction and
damage estimation algorithm. Furthermore, we intro-
duced how we generated artificial damage to create
the training dataset. In this section, we present the ar-
chitecture of the Deep Neural Network applied in this
solution.
Our implementation takes the work of Isola et al.
(Isola et al., 2017) as a baseline. For this matter, we
applied a U-Net based Conditional GAN architecture.
This network has two main modules: a generator and
a discriminator. At first, the generator takes an input
image and produces a predicted output. Then, the dis-
criminator evaluates the prediction.
3.5.1 U-Net
Figure 3: U-Net Architecture.
U-Nets are generative models of deep neural net-
works. Originally, this technique was proposed to
perform segmentation in biomedical images (Ron-
neberger et al., 2015). They are similar to Varia-
tional Autoencoders (VAEs) (Hou et al., 2017), and
ICEIS 2021 - 23rd International Conference on Enterprise Information Systems
488

due to their generative capability, they can be used
to reconstruct images pixel-by-pixel. These networks
are applied for recognition and segmentation (Dong
et al., 2017; Oktay et al., 2018) and for reconstruction
(Hyun et al., 2018; Antholzer et al., 2018).
3.5.2 Generator
The architecture of the generator is an Encoder-
Decoder network. This implementation uses a U-Net,
which is an Encoder-Decoder with interconnected
mirrored layers. Figure 3 displays a high-level visu-
alization of this architecture.
3.5.3 Discriminator
The discriminator follows a PatchGAN architecture.
This composition is similar to the encoding section
of an Encoder-Decoder network. Still, according to
Isola et al. (Isola et al., 2017), this is an application
of a Markovian Discriminator and can have a reduced
size.
3.5.4 Training
This network employs a two-part training. At first,
the algorithm trains the discriminator according to the
baseline answers. After this, the generator weights
are updated according to the baseline truth and the
discriminator guess.
Initially, we performed the training algorithm for
20 epochs. The first results were already better than
the ones presented in the literature. Nevertheless, we
observed some signals of overfitting. Thus, we trained
the network for five epochs, obtaining a significant
improvement. With this further improvement, the er-
ror reaches a way smaller value, becoming the state-
of-the-art on the proposed problem.
3.6 Damage Estimation
In the previous section, we presented the network ar-
chitecture and its training aspects. In the preprocess-
ing stage, we convert the image to grayscale and apply
a binarization process. After this, we apply this im-
age to the Conditional GAN, obtaining a mask with
the predicted original shape as a result. Finally, we
calculate the damage percentage as:
P
d
= (1 −
∑
i, j
Im
d
(i, j)
∑
i, j
Im(i, j)
) × 100(%) (8)
Where P
d
represents the damage percentage,
∑
i, j
Im
d
(i, j) represents the sum of the binarized
value (0 or 1) of each pixel of the damaged leaf
image, and
∑
i, j
Im(i, j) represents the sum of the
binarized value (0 or 1) of each pixel of the baseline
image. We used the original image mask as the
baseline for calculating the ground truth values of
damage and the model’s outputs to calculate the
predicted damage.
3.7 Evaluation Methods
The previous section introduced the neural network
applied to estimate the leaves’ original shape, start-
ing from damaged leaf images. We also presented
the image datasets and the artificial damage gener-
ation process used to produce the synthetic dataset
before this. In this section, we display the methods
to evaluate the prediction quality. From the original
22884 images, we used the first 22833. We randomly
separated these images into three distinct sets. 10%
of the images composed the validation dataset. An-
other 10% formed the test dataset. The remainder
80% were used for training the algorithm. In the sec-
ond stage, we repeated the process described above,
changing the parameters to allow more damage. We
also used the 22884 images to produce the dataset us-
ing the same proportions.
We also performed a round of predictions in the
MEW 2012 dataset after the training process. We
reduced the images to 256x256 pixels and applied
the same random damage process presented in Sec-
tion 3.2, with P
0
= 0.7 and 10 to 40 random dam-
age coordinates chosen for a faster generation pro-
cess, as the database had several images. Also, we
applied the same pixel damage sizes and probabili-
ties. In this case, each image generated four new ones
in the dataset, with a total of 38980 images. Although
there were some differences in the generation process,
the images must be resized to 400x400 pixels for the
model to work correctly.
3.7.1 Damage Estimation Evaluation
Similarly to Da Silva et al. (da Silva et al., 2019), we
also obtain values of the real defoliation percentage
d
r
and the estimated defoliation percentage d
e
. This
value can be measured on both validation and test
sets, as we generated the synthetic dataset from the
ground truth. Thus, we also evaluate the Root Mean
Square Error, given by the following equation:
RMSE =
r
1
n
∑
(d
e
− d
r
)
2
(9)
Also, we perform a set of quantitative and qualitative
analysis based on the prediction results.
An Improved Deep Learning Application for Leaf Shape Reconstruction and Damage Estimation
489
3.7.2 Shape Reconstruction Evaluation
In the last subsection, we presented the evaluation
method for the damage estimation process. After an-
alyzing the defoliation estimation method’s quality,
we also provide a quantified evaluation of the image
reconstruction process. For this matter, we applied
the Dice Coefficient, which is a method also used by
several authors to evaluate image similarity (Genc¸Tav
et al., 2012; Sampat et al., 2009; Shamir et al., 2019;
Mun et al., 2017; Nitsch et al., 2019). Equation 10
presents how to calculate the dice coefficient (DC) for
a pair of images, given by A and B.
DC =
2|(A ∩ B)|
|A| + |B|
(10)
The value coefficient result is always in the [0, 1] in-
terval. A high dice coefficient value indicates that the
images have high similarity. Thus, we use this fac-
tor to measure the shape reconstruction process’s suc-
cess, calculating the dice coefficient to compare the
ground truth and model output images.
4 RESULTS
In the last section, we presented the applied method
to evaluate the leaf damage predictions. This process
bases on the estimation of the original leaf shape us-
ing a Conditional GAN. In this section, we present
an overview of the original and predicted data. Also,
we display the results of the applied tests and present
some preliminary conclusions from quantitative and
qualitative analysis.
The first important result is the analysis of the
RMSE, defined by the equation 9. The validation
dataset had an RMSE value of 0.92 (± 1.90), and the
test dataset had a value of 0.92 (± 1.85). Both val-
idation and test datasets have similar results for the
RMSE value. This conclusion presents a considerable
advance from the literature methods, which had a ref-
erence value of 4.57 (± 5.80) (da Silva et al., 2019).
After the second training stage, the obtained results
for the error were even lower. The validation dataset
had an RMSE value of 0.61 (± 0.99), and the test
dataset had a value of 0.52 (± 0.73). Table 1 presents
these obtained results.
Table 1: RMSE Results.
Validation Set Test Set
Initial Round 0.92 (± 1.90) 0.92 (± 1.85)
Improved Round 0.61 (± 0.99) 0.52 (± 0.73)
The validation set for the initial stage contains 2283
images randomly selected from the original dataset.
The estimated average damage on this set is 10.68 ±
6.34%. The maximum damage value is 37.99%. The
real average damage is 9.86 ± 6.03%, with a maxi-
mum value of 35.31%. For the second stage, the ini-
tial stage’s validation set contains 2288 images ran-
domly selected from the original dataset. The esti-
mated average damage on this set is 23.88 ± 12.97%.
The maximum damage value is 65.59%. The real av-
erage damage is 23.84 ± 13.06%, with a maximum
value of 65.76%. In Figure 4 and 5, we display the
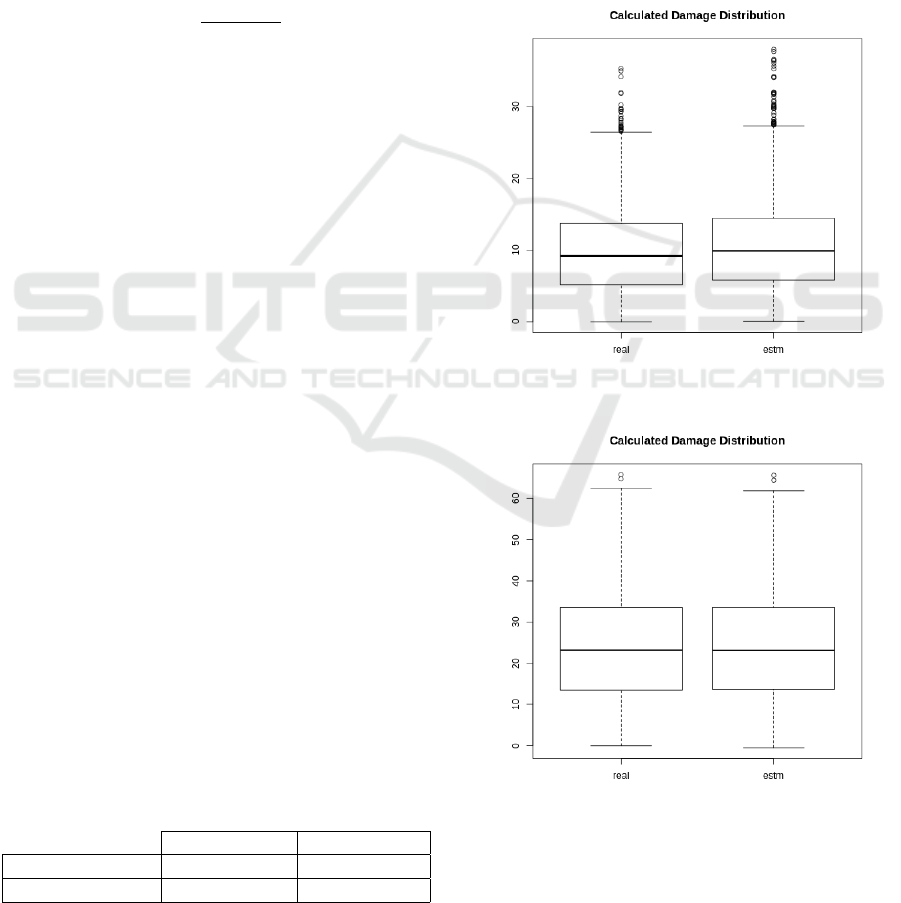
boxplots with the distribution from this data.
Figure 4: Validation Set - Damage Distribution for the Ini-
tial Round.
Figure 5: Validation Set - Damage Distribution for the Im-
proved Round.
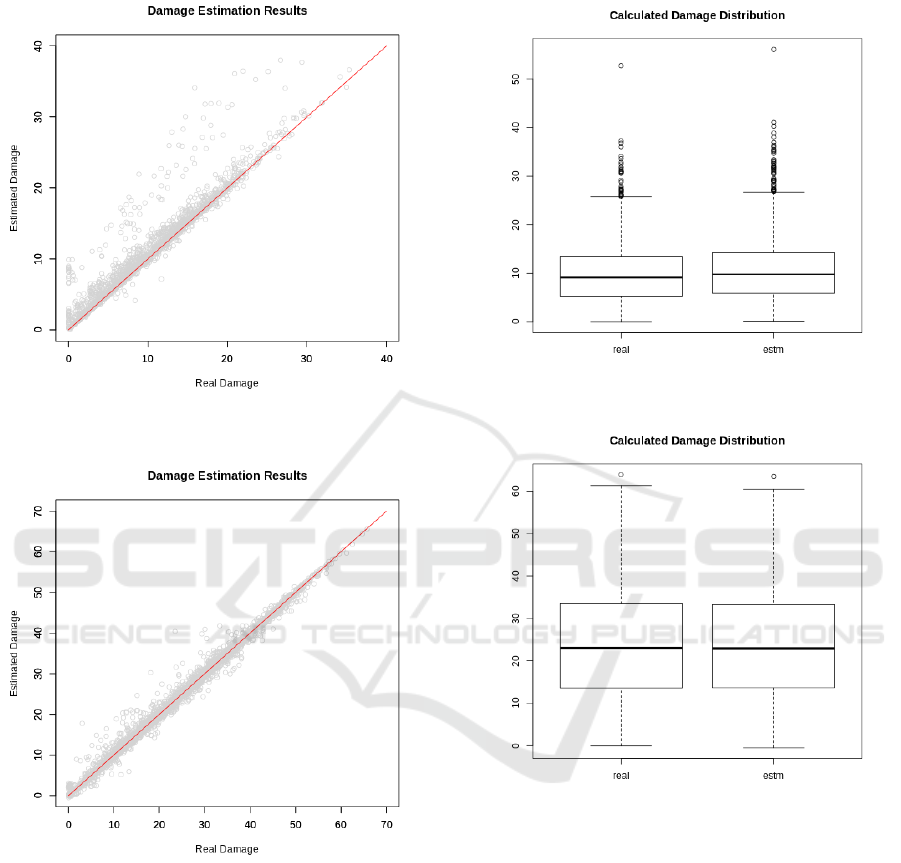
Also, we produced a graph comparing the obtained
data with the ground truth. We did it both for the ini-
tial and improved stages. Figure 6 and 7 display the
ICEIS 2021 - 23rd International Conference on Enterprise Information Systems
490
results for the validation dataset on the initial and im-
proved rounds.
Figure 6: Validation damage estimation results for the Ini-
tial Round.
Figure 7: Validation and test sets damage estimation results
for the Improved Round.
Similarly, the test set also contains 2283 images ran-
domly selected from the initial set. The average esti-
mated damage in this set is 10.66 ± 6.44%. The max-
imum value in this set is 56.14%. The real damage
distribution average and standard deviation are 9.84
± 6.19%, with a maximum damage of 52.74%. In
the second stage, the test set contains 2289 images.
The average estimated damage in this set is 23.61 ±
12.99%. The maximum value in this set is 63.49%.
The real damage distribution average and standard de-
viation are 23.68 ± 12.99%, with a maximum damage
of 63.92%. In Figure 8 and 9, we display the boxplots
with the distribution from this data.
Figure 8: Test Set - Damage Distribution for the Initial
Round.
Figure 9: Test Set - Damage Distribution for the Improved
Round.
We also produced a graph comparing the obtained
data with the ground truth. Figure 10 and 11 displays
the results for the test dataset on the initial and im-
proved rounds. A qualitative analysis of the results
shows that the sets have similar distributions, rein-
forcing the RMSE parameter results.
4.1 MEW 2012 Results
As mentioned, after the first test, we also performed
predictions in another database, with different species
from the ones used in training. For this matter, we
chose the MEW 2012, containing 9745 images, from
which generated 38980 images with artificial random
An Improved Deep Learning Application for Leaf Shape Reconstruction and Damage Estimation
491
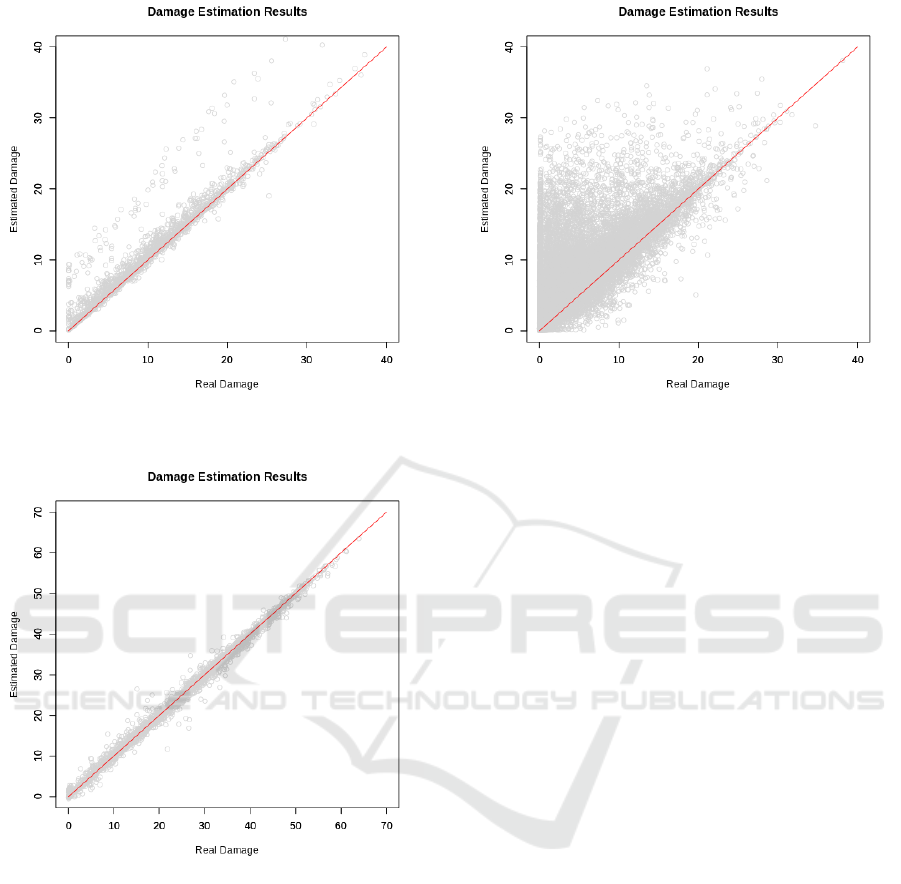
Figure 10: Test set damage estimation results for the Initial
Round.
Figure 11: Test set damage estimation results for the Im-
proved Round.
damage.
The average estimated damage in this set is
5.05%. The standard deviation for this distribution
is 4.43%. The maximum damage value in this set is
37.90%. In this case, the real damage distribution av-
erage and standard deviation are 3.93 ± 4.39%, with
a maximum value of 41.87%. The RMSE for this pre-
diction is 1.76 (± 3.02).
We also presented the graph comparing the ob-
tained data with the ground truth. Figure 12 displays
the results for the MEW 2012 dataset. As this dataset
has more species and samples, the predictions’ distri-
bution looks wider from qualitative analysis. Thus,
the RMSE result confirms that the prediction qual-
Figure 12: MEW 2012 set damage estimation results.
ity was similar, even with a dataset containing leaves
from more and untrained species.
4.2 Shape Reconstruction Results
We compared the network model’s output with the
ground truth initially generated or obtained from the
datasets to evaluate the shape reconstruction. Initially,
we evaluated the distributions for the validation and
test datasets and performed a statistical analysis to
check if the predicted and original shapes represent
different populations based on their dice coefficient
results distribution. The populations distributions pre-
sented in Figures 13, 14, and 15.
In red, we present the dice coefficient comparing
the damaged leaves with the original shapes. In blue,
we present the dice coefficient comparing the recon-
structed leaves and the original shapes. The variances
between the red and blue populations are different.
Therefore, we chose to apply Welch’s t-test to com-
pare the populations. For all the studied cases, the
p-value was lower than 2.2 × 10
−16
, indicating that
the populations mean is not equal. In other words, the
process creates different shapes that are not caused by
random events.
For the reconstructed data, the dice coefficient’s
average value in the validation set is 0.992 ± 0.008.
The average result for the test set is 0.993 ± 0.007.
The worst-case was 0.869 for the validation test,
0.912 for the test set. Finally, the average obtained
from the MEW 2012 set is 0.988 ± 0.017.
ICEIS 2021 - 23rd International Conference on Enterprise Information Systems
492
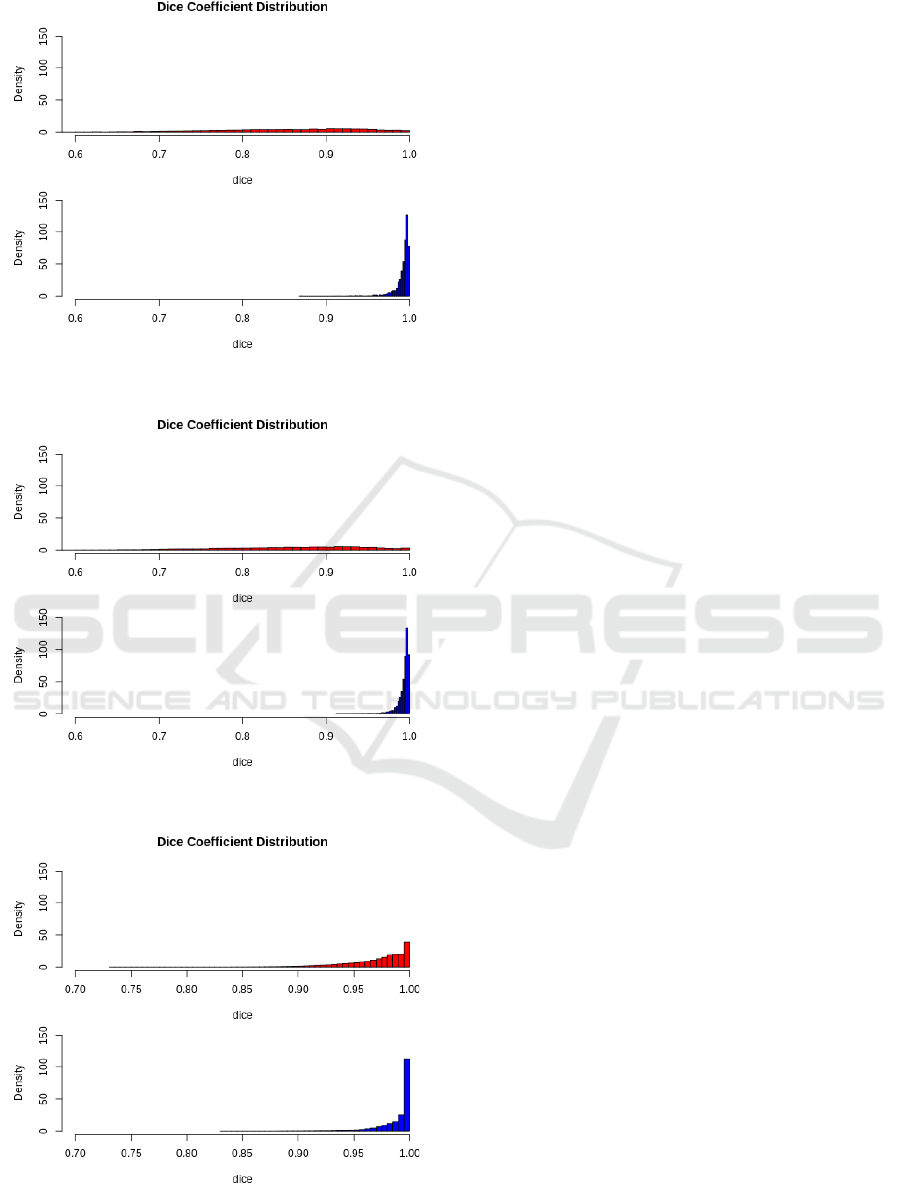
Figure 13: Dice Coefficient distribution for the validation
set - Initial Round.
Figure 14: Dice Coefficient distribution for the test set -
Improved Round.
Figure 15: Dice Coefficient distribution for the MEW 2012
set.
5 CONCLUSIONS AND
DISCUSSIONS
In this work, we proposed a novel method to estimate
the leaf damage, based on reconstructing the origi-
nal leaf shape using a U-Net based Conditional GAN.
This network was trained using a synthetic dataset
with artificial random damage and tested using ele-
ments from the original dataset and an independent
dataset.
We identified some of the most relevant papers in
the literature dealing with defoliation and leaf dam-
age estimation in the related work. Some solutions
use parametric curves to estimate the original shape,
while others try to classify the leaves or estimate dam-
age using artificial neural networks. Nevertheless, the
practical solutions present no proof of generality for
working with different species.
Before supplying the algorithms, the algorithm
preprocesses the images and converts them to masks
containing the original image’s leaf segments’ loca-
tion. For this matter, we add padding to the image to
turn its shape into a square. After this, we convert the
picture to grayscale and enhance the contrast. Finally,
we binarize it using Otsu’s method. We removed
small damage and noise in the synthetic dataset gen-
eration, using only the most significant identified con-
tour.
In this first stage, we used the FLAVIA dataset,
containing 1907 images from 33 species. To gener-
ate the synthetic database, we proposed a method to
produce artificial random damage. With this method,
we created a database containing leaves with differ-
ent damage levels. We used this data to supply deep
neural network training, as well as validation and test.
The network architecture is a Conditional GAN.
This method used a U-Net as generator architecture
and PatchGAN as the discriminator. After training
the algorithm, we compared the damaged leaf with the
original image to obtain the defoliation value ground
truth and compared them against the generated im-
ages with the predicted shape, providing the estimated
defoliation percentage.
The validation and test sets results indicate that the
damage estimation algorithm performed better than
the previous work observed in the literature. Our ref-
erence values for the RMSE parameter vary from 0.61
(± 0.99) to 0.52 (± 0.73). All the reference values
are lower than the reference parameter found in the
literature, which is 4.57 (± 5.80). Also, the dice coef-
ficient average indicates that the shape reconstruction
was accurate in most of the cases.
To test the model generalism, we applied our
method to leaves from the MEW 2012 dataset, con-
An Improved Deep Learning Application for Leaf Shape Reconstruction and Damage Estimation
493

taining 9745 images from 153 species. We also gen-
erated random synthetic damage on the leaf masks
to predict the original shape and calculate the dam-
aged area. Even with more leaves from more species,
the algorithm maintained the RMSE factor in 1.76 (±
3.02), indicating the proposed solution’s generalism.
Also, in this case, the dice coefficient average indi-
cates that the shape reconstruction was accurate.
ACKNOWLEDGMENT
The authors would like to thank CAPES, CNPq,
FAPEMIG and the Federal University of Ouro Preto
for supporting this work. This study was financed in
part by the Coordenac¸
˜
ao de Aperfeic¸oamento de Pes-
soal de N
´
ıvel Superior - Brasil (CAPES) - Finance
Code 001.
REFERENCES
Al-Saddik, H., Laybros, A., Billiot, B., and Cointault, F.
(2018). Using image texture and spectral reflectance
analysis to detect yellowness and esca in grapevines at
leaf-level. Remote Sensing, 10(4):618.
Antholzer, S., Haltmeier, M., Nuster, R., and Schwab, J.
(2018). Photoacoustic image reconstruction via deep
learning. In Photons Plus Ultrasound: Imaging and
Sensing 2018, volume 10494, page 104944U. Interna-
tional Society for Optics and Photonics.
Bangare, S. L., Dubal, A., Bangare, P. S., and Patil, S.
(2015). Reviewing otsu’s method for image thresh-
olding. International Journal of Applied Engineering
Research, 10(9):21777–21783.
Baudron, F., Zaman-Allah, M. A., Chaipa, I., Chari, N.,
and Chinwada, P. (2019). Understanding the factors
influencing fall armyworm (spodoptera frugiperda je
smith) damage in african smallholder maize fields and
quantifying its impact on yield. a case study in eastern
zimbabwe. Crop Protection, 120:141–150.
Bauer, J., Jarmer, T., Schittenhelm, S., Siegmann, B., and
Aschenbruck, N. (2019). Processing and filtering of
leaf area index time series assessed by in-situ wireless
sensor networks. Computers and Electronics in Agri-
culture, 165:104867.
Ben
´
ıtez-Malvido, J., L
´
azaro, A., and Ferraz, I. D. (2018).
Effect of distance to edge and edge interaction on
seedling regeneration and biotic damage in tropical
rainforest fragments: A long-term experiment. Jour-
nal of Ecology, 106(6):2204–2217.
C
´
ardenas, R. E., H
¨
attenschwiler, S., Valencia, R., Argoti,
A., and Dangles, O. (2015). Plant herbivory responses
through changes in leaf quality have no effect on sub-
sequent leaf-litter decomposition in a neotropical rain
forest tree community. New Phytologist, 207(3):817–
829.
Clement, A., Verfaille, T., Lormel, C., and Jaloux, B.
(2015). A new colour vision system to quantify
automatically foliar discolouration caused by insect
pests feeding on leaf cells. Biosystems Engineering,
133:128–140.
da Silva, L. A., Bressan, P. O., Gonc¸alves, D. N., Freitas,
D. M., Machado, B. B., and Gonc¸alves, W. N. (2019).
Estimating soybean leaf defoliation using convolu-
tional neural networks and synthetic images. Com-
puters and electronics in agriculture, 156:360–368.
Delabrida, S., Billinghurst, M., Thomas, B. H., Rabelo,
R. A., and Ribeiro, S. P. (2017). Design of a wear-
able system for 3d data acquisition and reconstruction
for tree climbers. In SIGGRAPH Asia 2017 Mobile
Graphics & Interactive Applications, page 26. ACM.
Delabrida, S., D’Angelo, T., Oliveira, R. A., and Loureiro,
A. A. (2016a). Building wearables for geology: An
operating system approach. ACM SIGOPS Operating
Systems Review, 50(1):31–45.
Delabrida, S., D’Angelo, T., Oliveira, R. A. R., and
Loureiro, A. A. F. (2016b). Wearable hud for eco-
logical field research applications. Mobile Networks
and Applications, 21(4):677–687.
Delgado, J. A., Kowalski, K., and Tebbe, C. (2013). The
first nitrogen index app for mobile devices: Using
portable technology for smart agricultural manage-
ment. Computers and electronics in agriculture,
91:121–123.
Dong, H., Yang, G., Liu, F., Mo, Y., and Guo, Y. (2017).
Automatic brain tumor detection and segmentation us-
ing u-net based fully convolutional networks. In an-
nual conference on medical image understanding and
analysis, pages 506–517. Springer.
Genc¸Tav, A., Aksoy, S., and
¨
ONder, S. (2012). Unsuper-
vised segmentation and classification of cervical cell
images. Pattern recognition, 45(12):4151–4168.
Gunnarsson, B., Wallin, J., and Klingberg, J. (2018). Pre-
dation by avian insectivores on caterpillars is linked
to leaf damage on oak (quercus robur). Oecologia,
188(3):733–741.
Hou, X., Shen, L., Sun, K., and Qiu, G. (2017). Deep fea-
ture consistent variational autoencoder. In 2017 IEEE
Winter Conference on Applications of Computer Vi-
sion (WACV), pages 1133–1141. IEEE.
Hyun, C. M., Kim, H. P., Lee, S. M., Lee, S., and
Seo, J. K. (2018). Deep learning for undersampled
mri reconstruction. Physics in Medicine & Biology,
63(13):135007.
Isola, P., Zhu, J.-Y., Zhou, T., and Efros, A. A. (2017).
Image-to-image translation with conditional adversar-
ial networks. In Proceedings of the IEEE conference
on computer vision and pattern recognition, pages
1125–1134.
Kozlov, M. V., Lanta, V., Zverev, V., and Zvereva, E. L.
(2015). Background losses of woody plant foliage to
insects show variable relationships with plant func-
tional traits across the globe. Journal of Ecology,
103(6):1519–1528.
Leite, M. L. d. M. V., Lucena, L. R. R. d., Cruz, M. G. d.,
S
´
a J
´
unior, E. H. d., and Sim
˜
oes, V. J. L. P. (2019).
Leaf area estimate of pennisetum glaucum by linear
dimensions. Acta Scientiarum. Animal Sciences, 41.
ICEIS 2021 - 23rd International Conference on Enterprise Information Systems
494

Liang, W.-z., Kirk, K. R., and Greene, J. K. (2018). Estima-
tion of soybean leaf area, edge, and defoliation using
color image analysis. Computers and electronics in
agriculture, 150:41–51.
Machado, B. B., Orue, J. P., Arruda, M. S., Santos, C. V.,
Sarath, D. S., Goncalves, W. N., Silva, G. G., Pistori,
H., Roel, A. R., and Rodrigues-Jr, J. F. (2016). Bi-
oleaf: A professional mobile application to measure
foliar damage caused by insect herbivory. Computers
and electronics in agriculture, 129:44–55.
Manso, G. L., Knidel, H., Krohling, R. A., and Ventura,
J. A. (2019). A smartphone application to detection
and classification of coffee leaf miner and coffee leaf
rust. arXiv preprint arXiv:1904.00742.
Martinez, F. S. and Franceschini, C. (2018). Invertebrate
herbivory on floating-leaf macrophytes at the north-
east of argentina: should the damage be taken into
account in estimations of plant biomass? Anais da
Academia Brasileira de Ci
ˆ
encias, 90(1):155–167.
Muiruri, E. W., Barantal, S., Iason, G. R., Salminen, J.-P.,
Perez-Fernandez, E., and Koricheva, J. (2019). For-
est diversity effects on insect herbivores: do leaf traits
matter? New Phytologist, 221(4):2250–2260.
Mun, J., Jang, W.-D., Sung, D. J., and Kim, C.-S.
(2017). Comparison of objective functions in cnn-
based prostate magnetic resonance image segmenta-
tion. In 2017 IEEE International Conference on Im-
age Processing (ICIP), pages 3859–3863. IEEE.
Nitsch, J., Klein, J., Dammann, P., Wrede, K., Gembruch,
O., Moltz, J., Meine, H., Sure, U., Kikinis, R., and
Miller, D. (2019). Automatic and efficient mri-us seg-
mentations for improving intraoperative image fusion
in image-guided neurosurgery. NeuroImage: Clinical,
22:101766.
Novotn
`
y, P. and Suk, T. (2013). Leaf recognition of woody
species in central europe. Biosystems Engineering,
115(4):444–452.
Oktay, O., Schlemper, J., Folgoc, L. L., Lee, M., Heinrich,
M., Misawa, K., Mori, K., McDonagh, S., Hammerla,
N. Y., Kainz, B., et al. (2018). Attention u-net: Learn-
ing where to look for the pancreas. arXiv preprint
arXiv:1804.03999.
Pontes Ribeiro, S. and Basset, Y. (2007). Gall-forming
and free-feeding herbivory along vertical gradients in
a lowland tropical rainforest: The importance of leaf
sclerophylly. Ecography, 30(5):663–672.
Prabhakar, M., Gopinath, K., Reddy, A., Thirupathi, M.,
and Rao, C. S. (2019). Mapping hailstorm damaged
crop area using multispectral satellite data. The Egyp-
tian Journal of Remote Sensing and Space Science,
22(1):73–79.
Ribeiro, S. P. and Basset, Y. (2016). Effects of sclerophylly
and host choice on gall densities and herbivory dis-
tribution in an australian subtropical forest. Austral
Ecology, 41(2):219–226.
Ronneberger, O., Fischer, P., and Brox, T. (2015). U-net:
Convolutional networks for biomedical image seg-
mentation. In International Conference on Medical
image computing and computer-assisted intervention,
pages 234–241. Springer.
Saidov, N., Srinivasan, R., Mavlyanova, R., and Qurbonov,
Z. (2018). First report of invasive south american
tomato leaf miner tuta absoluta (meyrick)(lepidoptera:
Gelechiidae) in tajikistan. Florida Entomologist,
101(1):147–150.
Sampat, M. P., Wang, Z., Gupta, S., Bovik, A. C., and
Markey, M. K. (2009). Complex wavelet structural
similarity: A new image similarity index. IEEE trans-
actions on image processing, 18(11):2385–2401.
Shamir, R. R., Duchin, Y., Kim, J., Sapiro, G., and Harel,
N. (2019). Continuous dice coefficient: a method for
evaluating probabilistic segmentations. arXiv preprint
arXiv:1906.11031.
Silva, M., Delabrida, S., Ribeiro, S., and Oliveira, R.
(2018). Toward the design of a novel wearable sys-
tem for field research in ecology. In 2018 VIII Brazil-
ian Symposium on Computing Systems Engineering
(SBESC), pages 160–165. IEEE.
Silva, M. C., Ribeiro, S. P., Delabrida, S., and Oliveira,
R. A. R. (2019). Smart-helmet development for eco-
logical field research applications. In Proceedings of
the XLVI Integrated Software and Hardware Seminar,
pages 69–80, Porto Alegre, RS, Brasil. SBC.
Turcotte, M. M., Davies, T. J., Thomsen, C. J., and Johnson,
M. T. (2014). Macroecological and macroevolution-
ary patterns of leaf herbivory across vascular plants.
Proceedings of the Royal Society B: Biological Sci-
ences, 281(1787):20140555.
Wu, S. G., Bao, F. S., Xu, E. Y., Wang, Y.-X., Chang, Y.-
F., and Xiang, Q.-L. (2007). A leaf recognition algo-
rithm for plant classification using probabilistic neural
network. In 2007 IEEE international symposium on
signal processing and information technology, pages
11–16. IEEE.
An Improved Deep Learning Application for Leaf Shape Reconstruction and Damage Estimation
495
