IDiSSC: Edge-computing-based Intelligent Diagnosis Support System
for Citrus Inspection
Mateus Coelho Silva
1,2 a
, Jonathan Crist
´
ov
˜
ao Ferreira da Silva
1 b
and Ricardo Augusto Rabelo Oliveira
2 c
1
Instituto Federal de Educac¸
˜
ao, Ci
ˆ
encia e Tecnologia de Minas Gerais, Campus Avanc¸ado Itabirito, Brazil
2
Departamento de Computac¸
˜
ao, Instituto de Ci
ˆ
encias Exatas e Biol
´
ogicas, Universidade Federal de Ouro Preto, Brazil
Keywords:
Edge Computing, Embedded Systems, Computer Vision, Machine Learning.
Abstract:
Orange and citrus agriculture has a significant economic role, especially in tropical countries. The use of
edge systems with machine learning techniques presents a perspective to improve the present techniques, with
faster tools aiding the inspection diagnostics. The usage of cost- and resource-restrictive devices to create
these solutions improves this technique’s reach capability and reproducibility. In this perspective, we propose
a novel edge-computing-based intelligent diagnosis support system performing a pseudospectral analysis to
improve the orange inspection processes. Our results indicate that traditional machine learning methods reach
over 92% accuracy, reaching 99% on the best performance technique with Artificial Neural Networks in the
binary classification stage. For multiple classes, the accuracy varies from 97% up to 98%, also reaching the
best performance with Artificial Neural Networks. Finally, the Random Forest and Artificial Neural Network
obtained the best results, considering algorithm parameters and embedded hardware performance. These
results enforce the feasibility of the proposed application.
1 INTRODUCTION
Computer vision is increasingly being inserted in pro-
duction systems, revolutionizing the quality manage-
ment in the industry (4vision, 2019). A sector of ex-
treme global importance is agribusiness. This sector
can benefit from these techniques for more modern,
economic, and safe processes. In this context, a com-
puter vision associated with edge systems becomes a
tool that enables technological advances in the field,
such as in citrus. These techniques assist in develop-
ing the industry and contribute to the optimization of
traditional sectors of the economy (da Rosa, 2019).
However, the development of an intelligent algorithm
allows identifying diseases in oranges on a large scale
(Soini et al., 2019).
The National Association of Citrus Juice Ex-
porters in Brazil explains that orange is one of the
most cultivated fruits. Also, the fruit has a substan-
tial impact on the Brazilian economy. The cultiva-
tion of citrus fruits requires a large number of work-
a
https://orcid.org/0000-0003-3717-1906
b
https://orcid.org/0000-0003-2214-397X
c
https://orcid.org/0000-0001-5167-1523
ers and generates a GDP of US$ 6.5 billion in all
countries of the production chain (Neves and Trom-
bin, 2017). Brazilian orange juice exports grew by
26.6% between July and December 2019, taking into
account previous periods. This year’s volume went
from 512,388 tons to 648,751 tons and a turnover of
US$ 967.1 million to US$ 1,104 billion (CitrusBr,
2020).
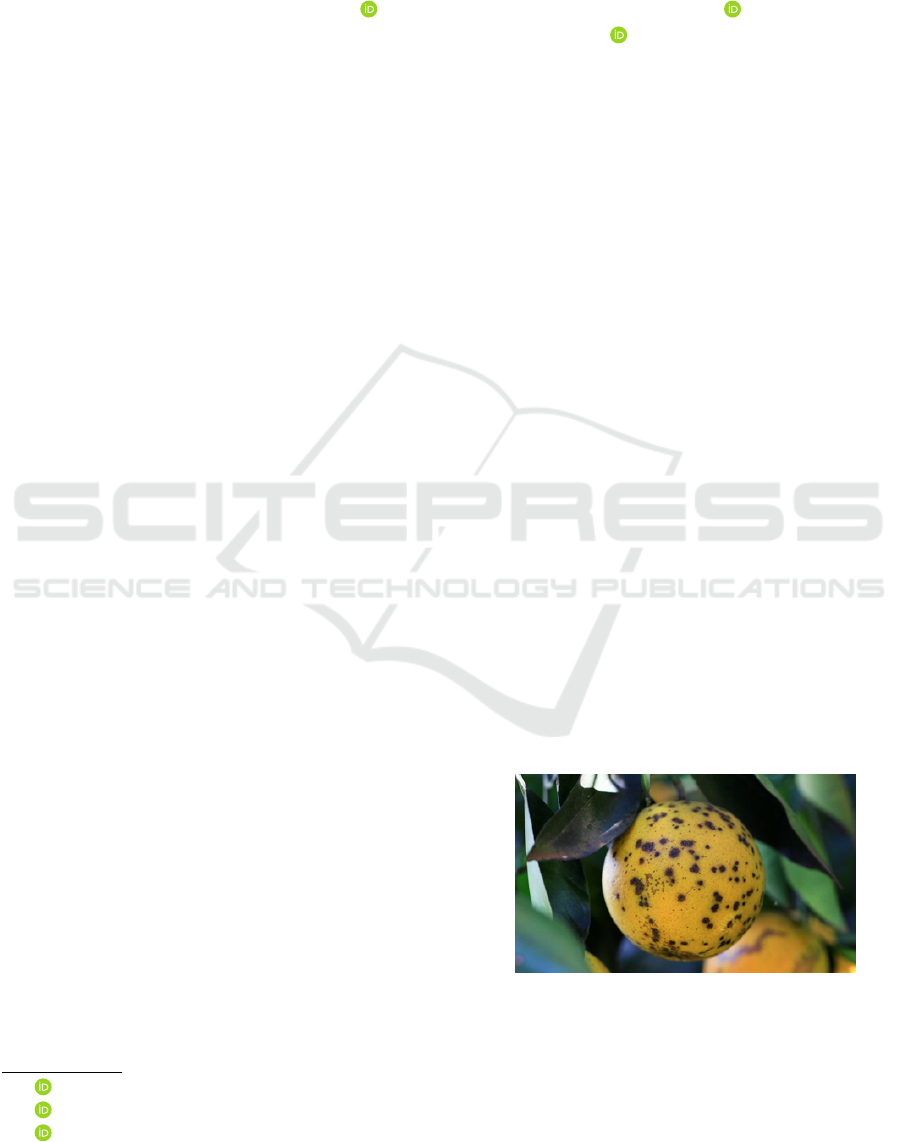
Figure 1: An example of black spot disease in an orange.
Source: (Fundecitrus, 2019).
An important aspect of improving productivity in or-
ange crops is the detection of diseases through in-
spection. Among the major diseases in orange farms,
some of the main plagues are the black spot, cit-
Silva, M., Ferreira da Silva, J. and Oliveira, R.
IDiSSC: Edge-computing-based Intelligent Diagnosis Support System for Citrus Inspection.
DOI: 10.5220/0010444106850692
In Proceedings of the 23rd International Conference on Enterprise Information Systems (ICEIS 2021) - Volume 1, pages 685-692
ISBN: 978-989-758-509-8
Copyright
c
2021 by SCITEPRESS – Science and Technology Publications, Lda. All rights reserved
685

rus canker, and Greening. These diseases’ impacts
are related to the reduction of product quality due to
fungi or bacteria, fruit damage, and production reduc-
tion due to the premature fall of fruits from the trees.
Also, commercialization becomes restricted due to
these factors that hinder production (Gottwald et al.,
2002). Another issue related to this disease is fruits
with acidic and bitter flavors and a poor appearance
on the surface. Thus, these products become unsuit-
able for sales, such as fresh fruit and juice production
(USDA APHIS, 2018). Figure 1 displays an orange
with black spot fungus contamination.
In this work, we present IDiSSC: a novel system
to aid in the diagnostics of oranges’ diseases. The
method targets its usage on constrained edge comput-
ing devices. For this matter, we perform a study of
the classifier candidates and evaluate the algorithms’
performance in different hardware configurations. Fi-
nally, we propose a system with an embedded com-
puter vision algorithm to classify the oranges and sug-
gest a diagnosis. Thus, the main contribution of this
work is:
• The proposal and proof-of-concept of a novel or-
ange disease detection diagnosis support system;
For evaluating this matter, Section 2 presents the the-
oretical references used in this work. In Section 3, we
describe the classification system’s main features for
fresh and rotten oranges. We propose the methodol-
ogy for validating aspects of this system in Section 4.
In Section 5, we display the results of an analysis of
the data and its interpretation. Finally, in Section 6,
we discuss the results obtained and a comprehensive
discussion of this work.
2 BACKGROUND
In the previous section, we presented the motivation
and main general aspects of this work. In this section,
we present some machine techniques used for image
classification. Also, we present some of the most rel-
evant related work and how they approach and differ
from our work.
2.1 Image Classification using Machine
Learning
In this work, we consider some of the supervised ma-
chine learning techniques used to classify data. It is
essential to carry out the analysis of these classifiers
for the development of this work. For this matter, we
experimented with four different techniques of super-
vised machine learning:
• Structured Vector Machine (SVM)
• K-Nearest Neighbors (KNN)
• Random Forest
• Artificial Neural Network (ANN)
The SVM is a classifier that separates classes by
creating a hyperplane, a separation line between the
two data groups. In the literature, some works use
SVM classifiers to detect leaf diseases (Padol and Ya-
dav, 2016), pest detection on strawberry greenhouses
(Ebrahimi et al., 2017), tumor detection no MRI im-
ages (Mathew and Anto, 2017), among others. As
in this work, these techniques also employ a previous
feature extraction stage.
Another method to classifying images is with the
K-Nearest Neighbors (KNN) classifier. On the liter-
ature, authors used this technique to evaluate hyper-
spectral images (Huang et al., 2016; Tu et al., 2018),
MRI images (Wasule and Sonar, 2017), varicose ul-
cer detection (Bhavani and Wiselin Jiji, 2018), among
others. These works also employ the same steps, with
a feature extraction stage, followed by the classifica-
tion using a machine learning technique.
Another important use of machine learning tech-
niques is artificial neural networks, which mimic
neurons’ functioning in the human nervous system.
Multi-Layer Perceptron (MLP) is a technique used
for image classification. Some works use this tech-
nique, such as to classify images of mammography
exam (Valarmathie1 et al., 2016), blader cystoscopic
images classification (Hashemi et al., 2020), diabetic
retinopathy fundus image classification (Shankar
et al., 2020), and many others. The deep learning neu-
ral networks can avoid the stage of feature extraction
(Silva and Siebra, 2017; C¸ alik and Demirci, 2018).
Nonetheless, these techniques still have strong hard-
ware requirements (LeCun, 2019), which is not ideal
when considering cost- and resource-restrictive sys-
tems such as edge devices.
2.2 Oranges Classification using Edge
Systems
In this section, we explore the works related to our
proposition, exposing similar and different features.
Rotondo et al. (Rotondo et al., 2018) present a system
based on an Android application and a cloud service.
It classifies the acquired image among the produced
species, using a KNN classifier with the Bag of Vi-
sual Words (BoW) as a feature vector. The method is
cloud-dependant, while our proposal realizes the pro-
cessing on the edge device.
Yin et al. (Yin et al., 2017) display a method for
identifying decayed oranges infected by fungi using
ICEIS 2021 - 23rd International Conference on Enterprise Information Systems
686
hyperspectral images. They do not use any machine
learning method. Initially, their system requires more
acquisition equipment to perform classifications, as
they provide a segmentation method based on hyper-
spectral images.
Putra et al. (Putra et al., 2018) developed a fea-
ture extraction system for modeling the quality of or-
anges. This system aims to support the classification
of a sorting system. Thus, the authors mainly explore
the feature extraction process. It also performs image
segmentation, while in this work, our result does not
need to perform this extra task.
The previous works do not present a resource-
restrictive device to perform the same task as de-
scribed in this work. Also, the authors do not com-
pare the performance with different classifiers to un-
derstand how the algorithm’s change affects the clas-
sification performance. Finally, they do not consider
the timing restrictions for each algorithm when func-
tioning in edge devices.
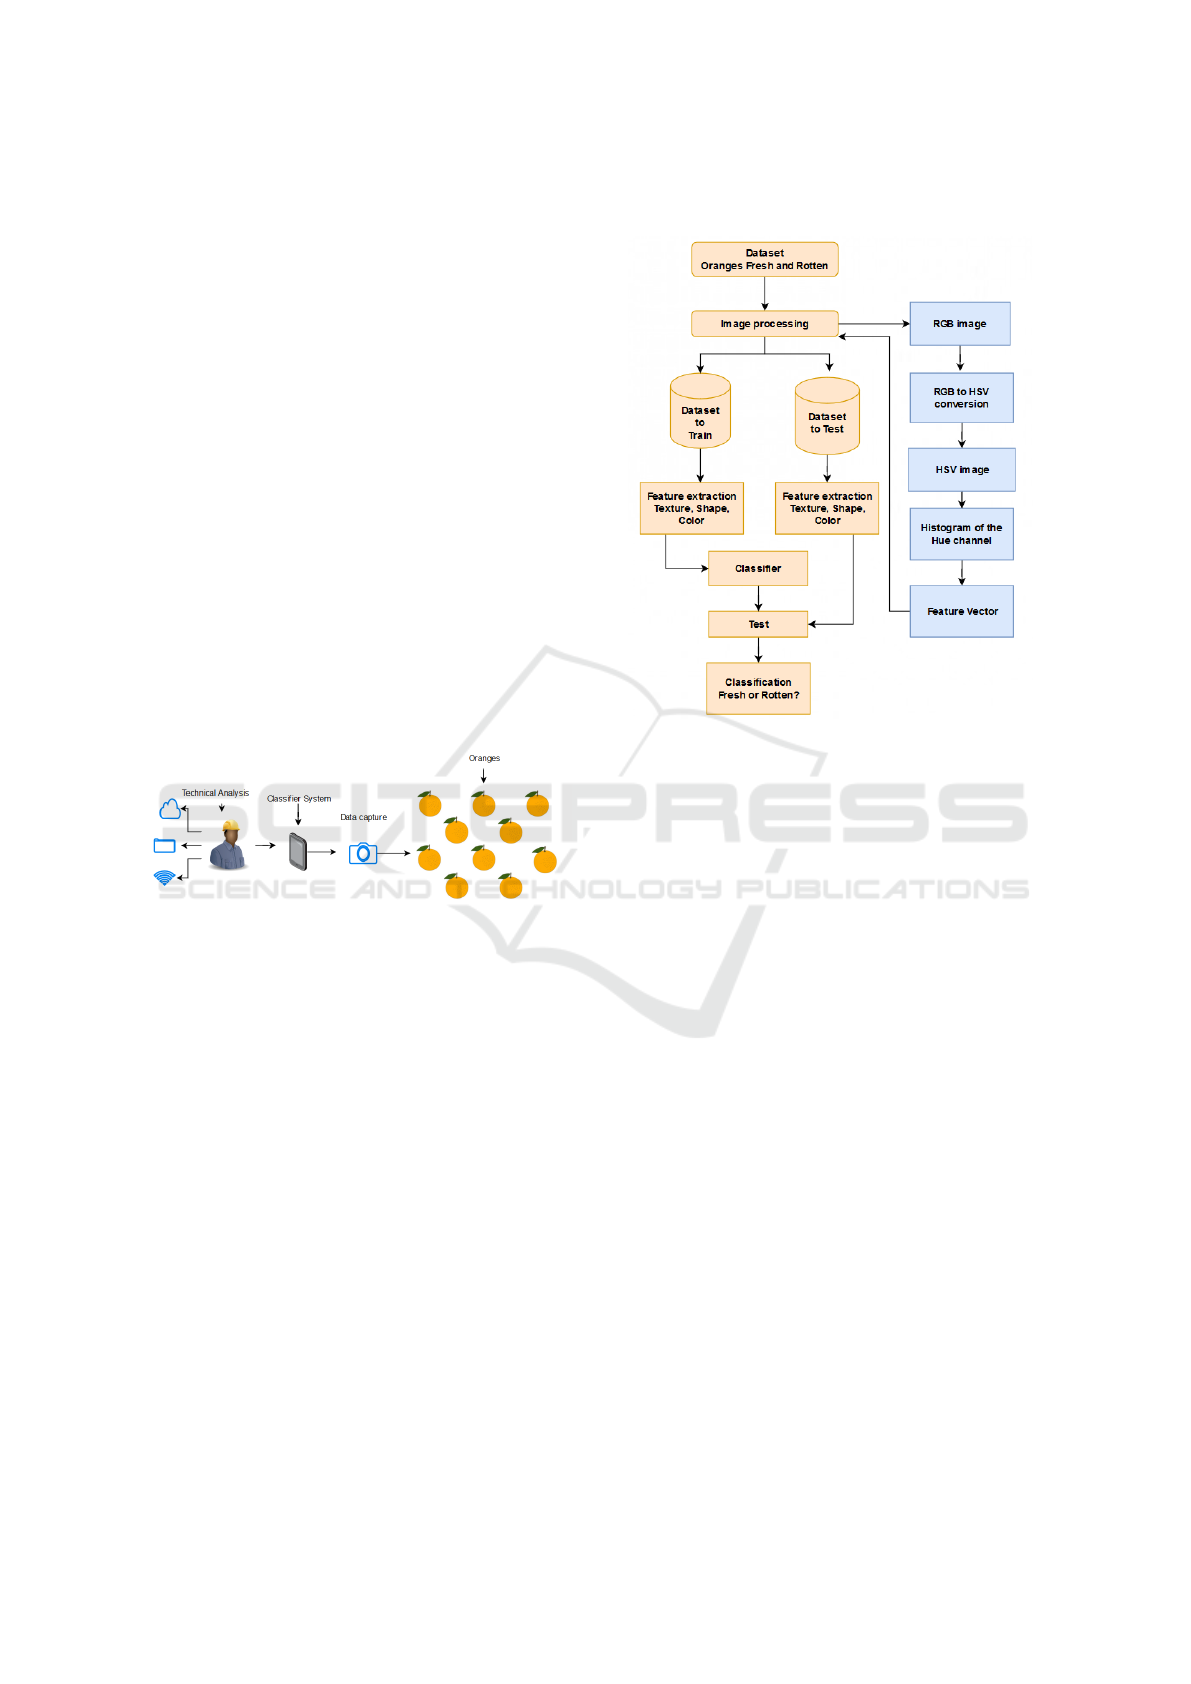
3 SYSTEM DESCRIPTION
Figure 2: Portable classification system.
In this section, we present the proposed system ar-
chitecture and its elements. Bearing in mind that
an agricultural technician needs to gather information
for analysis in the open field, we propose an orange
classification system, displayed in Figure 2. This ap-
pliance can provide the necessary information to the
technician in a short time, with greater precision. The
collected information can be sent via WLAN or stored
in a database for quality sectors.
3.1 Classification Algorithm
The core feature of the detection system is the clas-
sification algorithm based on machine learning. We
propose to use computer vision and machine learn-
ing to classify oranges (Blasco et al., 2016). After
these stages, we expect to identify healthy and fresh
oranges from the image analysis. Figure 3 displays a
schematic view of the proposed classification method
for fresh or rotten oranges. In the second stage of the
test, we also validated the classification stage for mul-
tiple classes using the same proposed technique.
Figure 3: Computer-Vision-based machine learning algo-
rithm creation process.
These classifiers use computer vision to process these
fruits. We propose to use a “pseudospectral analysis”
(Puchkov and McCarren, 2011; Puchkov et al., 2016;
Pipatnoraseth et al., 2019) on the provided images.
For this matter, we initially take the original images
and convert them to the HSV color space. From this
information, we extract the color configuration fea-
ture from the Hue channel, using it as a “pseudospec-
trum” of the composing colors. As no color space
represents the complete color spectrum from the ac-
tual acquired data, we name this a “pseudospectral
analysis”.
We then used the obtained pseudospectrum as a
feature vector to train the machine learning algo-
rithm, labeling the data in fresh and rotten classes.
The low cost of implementing the system can be ad-
vantageous compared to other existing ones, such as
the Prism-based multi-spectral cameras that empower
high-speed fruit sorting (JAI, 2020).
4 EXPERIMENTAL
METHODOLOGY
In this section, we present the experimental method-
ology to validate some aspects of the proposed solu-
tion. For this matter, we test two aspects of this sys-
tem: Algorithm classification performance compar-
IDiSSC: Edge-computing-based Intelligent Diagnosis Support System for Citrus Inspection
687

ing multiple machine learning techniques and the per-
formance of all trained algorithms in embedded hard-
ware, compared to general-purpose personal comput-
ers with various hardware configurations.
Edge systems intended for machine learning tasks
that use image extraction must have at least a CPU
and RAM and a connected camera to capture im-
ages. This task requires processing power from the
hardware as it has a significant memory expenditure.
Thus, the higher this processing capacity, the bet-
ter the system’s performance for graphical analysis
(Rong et al., 2017). A system option to perform these
simple tasks with low data volume and use of rasp-
berry pi 3B, as it has some the necessary resources
to handle image processing with low cost and energy
efficiency (Jaskolka et al., 2019).
4.1 Machine Learning Algorithm:
Development and Performance Tests
We developed different versions of the classification
algorithm. Initially, we performed the image prepro-
cessing using the OpenCV framework. In this stage,
we opened the image, converted it to the HSV color
space, extracted the histogram from the Hue chan-
nel, and used it as the “pseudospectrum” feature vec-
tor. For this matter, we used the “OpenCV Library”.
Then, we used the python library “scikit-learn” na-
tive tools to train and produce four supervised ma-
chine learning models: an SVM classifier, a KNN
classifier, a Random Forest classifier, and an MLP
(ANN) classifier. Through experiments, we came to
configurations where the KNN classifier used seven
neighbors, the Random Forest used four estimators
with a maximum depth of ten, and the ANN has four
layers of 32 neurons each.
As stated, the first tested aspect of this system is
the classification algorithm performance. For this pur-
pose, we trained our algorithm using a dataset with a
large number of single orange images (Kalluri, 2018).
This set contains separate folders for training and test-
ing. The training set contains 1466 images of fresh or-
anges and 1595 images from rotten images, with 3061
images. From this set, we randomly separated around
10% for validating the algorithm after the training
stage. The remaining 90% were used to train the al-
gorithm. The test set has 388 images from fresh or-
anges and 403 images from rotten oranges. For the
multiple class stage, we also used a Greening dataset
(Rauf et al., 2009) containing 1845 images and com-
plemented it with self-made photos of oranges with
black spot (1030) and canker (1002), using a white
light source and white paper as the background.
An essential part of evaluating methods is the
choice of metrics. There is an influence of each
metric applied to the machine learning performance.
Therefore, there may be discrepancies in comparing
values between classifiers (Kumar, 2017). We used
three standard metrics for machine learning evalua-
tion: Precision, Recall, and F1-Score.
Precision =
T P
T P + FP
(1)
Recall =
T P
T P + FN
(2)
F1-Score = 2 ×
Precision × Recall
Precision + Recall
(3)
In this context, true positive (T P) shows the samples
correctly obtained by the classifier is by the positive
class, and the true negative (T N) represents the same
with the negative class. The false positive (FP) refers
to the classifier’s result in which the model is incor-
rectly classified to the positive class and false negative
(FN) to the negative class incorrectly. Also, we used
the confusion matrix in the test dataset as a final eval-
uation metric. This matrix displays the distribution of
correct and incorrect classifications for each class.
4.2 Embedded Hardware Performance
Test
In this stage, we tested the algorithm performance
on multiple devices for this issue, using PMML as a
model persistence framework (Guazzelli et al., 2009).
For this implementation, we used the Nyoka
1
library
for model persistence and pypmml
2
to execute the test
appliance.
The repetitive algorithm path has three main
stages: (i) loading the image to the memory, (ii) ex-
tracting the image feature vector, and (iii) classifying
the image submitting the feature vector to the model.
To understand the hardware constraints when execut-
ing the proposed methods, we measured the average
time required to perform each stage. We performed
this test in three different hardware options:
• A Desktop Personal Computer, with a 9th gener-
ation i5 processor, RTX 2060 super GPU, 32GB
of RAM, with the code and data stored in an SSD.
This machine runs a Debian-based Linux Opera-
tional System.
1
https://github.com/nyoka-pmml/nyoka
2
https://pypi.org/project/pypmml/
ICEIS 2021 - 23rd International Conference on Enterprise Information Systems
688

• A Laptop Personal Computer, with an 8th gen-
eration i5 processor, onboard Intel GPU, 8GB of
RAM, with the code and data stored in an HDD.
This machine runs a Debian-based Linux Opera-
tional System.
• An Edge Computing Device, with a Quad-Core
ARMv8 processor, onboard GPU, 1GB of RAM,
with the code and data stored in an SD card. This
computer runs a standard Debian-based Linux
distribution designed for this platform.
For each system, we evaluated every produced model.
We analyzed the average time to perform each of the
three tasks and used it to estimate how many predic-
tions the system can perform per second using each
solution. For each model, we executed the experi-
ment in the whole test section of the dataset. This
subset contains 403 images from rotten oranges and
388 images of fresh oranges, totalizing 791 runs.
5 RESULTS
In this section, we present the results obtained from
the proposed tests. Also, we display our preliminary
conclusions based on each result.
5.1 Machine Learning Algorithms:
Performance Tests
The first employed tests are the machine learning met-
ric evaluation for the candidate models. As stated in
Section 4, we evaluate three metrics: Precision, Re-
call, and F1-Score. We also present the overall model
accuracy, which is the correct prediction ratio given
the whole prediction set. Table 1 displays the results
for the machine learning training process. All candi-
date algorithms presented an overall accuracy above
92%.
Table 1: Test Model - Binary Classification.
Precision Recall F1-Score Support
SVM Results:
Rotten 0.96 0.89 0.92 151
Fresh 0.90 0.96 0.93 156
Accuracy = 92.8% 307
KNN Results:
Rotten 0.95 0.99 0.97 163
Fresh 0.99 0.94 0.96 144
Accuracy = 96.7% 307
Random Forest Results:
Rotten 0.96 0.98 0.97 140
Fresh 0.98 0.96 0.97 167
Accuracy = 97.1% 307
MLP (ANN) Results:
Rotten 0.99 0.99 0.99 162
Fresh 0.99 0.99 0.99 145
Accuracy = 99.0% 307
The SVM had the worst performance with an ac-
curacy of 92.8%. The detection of rotten oranges had
a precision of 0.96, with a recall of 0.89. This result
indicates that this algorithm has a lower performance
in detecting all the samples of rotten oranges. The
F1-Score, in this case, was 0.92. The detection of
fresh oranges had a precision of 0.90, recall of 0.96,
and F1-Score of 0.93. These results indicate that the
system has a better performance when finding all true
positive samples but has a higher false-positive clas-
sification rate. In both cases, the F1-Score indicates
the same quality displayed by general accuracy.
The third best algorithm was the KNN, with an
accuracy of 96.7%. For the rotten oranges, this al-
gorithm presented a precision of 0.95, recall of 0.99,
and F1-Score of 0.97. This result indicates that the
system detects most samples from this class but in-
cludes a high amount of false-positive samples. For
the fresh oranges, the precision was 0.99, the recall
was 0.94, and the F1-score was 0.96. This result in-
dicates that this system has a small number of false-
positive samples but misses many samples that should
be classified as positive. Also, in both cases, the F1-
Score indicates the same quality displayed by general
accuracy.
The second-best performance was achieved by the
Random Forest model, with a general accuracy of
97.1%. For the rotten oranges, we observed preci-
sion of 0.96, recall of 0.98, and F1-Score of 0.97. For
the fresh oranges, the system presented a precision of
0.98, recall of 0.96, and F1-Score of 0.97. This model
is well balanced, detecting more fake rotten oranges
than fake fresh. The F1-Score corroborates these pre-
liminary conclusions.
The MLP model achieved the best performance on
this test. Its general average was 99.0%. For both
fresh and rotten orange sets, the precision, recall, and
F1-scores were 0.99. Thus, this model presented the
highest precision and balance considering all the sam-
ples.
After evaluating the validation set, we also per-
formed an experiment on the test dataset. We eval-
uated the confusion matrix for each classification
model. Tables 2, 3, 4, and 5 display the confusion
matrix for each model. The obtained results enforce
the same conclusions presented in the previous anal-
ysis.
Table 2: Confusion Matrix - SVM.
Fresh Rotten
Fresh 96.9 % 3.1 %
Rotten 18.1 % 81.9 %
In a further evaluation, we also analyzed the classifi-
IDiSSC: Edge-computing-based Intelligent Diagnosis Support System for Citrus Inspection
689
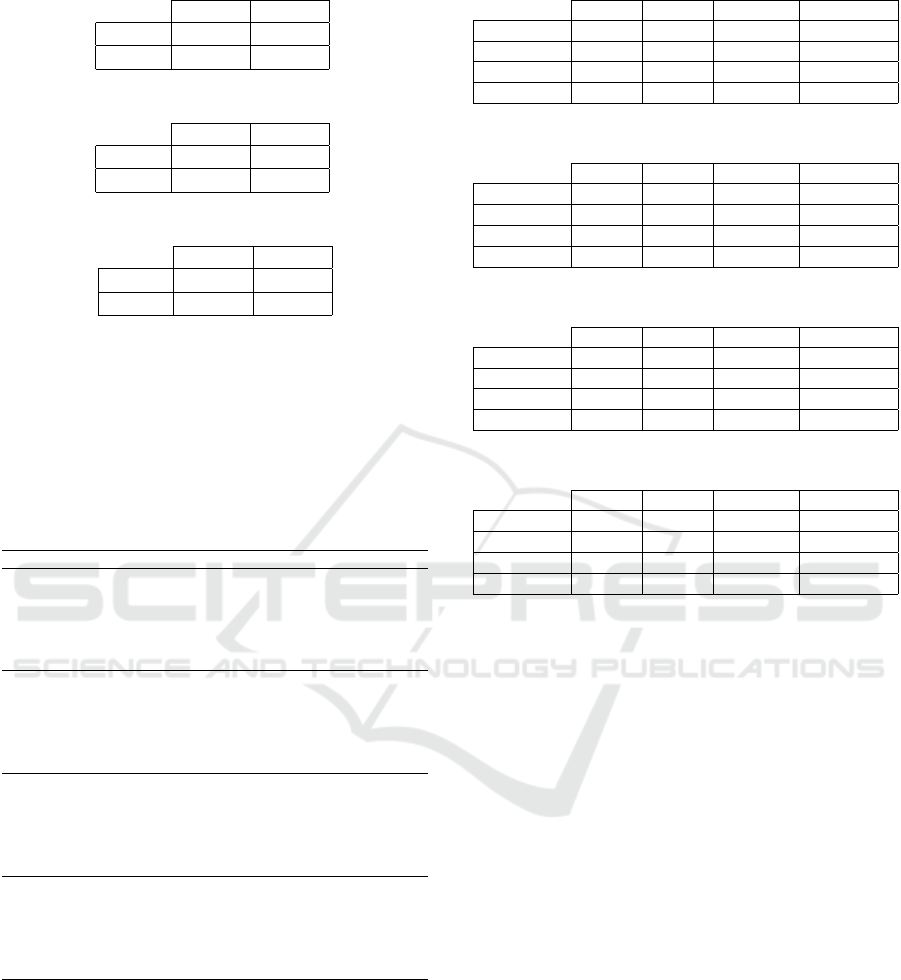
Table 3: Confusion Matrix - KNN.
Fresh Rotten
Fresh 94.6 % 5.4 %
Rotten 4.5 % 95.5 %
Table 4: Confusion Matrix - Random Forest.
Fresh Rotten
Fresh 95.1 % 4.9 %
Rotten 2.2 % 97.8 %
Table 5: Confusion Matrix - MLP (ANN).
Fresh Rotten
Fresh 99.0 % 1.0 %
Rotten 1.0 % 99.0 %
cation using multiple classes. As presented, our com-
posed dataset has images of fresh oranges, oranges
with canker, Greening, and black spot. Among the
tested methods, the artificial neural network also pre-
sented the best results for the oranges diagnosis. Ta-
ble 6 displays the obtained results on this stage of the
research.
Table 6: Models Test - Multiple Classes.
Precision Recall F1-Score Support
SVM Results:
Fresh 1.00 1.00 1.00 149
Canker 0.91 0.88 0.89 98
Greening 1.00 1.00 1.00 179
Black Spot 0.89 0.92 0.91 110
Accuracy = 96.08% 536
KNN Results:
Fresh 1.00 0.98 0.99 141
Canker 0.88 0.92 0.90 92
Greening 1.00 1.00 1.00 208
Black Spot 0.90 0.88 0.89 95
Accuracy = 96.0% 536
Random Forest Results:
Fresh 1.00 1.00 1.00 127
Canker 0.94 0.87 0.90 105
Greening 1.00 1.00 1.00 191
Black Spot 0.88 0.95 0.91 113
Accuracy = 96.26% 536
MLP(ANN) Results:
Fresh 1.00 1.00 1.00 154
Canker 0.94 0.96 0.95 96
Greening 1.00 1.00 1.00 188
Black Spot 0.96 0.94 0.95 98
Accuracy = 98.13% 536
To confirm the obtained results, we also evaluated the
confusion matrix for each classification model. Ta-
bles 7, 8, 9, and 10 display the confusion matrix for
each model. Again, the obtained results enforce the
same conclusions presented in the previous analysis.
After analyzing the software performance, we also
need to evaluate the hardware aspects.
Table 7: Confusion Matrix - SVM.
Fresh Canker Greening Black Spot
Fresh 97.0 % 1.0 % 1.0 % 1.0 %
Canker 1.0 % 88.6 % 1.0 % 10.4 %
Greening 1.0 % 1.0 % 98.3 % 1.0 %
Black Spot 1.0 % 9.27 % 1.0 % 87.8 %
Table 8: Confusion Matrix - KNN.
Fresh Canker Greening Black Spot
Fresh 97.8 % 1.0 % 1.0 % 2.1 %
Canker 1.0 % 86.7 % 1.0 % 7.4 %
Greening 1.0 % 1.0 % 98.5 % 1.0 %
Black Spot 1.0 % 11.2 % 1.0 % 89.4 %
Table 9: Confusion Matrix - Random Forest.
Fresh Canker Greening Black Spot
Fresh 97.7 % 1.0 % 1.0 % 1.0 %
Canker 1.0 % 88.7 % 1.0 % 11.38 %
Greening 1.0 % 1.0 % 98.5 % 1.0 %
Black Spot 1.0 % 5.7 % 1.0 % 86.9 %
Table 10: Confusion Matrix - MLP (ANN).
Fresh Canker Greening Black Spot
Fresh 98.0 % 1.0 % 1.0 % 1.0 %
Canker 1.0 % 92.0 % 1.0 % 4.0 %
Greening 1.0 % 1.0 % 98.4 % 1.0 %
Black Spot 1.0 % 6.0 % 1.0 % 93.8 %
5.2 Hardware Performance Test
After testing each algorithm’s performance regarding
the prediction processes, we also needed to test each
method’s performance, considering the hardware con-
straints. As presented before, in the algorithm pro-
cess, there are three main stages:
1. Acquire image;
2. Extract feature vector;
3. Predict class;
To understand the impact of each stage, we evalu-
ated the average behavior concerning three different
hardware configurations: a high-performance desk-
top, identified as DT, an average-performance per-
sonal laptop computer, identified as NB, and an edge
computing device, identified as PI3. We presented the
configuration of each element in Section 4.
• The results obtained from the SVM display that:
– The image acquisition stage took 2.0 ± 1.0 ms
in the DT machine, 2.5 ± 1.2 ms in NB ma-
chine, and 12.6 ± 5.8 ms in PI3 device;
– The feature extraction process took 0.4 ± 0.1
ms in DT, 0.5 ± 0.2 ms in NB, and 4.2 ± 1.2
ms in PI3.
ICEIS 2021 - 23rd International Conference on Enterprise Information Systems
690

– Finally, the classification stage took 13.4 ± 1.7
ms in DT, 17.3 ± 3.8 ms in NB, and 195.4 ±
11.3 in PI3;
• The results obtained from the KNN display that:
– The image acquisition stage took 2.0 ± 0.9 ms
in the DT machine, 2.5 ± 1.1 ms in NB ma-
chine, and 12.7 ± 5.7 ms in PI3 device;
– The feature extraction process took 0.4 ± 0.1
ms in DT, 0.5 ± 0.2 ms in NB, and 4.4 ± 1.4
ms in PI3.
– Finally, the classification stage took 14.6 ± 5.8
ms in DT, 19.1 ± 10.8 ms in NB, and 553.0 ±
88.6 in PI3;
• The results obtained from the Random Forest
display that:
– The image acquisition stage took 1.9 ± 0.9 ms
in the DT machine, 2.5 ± 1.1 ms in NB ma-
chine, and 12.7 ± 5.8 ms in PI3 device;
– The feature extraction process took 0.4 ± 0.1
ms in DT, 0.6 ± 0.3 ms in NB, and 4.0 ± 1.0
ms in PI3.
– Finally, the classification stage took 10.3 ± 1.6
ms in DT, 13.6 ± 3.6 ms in NB, and 123.1 ±
13.5 in PI3;
• The results obtained from the MLP (ANN) dis-
play that:
– The image acquisition stage took 2.0 ± 0.9 ms
in the DT machine, 11.5 ± 28.7 ms in NB ma-
chine, and 22.7 ± 88.8 ms in PI3 device;
– The feature extraction process took 0.4 ± 0.1
ms in DT, 1.2 ± 8.0 ms in NB, and 4.6 ± 2.5
ms in PI3.
– Finally, the classification stage took 11.0 ± 1.8
ms in DT, 18.9 ± 13.0 ms in NB, and 135.1 ±
15.1 in PI3;
6 DISCUSSION
In this work, we present a system for classifying or-
anges using an embedded application. For this mat-
ter, we proposed techniques using machine learning
functions to determine whether the fruits show signs
of infection by diseases. We also examined the main
constraints regarding the employed hardware, given
an embedded system application’s perspective.
Our system aims to aid technicians and small crop
processing plants in diagnosing diseases in the orange
crop. For this matter, we propose the usage of an em-
bedded system incorporated with a machine learning
algorithm. This appliance uses a “pseudospectrum”
extracted from the HSV color space.
To test this proposal, at first, we created multiple
algorithms with a labeled dataset containing images
from fresh and rotten oranges (Kalluri, 2018). We
considered SVM, KNN, Random Forest, and MLP as
possible candidates to integrate the solution. To test
the system feasibility, we tested the algorithms using
machine learning metrics. We also evaluated the tim-
ing constraints for checking the efficiency using vari-
ous hardware configurations, including an edge com-
puting device.
All proposed methods had over 92% accuracy
when separating the data. The Random Forest and
MLP algorithms had the best and most balanced mod-
els. The results for the classification using multiple
classes enforce the feasibility of this system using the
proposed algorithms. Also, from the hardware eval-
uation, we verified that the edge device could per-
form approximately 4.95 predictions/s with the SVM,
1.78 predictions/s using KNN, 7.63 predictions/s us-
ing the Random Forest, and 6.17 predictions/s using
the MLP.
These results enforce that the leading candidate
models for integrating the proposed solution are the
MLP and the Random Forest, given their performance
in the prediction process and predicting using the em-
bedded hardware. Future work in this context must
consider testing the system in actual field applica-
tions, integrating it into the citrus fruits’ productive
process. In this perspective, future research should
consider measuring aspects related to embedded sys-
tems, such as energy consumption and hardware re-
source profiling.
ACKNOWLEDGEMENTS
The authors would like to thank CAPES, CNPq,
Instituto Federal de Educac¸
˜
ao, Ci
ˆ
encia e Tecnolo-
gia de Minas Gerais and the Universidade Fed-
eral de Ouro Preto for supporting this work. This
study was financed in part by the Coordenac¸
˜
ao de
Aperfeic¸oamento de Pessoal de N
´
ıvel Superior -
Brasil (CAPES) - Finance Code 001.
REFERENCES
4vision (2019). Como a vis
˜
ao computacional est
´
a revolu-
cionando a gest
˜
ao de qualidade na ind
´
ustria.
Bhavani, R. and Wiselin Jiji, G. (2018). Image registration
for varicose ulcer classification using knn classifier.
IDiSSC: Edge-computing-based Intelligent Diagnosis Support System for Citrus Inspection
691

International Journal of Computers and Applications,
40(2):88–97.
Blasco, J., Cubero, S., and Molt
´
o, E. (2016). Computer
Vision Technology for Food Quality Evaluation. San
Diego: Academic Press, 2 edition.
C¸ alik, R. C. and Demirci, M. F. (2018). Cifar-10 image
classification with convolutional neural networks for
embedded systems. In 2018 IEEE/ACS 15th Interna-
tional Conference on Computer Systems and Applica-
tions (AICCSA), pages 1–2. IEEE.
CitrusBr (2020). Laranja e suco a fruta.
da Rosa, A. L. (2019). Classificac
˜
ao de imagens de frutas
utilizando aprendizado de m
´
aquina.
Ebrahimi, M., Khoshtaghaza, M., Minaei, S., and Jamshidi,
B. (2017). Vision-based pest detection based on svm
classification method. Computers and Electronics in
Agriculture, 137:52–58.
Fundecitrus (2019). Sete erros no controle da pinta preta.
Gottwald, T. R., Graham, J. H., and Schubert, T. S. (2002).
Citrus canker: the pathogen and its impact. Plant
Health Progress, 3(1):15.
Guazzelli, A., Zeller, M., Lin, W.-C., Williams, G., et al.
(2009). Pmml: An open standard for sharing models.
The R Journal, 1(1):60–65.
Hashemi, S. M. R., Hassanpour, H., Kozegar, E., and Tan,
T. (2020). Cystoscopic image classification based on
combining mlp and ga. International Journal of Non-
linear Analysis and Applications, 11(1):93–105.
Huang, K., Li, S., Kang, X., and Fang, L. (2016). Spectral–
spatial hyperspectral image classification based on
knn. Sensing and Imaging, 17(1):1.
JAI (2020). Prism-based multispectral cameras empower
high speed fruit sorting.
Jaskolka, K., Seiler, J., Beyer, F., and Kaup, A. (2019). A
python-based laboratory course for image and video
signal processing on embedded systems. Heliyon.
Kalluri, S. R. (2018). Fruits fresh and rotten for classifica-
tion apples oranges bananas.
Kumar, M. (2017). Implementing a binary classifier in
python.
LeCun, Y. (2019). 1.1 deep learning hardware: Past,
present, and future. In 2019 IEEE International
Solid-State Circuits Conference-(ISSCC), pages 12–
19. IEEE.
Mathew, A. R. and Anto, P. B. (2017). Tumor detection
and classification of mri brain image using wavelet
transform and svm. In 2017 International Conference
on Signal Processing and Communication (ICSPC),
pages 75–78. IEEE.
Neves, M. F. and Trombin, V. G. (2017). Anu
´
ario da Citri-
cultutura 2017. citrusbr, S
˜
ao Paulo, 1 edition.
Padol, P. B. and Yadav, A. A. (2016). Svm classifier based
grape leaf disease detection. pages 175–179.
Pipatnoraseth, T., Phognsuphap, S., Wiratkapun, C., Tana-
wongsuwan, R., Sajjacholapunt, P., and Shimizu, I.
(2019). Breast microcalcification visualization using
pseudo-color image processing. In 2019 12th Biomed-
ical Engineering International Conference (BME-
iCON), pages 1–5. IEEE.
Puchkov, E. et al. (2016). Image analysis in microbiology:
a review. Journal of Computer and Communications,
4(15):8.
Puchkov, E. and McCarren, M. (2011). Assessment of
the distribution of nucleic acid intercalators in yeast
cells by pseudospectral image analysis. Biophysics,
56(4):651.
Putra, K. T., Hariadi, T. K., Riyadi, S., and Chamim, A.
N. N. (2018). Feature extraction for quality modeling
of malang oranges on an automatic fruit sorting sys-
tem. In 2018 2nd International Conference on Imag-
ing, Signal Processing and Communication (ICISPC),
pages 74–78. IEEE.
Rauf, Tayyab, H., Saleem, B. A., Lali, M. I. U., khan, a.,
Sharif, M., and Bukhari, S. A. C. (2009). A citrus
fruits and leaves dataset for detection and classifica-
tion of citrus diseases through machine learning. 2.
Rong, D., Ying, Y., and Rao, X. (2017). Embedded vision
detection of defective orange by fast adaptive light-
ness correction algorithm. Computers and Electronics
in Agriculture, pages 48–59.
Rotondo, T., Farinella, G. M., Chillemi, A., Ferlito, F., and
Battiato, S. (2018). A digital countryside notebook for
smart agriculture and oranges classification. In ICETE
(1), pages 547–551.
Shankar, K., Zhang, Y., Liu, Y., Wu, L., and Chen, C.-H.
(2020). Hyperparameter tuning deep learning for di-
abetic retinopathy fundus image classification. IEEE
Access.
Silva, C. F. and Siebra, C. A. (2017). An investigation on the
use of convolutional neural network for image classi-
fication in embedded systems. In 2017 IEEE Latin
American Conference on Computational Intelligence
(LA-CCI), pages 1–6. IEEE.
Soini, C. T., Fellah, S., and Abid, M. R. (2019). Green-
ing infection detection (cigid) by computer vision and
deep learning.
Tu, B., Wang, J., Kang, X., Zhang, G., Ou, X., and Guo,
L. (2018). Knn-based representation of superpixels
for hyperspectral image classification. IEEE Journal
of Selected Topics in Applied Earth Observations and
Remote Sensing, 11(11):4032–4047.
USDA APHIS (2018). Citrus greening.
Valarmathie1, P., Sivakrithika, V., and Dinakaran, K.
(2016). Classification of mammogram masses using
selected texture, shape and margin features with mul-
tilayer perceptron classifier.
Wasule, V. and Sonar, P. (2017). Classification of brain mri
using svm and knn classifier. In 2017 Third Interna-
tional Conference on Sensing, Signal Processing and
Security (ICSSS), pages 218–223. IEEE.
Yin, S., Bi, X., Niu, Y., Gu, X., and Xiao, Y. (2017). Hyper-
spectral classification for identifying decayed oranges
infected by fungi. Emirates Journal of Food and Agri-
culture, pages 601–609.
ICEIS 2021 - 23rd International Conference on Enterprise Information Systems
692
