
SIMBIoTA: Similarity-based Malware Detection on IoT Devices
Csongor Tam
´
as
1,2 a
, Dorottya Papp
2 b
and Levente Butty
´
an
2 c
1
Ukatemi Technologies, Hungary
2
Laboratory of Cryptography and System Security (CrySyS Lab),
Department of Networked Systems and Services,
Budapest University of Technology and Economics, Hungary
Keywords:
IoT, Embedded Systems, Malware Detection, Binary Similarity, Locality Sensitive Hashing.
Abstract:
Embedded devices connected to the Internet are threatened by malware, and currently, no antivirus product
is available for them. We present SIMBIoTA, a new approach for detecting malware on such IoT devices.
SIMBIoTA relies on similarity-based malware detection, and it has a number of notable advantages: moderate
storage requirements on resource constrained IoT devices, a fast and lightweight malware detection process,
and a surprisingly good detection performance, even for new, never-before-seen malware. These features
make SIMBIoTA a viable antivirus solution for IoT devices, with competitive detection performance and
limited resource requirements.
1 INTRODUCTION
Unlike general purpose personal computers, embed-
ded devices are designed to carry out a limited set
of tasks. They are often integrated into machines or
other objects, and increasingly used to automate many
aspects of our modern life. For instance, smart ther-
mometers and remotely controlled air conditioners set
the right temperature for smart homes. Modern traf-
fic lights in intersections can sense the flow of traffic
and adjust accordingly. Patients with implantable or
wearable health-care devices can be remotely moni-
tored by medical experts. All these applications are
possible thanks to the embedded devices that imple-
ment these functionalities and to the Internet that con-
nects them; in other words, to the Internet of Things
(IoT).
Unfortunately, just like any computer, an embed-
ded IoT device can also have security weaknesses.
Insecure open ports, and default or hard-coded pass-
words allow attackers to easily access the device. It
is also technically possible to exploit vulnerabilities
in software components running on IoT devices, in-
cluding their firmware and operating system (OS),
which is often based on some embedded Linux vari-
ant. What is more, attacking IoT devices can be
a
https://orcid.org/0000-0001-8999-6016
b
https://orcid.org/0000-0002-9976-614X
c
https://orcid.org/0000-0003-4233-2559
a profitable business for criminals. Depending on
the application domain, they may handle sensitive
data about both people and companies. In addition,
the number of such devices increases exponentially.
Therefore, even if individual embedded devices are
resource constrained compared to PCs, the combined
computing power of thousands of compromised IoT
devices is non-negligible, and attackers can take ad-
vantage of that.
Consequently, the security community has ob-
served a rise in the number of viruses, worms, Tro-
jans and other types of malware targeting these de-
vices. One of the most infamous examples is Mi-
rai (Antonakakis et al., 2017), which infected hun-
dreds of thousands of IoT devices and launched one
of the largest distributed denial of service attacks ever
recorded against popular Internet-based services in
2016. The IoT threat landscape, however, includes
other malware as well, for example, Gafgyt, Tsunami,
and Dnsamp (Cozzi et al., 2020).
Generally, system administrators install antivirus
products to combat malware. These products use a
variety of techniques and heuristics to identify signs
of malicious behavior in binaries and quarantine sus-
picious files. Unfortunately, currently available an-
tivirus products for traditional IT systems have higher
resource needs than that offered by embedded IoT de-
vices. The required amount of free storage space and
memory to run these products is often measured in gi-
58
Tamás, C., Papp, D. and Buttyán, L.
SIMBIoTA: Similarity-based Malware Detection on IoT Devices.
DOI: 10.5220/0010441500580069
In Proceedings of the 6th International Conference on Internet of Things, Big Data and Security (IoTBDS 2021), pages 58-69
ISBN: 978-989-758-504-3
Copyright
c
2021 by SCITEPRESS – Science and Technology Publications, Lda. All rights reserved

gabytes. Resource constrained IoT devices, however,
do not meet these requirements. What is more, many
existing antivirus products do not even support the op-
erating systems (typically some embedded Linux or
some more exotic OS
1
) used on IoT devices. There-
fore, they could not be installed, even if a particular
IoT device met their system requirements.
Still, the threat of malware remains and must be
addressed in some manner. Currently, the most wide-
spread solution for protecting IoT devices against
malware is network-based detection (Van der Elzen
and van Heugten, 2017; Meidan et al., 2018; Goyal
et al., 2019). This approach is based on analyzing and
filtering network traffic on a gateway that is placed
between the IoT device and the Internet. Many such
gateways are available commercially, including Bit-
Defender Box
2
and Kaspersky IoT Secure Gateway
3
.
While this approach certainly reduces the storage and
computing burden on IoT devices, it is rather easy
for attackers to circumvent. For example, attackers
may try to compromise devices via secured and en-
crypted communication channels, such as TLS. Gate-
ways cannot detect such attacks, not even with deep
packet inspection, because they cannot read the con-
tents of exchanged messages. Another potential prob-
lem is that gateway based protection can be bypassed
by malware carried on mobile devices and USB sticks
that are directly connected to the IoT devices behind
the gateway.
As a result, there is a need for an antivirus solu-
tion running on the IoT devices themselves. In this
paper, we present SIMBIoTA, a novel approach to
solve this problem, with lightweight requirements for
storage, computation, and bandwidth, and with sur-
prisingly good malware detection capabilities. More
specifically, we discuss the architecture of SIMBIoTA
and evaluate its detection performance using 47 937
malware samples and 14 119 benign programs. Our
results show that SIMBIoTA achieves approximately
90% true positive detection rate on average, even for
previously unseen malware samples. Moreover, in
our experiments, its false positive detection rate was
0%. We also provide a performance comparison with
existing antivirus products for traditional IT systems,
and find that SIMBIoTA outperforms 73 out of 78 of
them.
1
https://www.g2.com/categories/iot-operating-systems
(Last accessed: Nov 25, 2020
2
https://www.bitdefender.com/box/ (Last accessed: Dec
1, 2020)
3
https://os.kaspersky.com/products/
kaspersky-iot-secure-gateway/ (Last accessed: Dec 1,
2020)
2 BACKGROUND
Before we delve into the architecture of our solution,
we provide background knowledge on malware de-
tection. Malware detection approaches can be cat-
egorized into signature-based, heuristic, and cloud-
based approaches (Aslan and Samet, 2020). In the
past, antivirus products only used signatures. A sig-
nature, in this context, is a short sequences of bytes
that uniquely identify a set of variants of a malware.
Malware detection algorithms would scan files and
search for signatures; if a signature is found in the
file, the file is considered malware. In practice, how-
ever, signature-based detection has significant disad-
vantages. First, signatures are usually created by ex-
perts, who employ reverse engineering techniques,
making signature generation a time consuming and
tedious task. Second, malware authors use a vari-
ety of techniques to evade signature-based detection:
packing, encryption, obfuscation, and code polymor-
phism. The goal of these techniques is to modify mal-
ware in such a way that its behavior remains the same
and at the same time, its binary form does not contain
the signatures antivirus products search for.
Heuristic malware detection relies on rules, cre-
ated by experts, that capture more complex static pat-
terns in malware than simple signatures do. Conse-
quently, heuristic techniques can detect a larger set
of variants of the same malware than that detected
by signatures. Yet, even this approach is unable to
cope with obfuscation techniques. In addition, both
signature-based and heuristic detection approaches
have a hard time keeping up with the rising number
of malware. The threat landscape is constantly evolv-
ing (Sophos Ltd., 2019; Check Point Software Tech-
nologies Ltd., 2020) with both new types of malware
and variations of existing malware. Both cases require
new signatures and rules to be generated constantly
and meeting this requirement poses serious scalabil-
ity challenges for antivirus companies.
Therefore, there is significant effort to automate
the detection process using machine learning (Ye
et al., 2017; Ucci et al., 2019; Gibert et al., 2020).
However, machine learning requires the use of other
technologies, transforming malware detection into an
interdisciplinary field. In order to extract features for
machine learning, static and dynamic program analy-
sis techniques are used (Soliman et al., 2017). Fea-
tures include instruction-level data, data related to
control-flow, invoked API functions and system calls,
and messages sent over the network. The feature ex-
traction step can result in thousands of features, some
of which may be redundant. In order to find and elim-
inate redundant features, data mining techniques can
SIMBIoTA: Similarity-based Malware Detection on IoT Devices
59

be used. The remaining features are then used to train
machine learning models for malware detection.
Machine learning requires lots of data, benign
and malicious samples in this case, which are usu-
ally collected from so-called intelligence networks.
Nowadays, antivirus products install a client-side
component on the users’ machines, which performs
signature-based and heuristic detection. If this client
component cannot determine whether a sample is ma-
licious or not (due to, e.g., packing or encryption),
then it sends the sample to a server, which performs
a more in-depth analysis, involving execution of the
sample in a sandbox, extracting static and behavioral
features, and using machine learning models for de-
tection. We refer to this setup as cloud-based malware
detection.
Cloud-based malware detection is very effective;
thanks to using dynamic behavior analysis, it can
even cope with advanced evasion techniques used by
malware, including obfuscation, and code polymor-
phism. Cloud-based malware detection can also be
an interesting approach for IoT devices (Sun et al.,
2017) because resource heavy analysis work is trans-
ferred to the cloud, leaving the resource constrained
IoT devices only with a lightweight client-side com-
ponent. In addition, IoT devices have Internet con-
nection, which they can use to send suspicious files
to the cloud for further analysis and remote detection.
The downside is that if IoT devices rely exclusively
on the cloud for malware detection, then they become
vulnerable when the cloud cannot be reached due to
network connection issues or ongoing attacks. In ad-
dition, submitting all suspicious files to the cloud also
raises privacy concerns in some application domains.
3 SIMBIoTA
Although the cloud-based approach for malware pro-
tection of IoT devices seems to be appealing, we do
not follow it, because the cloud in that approach is a
single point of failure: if it cannot be reached, IoT
devices remain unprotected.
Our approach, illustrated in Figure 1, is rather
similar to the traditional signature-based approach.
We rely on a large malware database maintained
by a backend server, which is continuously updated
with recent samples obtained from various sources,
such as honeypot farms, commercial malware feeds,
and public malware repositories. These sources
are collectively called the intelligence network. In
the signature-based approach, the incoming malware
samples are processed by the backend to create signa-
tures, which are then pushed to the client side. In our
approach, we replace signatures with similarity hash
values. These are pushed to the client-side antivirus
component on the IoT devices, where a lightweight
algorithm uses them to detect malware based on bi-
nary similarity. This is why we call our approach
SIMBIoTA, which stands for SIMilarity Based IoT
Antivirus. Our solution requires resource constrained
IoT devices to maintain only a small database with
a few similarity hash values instead of a myriad of
signatures, while still retaining good detection capa-
bilities, as we will show later.
3.1 Binary Similarity Hashes
In short, for similar inputs, binary similarity hash
functions output similar hash values. This stands for
our chosen method, TLSH (Oliver et al., 2013) as
well
4
. Similarity of hashes is quantified by a compar-
ison algorithm that is unique to the hashing method.
Thus, the similarity of two inputs is reflected by the
numeric output of the comparison algorithm on the
two similarity hash values computed from the original
inputs. The similarity hash generation and compari-
son algorithms do not take into account the format of
the inputs, they only consider raw sequences of bytes.
As a result, they capture the byte level similarity of
the inputs (which can be files storing programs) and
do not understand any higher level concepts (such as
instructions, in case of programs) .
There are two advantages that make similarity
hashes good candidates for replacing signatures in an
IoT antivirus solution. First, they are represented in a
very short sequence of bytes. In case of TLSH with
default parameters set, every hash can be represented
in 35 bytes. Furthermore, because of binary simi-
larity, individual hash values detect groups of similar
malware. Hence, a very small database on the IoT de-
vice is enough to detect every sample in the backend
malware database, and only a few hundred bytes need
to be transmitted to the IoT device at every update.
In addition, computing similarity hashes does not re-
quire manual work of experts, but it can be completely
automated. Another advantage of similarity hashes
is their good performance. Hash generation time is
mostly determined by the read speed of the storage
device that holds the input, and it is usually in the
range of milliseconds. Hash comparison time, on the
other hand, is solely determined by CPU speed, and it
is in the range of microseconds. As a result, scanning
a single file is completed in a few milliseconds. As
many IoT devices are constrained in terms of storage,
4
We note that our approach is not restricted to the use of
TLSH, but it can work with other similarity hash functions
as well.
IoTBDS 2021 - 6th International Conference on Internet of Things, Big Data and Security
60
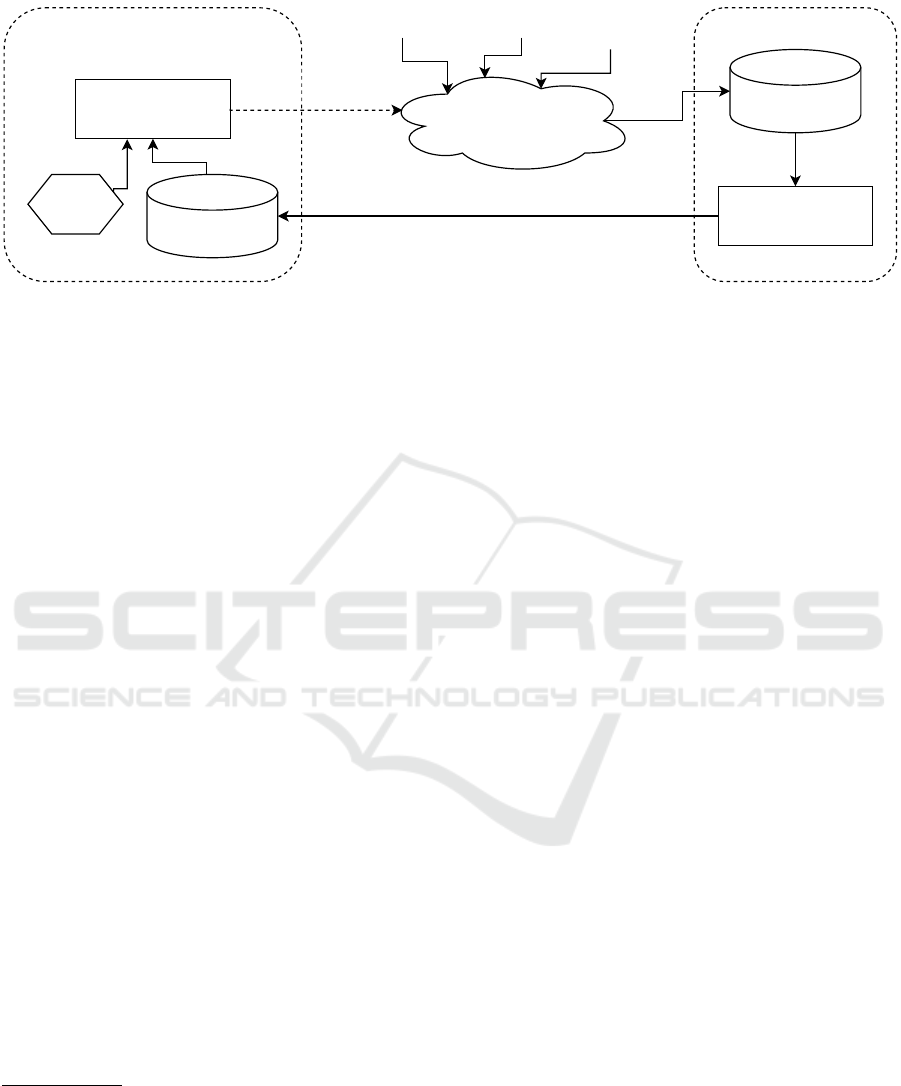
Components of the backendIoT device
Database of similarity
hashes
Binary similarity-based
detection process
Intelligence network
Malware database
Malware clustering
Executable
file
Honeypot farms
Commercial
malware feeds
Public malware
repositories
Submit suspicious /
detected samples
Figure 1: High-level overview of our proposed IoT antivirus approach.
network bandwidth, and CPU clock cycles, our goal
of using very little resources is satisfied.
3.2 Malware Analysis at the Backend
We create the malware database at the backend from
the samples submitted via the intelligence network.
Typically, thousands of samples are received on a
daily basis. In order to keep the client databases
small, we select a few samples whose TLSH hash
values are sent to client devices. We call these rep-
resentative samples because they represent a group
of similar malware samples in the backend malware
database.
One can imagine the collection of malware sam-
ples in the backend malware database as a graph,
where every node represents a sample, and two nodes
are connected, if their TLSH similarity score is be-
low
5
a selected threshold
6
. In order for client devices
to be able to detect every sample stored in the back-
end malware database, the collection of representative
samples must form a dominating set
7
for the imag-
ined graph. As producing the entire graph is not feasi-
ble (because all possible pairs of samples would need
to be compared), our solution uses a greedy online
dominating set construction algorithm. The result is
likely not a minimal dominating set, but it is still good
enough for our purposes. Our greedy algorithm is
simple: if a new sample received by the backend is
not similar to any of the samples in the current dom-
inating set, we add the new sample to the dominating
set. Otherwise we move on to the next new sample.
5
Somewhat unintuitively, a lower score means higher
similarity in case of TLSH. The lowest score is 0, mean-
ing that the two inputs are or are almost identical.
6
In our case, we use 40 as the threshold value, which we
selected by extensive empirical analysis.
7
A dominating set for a graph G = (V, E) is a subset D
of V such that every vertex not in D is adjacent to at least
one member of D.
This algorithm constructs a dominating set efficiently
for the malware database updated with the daily feeds.
The backend then pushes the TLSH hashes of the
samples newly added to the dominating set to the
client device either immediately or according to a pre-
configured update schedule (depending on some do-
main specific requirements).
3.3 Detection Process on the IoT Device
The detection process on the IoT device is invoked at
file execution events in order to prevent running ma-
licious code. If the comparison of a file’s TLSH hash
to one in the client database results in a value lower
than the selected similarity threshold, the file is quar-
antined and access to it is restricted.
There are several configuration options available
to tailor the detection process to the operator’s needs:
folders and/or files can be white listed, periodic scans
can be scheduled and the scanning process can be in-
voked on-demand. If network traffic is not restricted,
suspicious or detected files can be sent to the back-
end for more in-depth analysis (just like in the case
of cloud-based malware detection). However, if the
backend cannot be reached, malware detection on
the IoT device is still possible using the local client
database (unlike in the case of pure cloud-based mal-
ware detection).
4 EVALUATION
In order to evaluate the effectiveness and efficiency of
SIMBIoTA, we constructed an experiment that mea-
sures detection ratio as well as resource needs on the
client device. For this, we needed many malicious
and benign samples created for architectures and op-
erating systems typically used by IoT devices. In this
section, we first describe the data sets that we used,
SIMBIoTA: Similarity-based Malware Detection on IoT Devices
61

Intel 80386(36.8 %)
AArch64(0.0 %)
ARM(23.2 %)
PowerPC(5.9 %)
x86-64(5.2 %)
Renesas SH(3.7 %)
Motorola 68020(4.8 %)
SPARC(5.4 %)
MIPS(14.9 %)
ARC Cores Tangent-A5(0.0 %)
Figure 2: Distribution of collected malicious executable
files according to target architecture.
and then we introduce the setup of the experiment
and the results that we obtained. At the end of this
section, we also compare the detection capability of
SIMBIoTA to that of existing antivirus products.
4.1 Data Set
We received malware samples for our experiment
from Ukatemi Technologies, a Hungarian company
specialized in malware analysis and incident response
services. Ukatemi Technologies has a malware repos-
itory containing more than 400 million malware sam-
ples from the past 15 years. However, most of these
samples are Windows binaries, whereas variants of
Linux are more prevailing as an OS on IoT platforms.
Hence, we searched for Linux binaries (so called ELF
files) in the repository. We excluded Android re-
lated ELF files
8
from the search result, because in this
work, we are not concerned with malware developed
for personal mobile devices. The architectural distri-
bution of the search result is shown in Figure 2. From
these samples, finally we kept only those compiled
for the ARM and MIPS platforms, because these are
the most common platforms, among the ones returned
by our search, used by IoT devices. In this way, we
ended up with a malicious data set of 29 215 ARM
samples and 18 722 MIPS samples (altogether 47 937
samples), which was deemed sufficiently large for our
experiment. Manual verification of a randomly se-
lected subset of the samples confirmed that they are
indeed IoT malware.
Since we wanted to simulate accurately the evo-
lution of the knowledge in time obtained by the
backend via the reception of new samples through
the intelligence network, we needed the time of
first occurrence for each sample in our data set.
For this, we downloaded public analysis reports
8
The search returned Android related files because An-
droid is a Linux based OS and there are malware families
developed for mobile devices using Android.
AArch64(13.2 %)
x86-64(0.1 %)
ARM(28.7 %)
Tensilica Xtensa Processor(0.1 %)
MIPS(57.1 %)
No data(0.8 %)
Figure 3: Distribution of collected benign executable files
according to target architecture.
form VirusTotal
9
for every sample, and selected the
first submission date field to serve as the date of
first occurrence. The dates of first occurrence also al-
lowed us to choose a time range for our experiment.
We set the start date to January 1st, 2018, as almost
90% of our samples were submitted to VirusTotal af-
ter this date. We set the end date to September 15th,
2019, because we have plans to publish our data set
and we wanted to be sure that it contains sufficiently
aged samples (more than at least 1 year old) that are
now detected by many antivirus products.
We also needed benign binaries for measuring the
false positive ratio of SIMBIoTA. For this, we down-
loaded firmware images from the web sites of D-Link
and Ubiquiti, two vendors of IoT devices, including
images for smart power plugs, WiFi routers, and IP
cameras. We used binwalk
10
to extract executable files
from the images and the readelf
11
tool to determine
their target architecture. Figure 3 shows the architec-
tural distribution of the benign samples obtained in
this way. As our malware data set consisted of ARM
and MIPS binaries, we kept only the benign samples
developed for the ARM and MIPS platforms, and we
ended up with a benign data set of size 14 119.
4.2 Experiment Setup
As previously mentioned, real world antivirus sys-
tems continuously receive fresh malware samples
through their intelligence network and repeatedly
push database updates to client devices. In some
IoT application domains (e.g., in case of consumer
IoT), devices are always connected to the Internet
and they could be updated instantly, whereas in some
9
https://virustotal.com (Last accessed: Dec 1, 2020)
10
https://www.refirmlabs.com/binwalk/, Last accessed:
Oct 30, 2020
11
https://man7.org/linux/man-pages/man1/readelf.1.
html, Last accessed: Oct 30, 2020
IoTBDS 2021 - 6th International Conference on Internet of Things, Big Data and Security
62

other domains (e.g., in case of industrial IoT), con-
nections may be intermittent and updates must follow
strict maintenance schedules. As a middle ground,
in our experiment, we assumed that client devices re-
ceive database updates once every week. Note that
this means that the databases on IoT devices are as-
sumed to be always outdated, their latest update be-
ing roughly 3.5 days old on average, which seems
to be a reasonable assumption, accommodating also
the occasional unreachability of the backend. Con-
sequently, we divided time into one week long slots,
and we measured detection rate and database size on a
weekly basis within the time range of the experiment.
We divided the malware data set into weekly
batches based on the dates of first occurrence of the
samples. As typically only a portion of the malware
samples appearing in the wild are received by the
backend, we split every weekly batch into 2 subsets
randomly: 10% of the samples, called the intelligence
part of the batch, are received by the backend from its
intelligence network and can be incorporated into the
database sent to the client devices on the given week,
and 90% of the samples, called the wilderness part
of the batch, are not seen by the backend. The ratio
between the intelligence part and the wilderness part
is configurable. The assumption that only 10% of the
samples appearing in the wild are seen by the backend
seems to be sufficiently conservative in the sense that
a higher ratio (more knowledge) would only improve
the detection rate.
Every week, we measured the detection perfor-
mance on all the malware samples from the wilder-
ness parts of the past (i.e., before the update of the
client database) and of a 2-week period in the future
(i.e., after the update of the client database). Note that
none of these samples were previously seen by the
backend and incorporated into the client database. In
addition, samples from the future represent new mal-
ware, which the backend had no chance to see at all
yet. Our goal with measuring the detection perfor-
mance on new malware was to understand how our
approach can cope with previously unseen threats. As
the wilderness parts were chosen randomly from the
weekly batches, we repeated every measurement 12
times.
As for the benign samples, we tested all of them
in every week to see if any of them is detected erro-
neously as malware.
4.3 Results
During our experiment, we measured both the true
positive detection rate and the false positive detec-
tion rate of SIMBIoTA. Thanks to the TLSH simi-
larity threshold we set, none of our benign samples
were detected falsely as malware, meaning that our
false positive detection rate remained 0% throughout
the whole experiment.
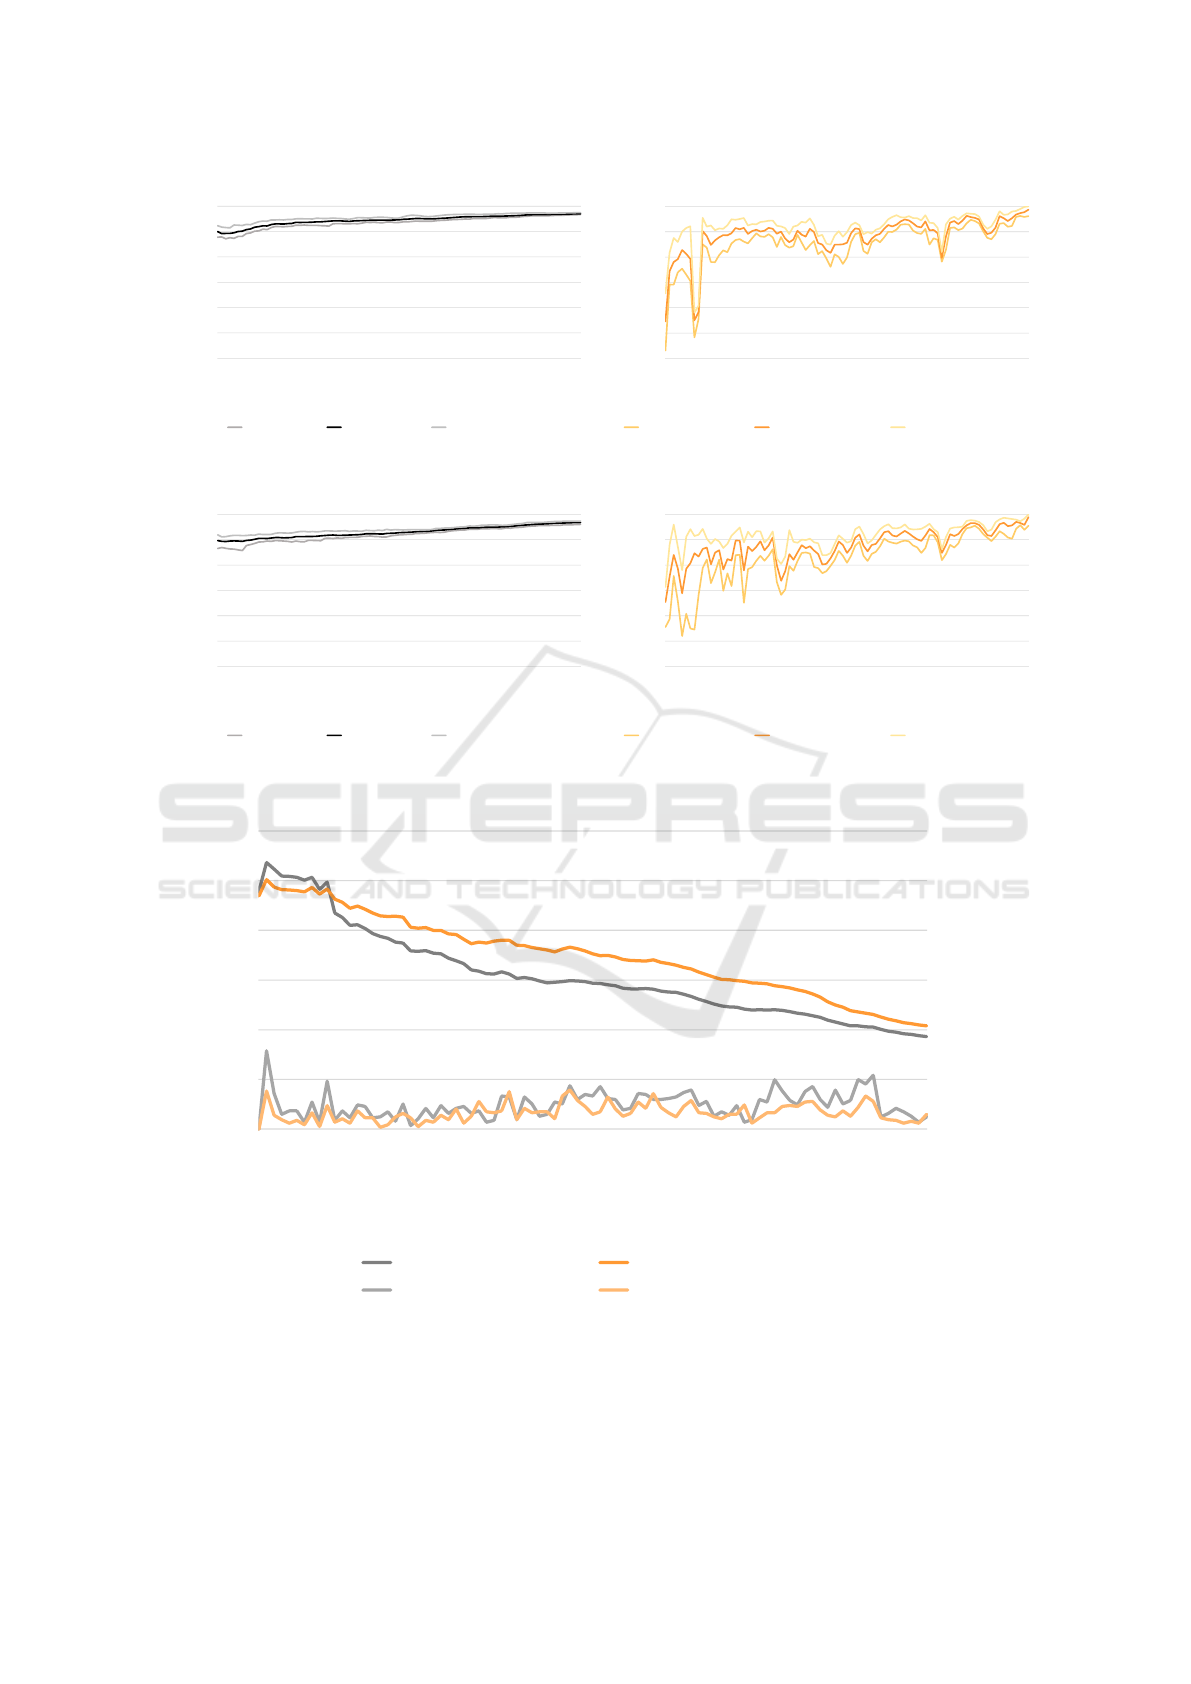
The left sides of Figures 4 and 5 show the true pos-
itive detection rates on each week for all the wilder-
ness samples of the past in the ARM and MIPS cases,
respectively. In both cases, the true positive detec-
tion rate steadily increases from a starting value of
approximately 90% on average. This result shows
that malware samples of the past are effectively de-
tected, even if not explicitly received by the backend
via the intelligence network, and independently of the
architecture they were compiled for. In addition, the
more samples are observed via the intelligence net-
work over time, the better the detection rate for previ-
ously released samples becomes. In the steady state,
SIMBIoTA achieves a true positive detection rate of
97-98% for malware released in the past.
The true positive detection rates of SIMBIoTA on
samples from the wilderness part of the 2-week future
(i.e., for never-before-seen threats) in the ARM and
MIPS cases are shown on the right sides of Figures 4
and 5, respectively. As expected, the detection rate is
somewhat lower than it is for samples from the past,
but it is still remarkably high, being between 80% and
95% on average in the steady state, again indepen-
dently of the target architecture of the samples. We
can also observe sudden drops in the curves at cer-
tain points in time, which correspond to the appear-
ance of samples from new malware families that have
never entered the intelligence network. Consequently,
these samples are not covered at all by the database of
TLSH hashes. However, as time goes on, more and
more of these samples are observed in the intelligence
network, and the database of TLSH hashes begins to
contain references to them pushing the true positive
detection rate back to the range of above 90%.
Throughout the experiment, we also measured
the amount of storage capacity necessary to hold the
client database on the IoT devices. For that, we de-
termined the number of entries that should be in the
database (i.e., the size of the dominating set computed
by the backend) and multiplied it by the TLSH hash
size of 35 (bytes). As the absolute values obtained
differ for the ARM and MIPS cases due to the differ-
ence in the total number of ARM and MIPS samples
in our data set, we show the relative size of the client
databases with respect to the size of the backend mal-
ware database in Figure 6. As we can see, the relative
size of the client database steadily decreases, and at
the end of the experiment it is around 10% both for
the ARM and the MIPS cases. This actually means
a client database size of 10 KB in the ARM case and
SIMBIoTA: Similarity-based Malware Detection on IoT Devices
63
40.00%
50.00%
60.00%
70.00%
80.00%
90.00%
100.00%
2018-01-01
2018-02-01
2018-03-01
2018-04-01
2018-05-01
2018-06-01
2018-07-01
2018-08-01
2018-09-01
2018-10-01
2018-11-01
2018-12-01
2019-01-01
2019-02-01
2019-03-01
2019-04-01
2019-05-01
2019-06-01
2019-07-01
2019-08-01
2019-09-01
True positive detection ratio for wilderness samples
of the past
Week starting at
Detected min (past) Detected mean (past) Detected max (past)
40.00%
50.00%
60.00%
70.00%
80.00%
90.00%
100.00%
2018-01-01
2018-02-01
2018-03-01
2018-04-01
2018-05-01
2018-06-01
2018-07-01
2018-08-01
2018-09-01
2018-10-01
2018-11-01
2018-12-01
2019-01-01
2019-02-01
2019-03-01
2019-04-01
2019-05-01
2019-06-01
2019-07-01
2019-08-01
2019-09-01
True positive detection ratio for wilderness samples
of the future
Week starting at
Detected min (next two weeks) Detected mean (next two weeks) Detected max (next two weeks)
Figure 4: True positive detection rate of SIMBIoTA on the ARM platform each week for wilderness samples of the past (left)
and of the 2-week future (right).
40.00%
50.00%
60.00%
70.00%
80.00%
90.00%
100.00%
2018-01-01
2018-02-01
2018-03-01
2018-04-01
2018-05-01
2018-06-01
2018-07-01
2018-08-01
2018-09-01
2018-10-01
2018-11-01
2018-12-01
2019-01-01
2019-02-01
2019-03-01
2019-04-01
2019-05-01
2019-06-01
2019-07-01
2019-08-01
2019-09-01
True positive detection ratio for wilderness samples
of the past
Week starting at
Detected min (past) Detected mean (past) Detected max (past)
40.00%
50.00%
60.00%
70.00%
80.00%
90.00%
100.00%
2018-01-01
2018-02-01
2018-03-01
2018-04-01
2018-05-01
2018-06-01
2018-07-01
2018-08-01
2018-09-01
2018-10-01
2018-11-01
2018-12-01
2019-01-01
2019-02-01
2019-03-01
2019-04-01
2019-05-01
2019-06-01
2019-07-01
2019-08-01
2019-09-01
True positive detection ratio for wilderness samples
of the future
Week starting at
Detected min (next two weeks) Detected mean (next two weeks) Detected max (next two weeks)
Figure 5: True positive detection rate of SIMBIoTA on the MIPS platform each week for wilderness samples of the past (left)
and of the 2-week future (right).
0.00 KB
0.10 KB
0.20 KB
0.30 KB
0.40 KB
0.50 KB
0.60 KB
0.70 KB
0.80 KB
0.90 KB
1.00 KB
0.00%
5.00%
10.00%
15.00%
20.00%
25.00%
30.00%
2018-01-01
2018-02-01
2018-03-01
2018-04-01
2018-05-01
2018-06-01
2018-07-01
2018-08-01
2018-09-01
2018-10-01
2018-11-01
2018-12-01
2019-01-01
2019-02-01
2019-03-01
2019-04-01
2019-05-01
2019-06-01
2019-07-01
2019-08-01
2019-09-01
Size of update for database of TLSH hashes
Ratio of size of dominating set to size of graph
Week starting at
Cover ratio (mean, ARM) Cover ratio (mean, MIPS)
Size of update (mean, ARM) Size of update (mean, MIPS)
Figure 6: Size of dominating set to size of graph and the size of updates to the client database for both architectures.
IoTBDS 2021 - 6th International Conference on Internet of Things, Big Data and Security
64

6.5 KB in the MIPS case. Figure 6 also shows the size
of updates on average to be sent each week to the IoT
devices. Throughout our experiment, this update size
remains under 200 bytes both for the ARM and for
the MIPS cases.
4.4 Comparison with Existing Antivirus
Products
It is also interesting to compare the detection per-
formance of SIMBIoTA to that of existing antivirus
products when facing new samples. In order to do
that, we queried VirusTotal for its analysis reports
produced for the samples in our malware data set.
Each analysis report of VirusTotal contains a time-
stamp of when the analysis was executed and the de-
cisions of a set of antivirus products on whether the
sample in question is a malware or not. A given
sample may have multiple analysis reports available,
generated at different times, and containing the (po-
tentially differing) verdicts produced by the antivirus
products at those points in time. For each sample
in our data set, we considered the earliest analysis
report that we could obtain. For 60% of the sam-
ples, the date of the earliest report coincided with the
first submission date. For the remaining 40%,
the report that we could obtain was generated after
the first submission date.
Our comparison methodology was the following:
for each sample s and for each antivirus product AV,
we checked whether AV detected s as malware at the
time t when the first analysis report of s was pro-
duced, and whether SIMBIoTA would have detected s
as malware assuming that the client database available
to IoT devices was last updated in the week before t.
Note that in this way, we gave advantage to the exist-
ing antivirus products in that 40% of the cases when
the earliest analysis report was produced after the date
of first submission, because those samples may not
have been entirely new to the existing products when
they made the decision recorded in the earliest report.
In addition, we did not consider the false positive de-
tection rates of existing products, therefore, a product
could have achieved 100% detection rate by detecting
any binary submitted to it as malware. We counted
how many of the samples would have been detected
as malware in this way by the existing products and
by SIMBIoTA. As the wilderness part of the samples
was chosen randomly for SIMBIoTA, we repeated ev-
ery measurement 12 times.
The collected analysis reports contain verdicts
from 78 antivirus products: 48 detected at least one
sample in our data set of ARM and MIPS samples,
30 detected none of them. The exact results of the
comparison can be found in the Appendix. In the
case of ARM samples, SIMBIoTA outperforms 70
existing antivirus products, some with magnitudes of
better performance. Only 8 existing antivirus prod-
ucts have better performance than our proposed so-
lution; however, by only a small margin (SIMBIoTA
performs only between 1.17% and 5.12% worse than
these products). Performance comparison yields sim-
ilar results for MIPS samples: SIMBIoTA outper-
forms 73 existing antivirus products, again some with
magnitudes of better performance. Only 5 existing
antivirus products have better performance for MIPS
samples, but again, SIMBIoTA’s performance is only
slightly worse (between 0.32% and 6.36%). We em-
phasize again that existing antivirus products use sig-
nature databases that are orders of magnitude larger
than our client database stored on IoT devices. Hence,
SIMBIoTA provides a much better trade-off between
effectiveness and resource efficiency than existing an-
tivirus products do.
5 RELATED WORK
Researchers have realized that IoT devices need pro-
tection against malware, and also pointed out that
traditional antivirus solutions cannot be applied di-
rectly to solve the problem. The main reason for tra-
ditional solutions being inappropriate in the IoT set-
ting is that they use lots of resources due to the ever
growing number of malware signatures, which need
to be stored on the resource constrained IoT devices
and updated at very high frequency to provide effec-
tive protection. Hence, research focused on reduc-
ing the resource needs of the devices by compacting
the signature database stored on them or by moving
from signature-based detection to machine learning
based approaches. The latter approach requires IoT
devices to store only some pre-trained model, which
typically needs much less storage space than signa-
ture databases do. In addition, such machine learning
based detection methods may be able to detect pre-
viously unseen malware; however, at the same time,
they may miss some known samples due to inher-
ent limitations of machine learning based classifiers.
Another approach is to detect malware in the net-
work traffic before they reach the IoT devices (Mei-
dan et al., 2018; Goyal et al., 2019). However, as
SIMBIoTA does not rely on network traffic analysis,
we do not review papers of this approach here.
In (Abbas and Srikanthan, 2017), the authors pro-
pose a signature based malware detection method for
IoT devices, and try to reduce the resource needs for
storing signatures on IoT devices by ensuring that sig-
SIMBIoTA: Similarity-based Malware Detection on IoT Devices
65

natures match a group of malware instead of individ-
ual samples. However, the signatures are extracted
by observing the dynamic behavior of the malware
samples while executing in a sandbox. This approach
has multiple problems. First, an off-line backend sys-
tem needs to dynamically analyze each new sample,
which does not really scale, because tens of thou-
sands of samples may arrive every day. In addition,
samples may evade observation during dynamic anal-
ysis, which results in inaccurate signatures. And fi-
nally, this approach requires the IoT device to monitor
the execution of programs in order to extract dynamic
features at run-time that are matched against the sig-
nature database, which results in performance degra-
dation, if at all possible on low cost, microcontroller
based devices.
In (Su et al., 2018), the authors propose to use a
light-weight convolutional neural network on IoT de-
vices to classify files as malicious or benign. The neu-
ral network is trained off-line on the gray-scale im-
age representation of the files in a training set. The
trained neural network is then sent to the IoT devices,
which only need to produce the gray-scale image of
each file to be checked and to feed it to the neural net-
work for malware detection. Producing the gray-scale
image representation of binary files is trivial, and the
resources to store the neural network and use it for
malware detection can also be very limited. Hence,
this approach seems to be really promising; the down-
side may be the potentially weak detection capabil-
ity. Unfortunately, in (Su et al., 2018), the authors
demonstrated their approach and measured its perfor-
mance only in a limited experiment, where they tried
to distinguish benign Linux programs from two mal-
ware families, Mirai and Gafgyt. It remains an open
question how robust the results would be for a much
larger population of malware. In addition, as the au-
thors themselves note, this approach also has difficul-
ties with obfuscated malware.
Paper (Takase et al., 2020) also uses a machine
learning based approach for malware detection, but
instead of static features such as the gray-scale im-
age representation of files, it relies on dynamic fea-
tures, notably processor data observed at run-time.
The authors propose to train a random forest classi-
fier on execution trace data such as processor register
values, address of memory accessed, cache hit rate,
types of executed instructions, and instruction dis-
tance, which records the number of instructions since
a given type of instruction was last executed. Unfor-
tunately, a separate classifier is needed for each mal-
ware to be detected, which does not seem to be a scal-
able approach. In addition, the authors implemented
a proof-of-concept prototype of the approach only on
QEMU, which is a processor emulator system, but the
paper remains inconclusive on whether the approach
can also be implemented effectively on real devices.
Paper (Shobana and Poonkuzhali, 2020) is similar
to paper (Abbas and Srikanthan, 2017) in collecting
system call traces via dynamic analysis of samples,
but it uses a recurrent neural network for classification
of malicious and benign files. This approach has the
same weaknesses as the one proposed in (Abbas and
Srikanthan, 2017), namely, it requires expensive dy-
namic analysis of a large number of samples to build
the classifier, which leads to scalability problems, and
it requires the IoT device to monitor the execution of
programs, which may lead to performance degrada-
tion.
Yet another machine learning based approach is
presented in (Dovom et al., 2019), where opcode se-
quences are used as features and fuzzy and fast fuzzy
pattern trees are used as classification methods. The
paper does not discuss whether feature extraction is
performed statically or dynamically (i.e., during ex-
ecution). In addition, while the authors mention that
fuzzy pattern trees tend to produce compact models,
the exact model size is not discussed in the paper, and
the proposed method is evaluated only in terms of de-
tection performance, but not in terms of resource con-
sumption on the IoT device.
Paper (HaddadPajouh et al., 2018) also uses op-
code n-grams as features, but it relies on a recurrent
neural network for malware detection. Here, features
are extracted statically, which scales better than dy-
namic feature extraction. The authors claim a rather
high detection accuracy, but the experiment was car-
ried out on a very small dataset containing only 280
malware and 271 benign files. In addition, resource
consumption of the approach on the IoT device was
not evaluated at all.
DeepPower (Ding et al., 2020) is also based on
deep learning, but the novelty in this approach is that
it uses power side-channel signals as features, rather
than static or dynamic properties of program files.
However, observing power signals of the IoT device
requires additional hardware either in the device it-
self or embedded within its connection to the power
supply (if it is externally powered). The observed
signal properties can then be processed locally or re-
motely, although the required processing seems to be
quite heavy weight, which suggests that the remote
processing scenario is more likely. While the idea
of DeepPower is intriguing, and its non-intrusive de-
tection capability is appealing, it has a big disadvan-
tage with respect to malware detection based on file
features: a separate detection model must be trained
for each and every type of IoT device, as the model
IoTBDS 2021 - 6th International Conference on Internet of Things, Big Data and Security
66

strongly depends on the physical properties of the de-
vices. This may lead to practical problems, such as no
support for rare device types.
We finish the overview of related work with
CloudEyes (Sun et al., 2017), which is a hybrid ap-
proach that uses lightweight scanning on the IoT de-
vice and also relies on a cloud-based back-end sys-
tem for more detailed analysis. The main idea of
CloudEyes is to represent malware signatures effi-
ciently as so called reversible sketches, produced by
an aggregation method that maps diverse data streams
into uniform vectors. These sketches dramatically
reduce the needed storage capacity on IoT devices,
but the downside is that definitive detection is no
longer possible on the client side. Instead, when a
file is deemed suspicious after matching against the
sketches, its sketch coordinates must be uploaded to
the cloud-based back-end system in order to find an
exact matching signature. While the authors of (Sun
et al., 2017) carefully designed their scheme to mini-
mize bandwidth consumption, CloudEyes still relies
on interacting with the cloud when checking each
scanned file, which results in delay and it can fail if
the back-end is unavailable.
Compared to all these approaches, SIMBIoTA
does not rely on complicated machine learning mod-
els, it is exclusively based on static file analysis, it
uses very fast computations, and its storage needs are
moderate too.
6 CONCLUSIONS
Embedded devices connected to the Internet, called
IoT devices, increasingly face the threat of malware.
In traditional IT systems, this threat is mitigated by
antivirus products that scan executables and quaran-
tine files which bear signs of malicious code. Unfor-
tunately, currently available antivirus products either
do not support IoT devices or have too demanding
system requirements for them.
In light of this problem, we presented a novel ap-
proach for malware detection on IoT devices that is
lightweight enough to fit their resource constraints.
Our approach is called SIMBIoTA, because it relies
on similarity-based malware detection. SIMBIoTA
has a number of notable advantages: First, the client
database holding TLSH hashes for binary similarity-
based malware detection is small enough to be stored
on a wide range of IoT devices. Second, the detec-
tion process running on the IoT devices is lightweight
and fast. This is, in part, thanks to the small client
database; in addition, the speed of TLSH hash compu-
tations and TLSH similarity score calculations is also
a contributing factor. Last, the fact that the database
creation process is based on selecting a dominating
set of the graph representing the malware samples
known to the backend ensures that all samples pre-
viously observed by the backend are detected by the
IoT devices.
We evaluated the performance of SIMBIoTA on
47 937 malware samples and 14 119 benign files, and
found that it achieved approximately 90% true posi-
tive detection rate on average, even for never-before-
seen malware samples, and 0% false positive rate. We
also compared SIMBIoTA to existing antivirus prod-
ucts for traditional IT systems and observed that its
detection performance is better than 73 out of 78 ex-
isting products. Thus, we conclude that it is indeed
possible to develop a viable antivirus solution for IoT
devices, with competitive detection performance and
limited resource requirements.
We must note, however, that similarly to all mal-
ware detection approaches that do not execute sam-
ples, binary similarity-based malware detection faces
challenges as well, when analyzing obfuscated or en-
crypted samples. These will form smaller similarity
groups in the graph constructed by the backend (be-
cause their similarity is more difficult to capture) and
their detection will be more sensitive to the intelli-
gence network sample feed.
ACKNOWLEDGEMENTS
The presented work was carried out within the SETIT
Project (2018-1.2.1-NKP-2018-00004), which has
been implemented with the support provided from
the National Research, Development and Innovation
Fund of Hungary, financed under the 2018-1.2.1-NKP
funding scheme.
The malware dataset and the support provided by
Ukatemi Technologies for the research presented in
this paper are also kindly acknowledged.
The authors are grateful to Gergely
´
Acs, Gergely
Bicz
´
ok, and M
´
at
´
e Horv
´
ath for reading the manuscript
and providing valuable comments that helped improv-
ing the paper. The authors would also like to thank
Zolt
´
an Iuhos for spotting an embarrassing mistake in
an earlier version of the paper.
REFERENCES
Abbas, M. F. B. and Srikanthan, T. (2017). Low-complexity
signature-based malware detection for IoT devices. In
Batten, L., Kim, D. S., Zhang, X., and Li, G., editors,
SIMBIoTA: Similarity-based Malware Detection on IoT Devices
67

Applications and Techniques in Information Security,
pages 181–189, Singapore. Springer Singapore.
Antonakakis, M., April, T., Bailey, M., Bernhard, M.,
Bursztein, E., Cochran, J., Durumeric, Z., Halderman,
J. A., Invernizzi, L., Kallitsis, M., Kumar, D., Lever,
C., Ma, Z., Mason, J., Menscher, D., Seaman, C., Sul-
livan, N., Thomas, K., and Zhou, Y. (2017). Under-
standing the Mirai botnet. In 26th USENIX Security
Symposium (USENIX Security 17), pages 1093–1110,
Vancouver, BC. USENIX Association.
Aslan, O. A. and Samet, R. (2020). A comprehensive re-
view on malware detection approaches. IEEE Access,
8:6249–6271.
Check Point Software Technologies Ltd. (2020). Cy-
ber security report. https://www.ntsc.org/assets/
pdfs/cyber-security-report-2020.pdf, Last accessed:
26.10.2020.
Cozzi, E., Vervier, P.-A., Dell’Amico, M., Shen, Y., Bigle,
L., and Balzarotti, D. (2020). The tangled genealogy
of IoT malware. In Annual Computer Security Appli-
cations Conference (ACSAC2020), Austin, USA. At
the time of writing (Nov 18, 2020), the paper has been
accepted to the conference but not yet published. The
authors made the paper available to the public.
Ding, F., Li, H., Luo, F., Hu, H., Cheng, L., Xiao, H.,
and Ge, R. (2020). DeepPower: Non-intrusive and
deep learning-based detection of IoT malware using
power side channels. In Proceedings of the 15th ACM
Asia Conference on Computer and Communications
Security, ASIA CCS ’20, page 33–46, New York, NY,
USA. Association for Computing Machinery.
Dovom, E. M., Azmoodeh, A., Dehghantanha, A., Newton,
D. E., Parizi, R. M., and Karimipour, H. (2019). Fuzzy
pattern tree for edge malware detection and catego-
rization in IoT. Journal of Systems Architecture, 97:1
– 7.
Gibert, D., Mateu, C., and Planes, J. (2020). The rise of
machine learning for detection and classification of
malware: Research developments, trends and chal-
lenges. Journal of Network and Computer Applica-
tions, 153:102526.
Goyal, M., Sahoo, I., and Geethakumari, G. (2019). Http
botnet detection in IoT devices using network traffic
analysis. In 2019 International Conference on Recent
Advances in Energy-efficient Computing and Commu-
nication (ICRAECC), pages 1–6.
HaddadPajouh, H., Dehghantanha, A., Khayami, R., and
Choo, K.-K. R. (2018). A deep recurrent neural net-
work based approach for Internet of Things malware
threat hunting. Future Generation Computer Systems,
85:88 – 96.
Meidan, Y., Bohadana, M., Mathov, Y., Mirsky, Y., Shab-
tai, A., Breitenbacher, D., and Elovici, Y. (2018). N-
BaIoT — network-based detection of IoT botnet at-
tacks using deep autoencoders. IEEE Pervasive Com-
puting, 17(3):12–22.
Oliver, J., Cheng, C., and Chen, Y. (2013). TLSH – A Lo-
cality Sensitive Hash. In 2013 Fourth Cybercrime and
Trustworthy Computing Workshop, pages 7–13, Syd-
ney NSW, Australia. IEEE.
Shobana, M. and Poonkuzhali, S. (2020). A novel ap-
proach to detect IoT malware by system calls using
deep learning techniques. In 2020 International Con-
ference on Innovative Trends in Information Technol-
ogy (ICITIIT), pages 1–5.
Soliman, S. W., Sobh, M. A., and Bahaa-Eldin, A. M.
(2017). Taxonomy of malware analysis in the IoT.
In 2017 12th International Conference on Computer
Engineering and Systems (ICCES), pages 519–529.
Sophos Ltd. (2019). Sophoslabs 2019 Threat Report.
https://www.sophos.com/en-us/medialibrary/pdfs/
technical-papers/sophoslabs-2019-threat-report.pdf,
Last accessed: 26.10.2020.
Su, J., Vasconcellos, D. V., Prasad, S., Sgandurra, D., Feng,
Y., and Sakurai, K. (2018). Lightweight classifica-
tion of IoT malware based on image recognition. In
2018 IEEE 42nd Annual Computer Software and Ap-
plications Conference (COMPSAC), volume 02, pages
664–669.
Sun, H., Wang, X., Buyya, R., and Su, J. (2017). Cloudeyes:
Cloud-based malware detection with reversible sketch
for resource-constrained internet of things (IoT) de-
vices. Software: Practice and Experience, 47(3):421–
441.
Takase, H., Kobayashi, R., Kato, M., and Ohmura, R.
(2020). A prototype implementation and evaluation
of the malware detection mechanism for IoT devices
using the processor information. International Jour-
nal of Information Security, 19.
Ucci, D., Aniello, L., and Baldoni, R. (2019). Survey of ma-
chine learning techniques for malware analysis. Com-
puters & Security, 81:123 – 147.
Van der Elzen, I. and van Heugten, J. (2017). Techniques for
detecting compromised IoT devices. Technical report,
University of Amsterdam.
Ye, Y., Li, T., Adjeroh, D., and Iyengar, S. S. (2017). A
survey on malware detection using data mining tech-
niques. ACM Comput. Surv., 50(3).
IoTBDS 2021 - 6th International Conference on Internet of Things, Big Data and Security
68

APPENDIX
Table 1: Performance of SIMBIoTA compared to existing antivirus products. The table shows the mean values of the 12
performed measurements. Product names are removed because our goal is to compare SIMBIoTA to existing products and
not to compare existing products to each other. We deliberately wanted to avoid to give an impression of ranking existing
commercial products, which is not our goal.
Number of detected samples by
Difference
existing AV SIMBIoTA
Product #1 24 362 23 114 -5,12%
Product #2 24 263 23 080 -4,88%
Product #3 24 052 22 899 -4,80%
Product #4 23 016 22 545 -2,04%
Product #5 22 866 22 464 -1,76%
Product #6 23 515 23 140 -1,59%
Product #7 22 861 22 579 -1,23%
Product #8 23 424 23 151 -1,17%
Product #9 21 411 22 257 +3,95%
Product #10 19 219 20 831 +8,39%
Product #11 20 759 23 145 +11,49%
Product #12 19 551 23 104 +18,17%
Product #13 18 847 23 118 +22,66%
Product #14 18 478 23 040 +24,69%
Product #15 17 512 22 443 +28,16%
Product #16 16 323 21 809 +33,61%
Product #17 16 052 21 928 +36,60%
Product #18 16 525 23 008 +39,23%
Product #19 15 924 23 014 +44,53%
Product #20 15 290 23 139 +51,33%
Product #21 15 149 23 073 +52,31%
Product #22 11 094 23 087 +108,10%
Product #23 5 096 10 683 +109,64%
Product #24 10 983 23 120 +110,51%
Product #25 10 681 23 094 +116,21%
Product #26 10 358 22 862 +120,72%
Product #27 8 678 21 966 +153,12%
Product #28 8 936 22 813 +155,29%
Product #29 8 696 22 686 +160,87%
Product #30 8 105 23 131 +185,40%
Product #31 7 736 23 107 +198,70%
Product #32 7 735 23 136 +199,11%
Product #33 7 724 23 106 +199,14%
Product #34 7 703 23 067 +199,46%
Product #35 7 005 21 281 +203,80%
Product #36 7 399 23 133 +212,65%
Product #37 6 959 23 095 +231,87%
Product #38 6 864 23 150 +237,26%
Product #39 4 788 22 092 +361,40%
Product #40 2 480 23 148 +833,37%
Product #41 169 4 084 +2 316,42%
Product #42 31 23 152 +74 582,26%
Product #43 19 15 953 +83 860,96%
Product #44 5 23 123 +462 356,67%
Product #45 5 23 131 +462 510,00%
Product #46 1 7 123 +712 183,33%
Product #47 2 21 817 +1 090 725,00%
Product #48 2 23 144 +1 157 104,17%
(a) Measured on ARM samples
Number of detected samples by
Difference
existing AV SIMBIoTA
Product #1 16 022 15 003 -6,36%
Product #2 15 924 14 959 -6,06%
Product #3 15 661 14 883 -4,97%
Product #8 15 260 15 012 -1,62%
Product #4 14 681 14 634 -0,32%
Product #5 14 557 14 559 +0,01%
Product #7 14 397 14 647 +1,73%
Product #9 13 946 14 503 +3,99%
Product #6 14 254 15 007 +5,28%
Product #10 12 748 13 600 +6,68%
Product #14 13 117 14 942 +13,92%
Product #11 12 984 15 007 +15,58%
Product #15 12 147 14 527 +19,59%
Product #13 12 252 14 991 +22,36%
Product #12 12 005 14 988 +24,85%
Product #18 11 913 14 913 +25,19%
Product #19 11 258 14 911 +32,44%
Product #17 10 259 14 184 +38,26%
Product #16 10 163 14 139 +39,12%
Product #20 9 852 15 006 +52,31%
Product #21 7 751 14 952 +92,91%
Product #27 7 358 14 348 +95,00%
Product #22 7 251 14 981 +106,61%
Product #25 6 885 14 979 +117,56%
Product #26 6 756 14 845 +119,73%
Product #24 6 306 15 001 +137,88%
Product #29 6 058 14 800 +144,30%
Product #23 2 993 7 524 +151,40%
Product #30 5 093 14 997 +194,45%
Product #28 4 377 14 776 +237,58%
Product #37 4 274 14 992 +250,76%
Product #31 4 175 14 979 +258,77%
Product #33 4 176 14 996 +259,10%
Product #34 4 168 14 970 +259,18%
Product #32 4 178 15 008 +259,21%
Product #35 3 806 13 821 +263,13%
Product #36 3 979 14 996 +276,87%
Product #38 3 982 15 010 +276,95%
Product #39 2 872 14 330 +398,96%
Product #40 645 15 008 +2 226,74%
Product #41 87 2 995 +3 342,72%
Product #42 24 15 012 +62 449,31%
Product #43 16 10 202 +63 663,54%
Product #46 2 4 208 +210 304,17%
Product #44 6 14 998 +249 868,06%
Product #45 6 15 002 +249 930,56%
Product #47 5 14 214 +284 178,33%
Product #48 2 15 008 +750 291,67%
(b) Measured on MIPS samples
SIMBIoTA: Similarity-based Malware Detection on IoT Devices
69
