
Capturing the Variety of Urban Logical Scenarios from Bird-view
Trajectories
Christian King, Thilo Braun, Constantin Braess, Jacob Langner and Eric Sax
FZI Research Center for Information Technology, Haid-und-Neu-Str. 10-14, Karlsruhe, Germany
Keywords:
Logical Scenario Extraction, Scenario Coverage, Urban Scenarios.
Abstract:
Driving scenarios are an essential part of validation of future highly automated driving (HAD) systems. In
order to provide a valid proof of safety, it is crucial to test the system in as many realistic driving scenarios as
possible. For this reason, it is necessary to extract driving scenarios from recorded data. A particular challenge
in urban traffic is that there is a high degree of interaction between road users that needs to be considered. In
this paper we present a concept for a maneuver-based extraction of driving scenarios. The extracted scenarios
are provided in a format that supports a swift understanding of the content. In addition to the mere driving
scenarios, parameter ranges for each scenario are grouped and aggregated from the data. Hence, the scenarios
extracted with the presented concept can be used for re-simulation during the validation. We provide some
results from the scenario extraction for an intersection from the INTERACTION data set.
1 INTRODUCTION
Early driver assistance systems, such as cruise con-
trol, Anti-lock Braking System (ABS) or Electronic
Stability Program (ESP) were influenced solely by the
driving condition of the driver’s own vehicle (VDA,
2015). The ongoing automation of the driving task
results in today’s driver assistance systems being in-
creasingly influenced by the vehicle’s static and dy-
namic environment. Future Highly Automated Driv-
ing (HAD) systems, such as an urban intersection as-
sistant, must additionally be able to operate freely
within a traffic area. Thus, the interaction with the
environment and surrounding traffic will become a
crucial aspect for these systems. The possible driv-
ing situations in HAD systems can be assigned into
four quadrants dependent on the risk and the knowl-
edge about the driving situation, shown in Figure 1
(Stavesand, 2019). In order to be able to provide
proof of safety during the validation process, a spe-
cial emphasis must be placed on the unknown risks.
Established test concepts utilize a requirement-based
test approach that derives test cases from system re-
quirements (Sax, 2008). Hence, the approach has the
limitation that only known risks can be considered.
Referring to the four quadrants in Fig 1, requirement-
based testing can only address driving situations that
are already known and additionally covered by re-
quirements. Moreover, the consideration of all pos-
Known
Unknown
Safe
Unsafe
Known
Safe
Situations
Unknown
Safe
Situations
Known
Risks
Unknown
Risks
Figure 1: Classification of possible driving situations in
highly automated driving according to (Stavesand, 2019).
sible interactions in an open world context by system
requirements in sufficient granularity is not feasible.
A promising approach for the validation of HAD
systems is scenario-based testing. In contrast to the
requirement-based test approach, driving scenarios
form the basis for test case creation (P
¨
utz, 2017).
The fundamental idea of scenario-based testing is that
if all theoretically possible driving scenarios can be
enumerated and the autonomous vehicle is tested in
all scenarios, a statement about safety of the sys-
tem can be derived (de Gelder and Paardekooper,
2017). The assumption is made that if a vehicle
has successfully completed a particular scenario, that
other, similar scenarios will also be successfully com-
pleted (Shwartz et al., 2017). In his work, Bagschik
King, C., Braun, T., Braess, C., Langner, J. and Sax, E.
Capturing the Variety of Urban Logical Scenarios from Bird-view Trajectories.
DOI: 10.5220/0010441204710480
In Proceedings of the 7th International Conference on Vehicle Technology and Intelligent Transport Systems (VEHITS 2021), pages 471-480
ISBN: 978-989-758-513-5
Copyright
c
2021 by SCITEPRESS – Science and Technology Publications, Lda. All rights reserved
471

proposes three levels of abstraction for scenarios
(Bagschik et al., 2017). Functional scenarios repre-
sent the highest and most abstract level of scenarios.
At this level, operational scenarios of the develop-
ment object are collected on a semantic level. The
next level is formed by the so-called logical scenarios,
which map the functional scenarios onto a physical
state space. They represent driving scenarios by enti-
ties and relationships of these entities with the help of
parameter ranges in the state space. Concrete scenar-
ios are defined as the lowest level. They represent
driving scenarios uniquely by entities and relation-
ships of these entities using fixed values in the state
space.
Within the project PEGASUS, funded by the Ger-
man Federal Ministry for Economic Affairs and En-
ergy (BMWi), a 6-level model was developed, which
can be used for the description of scenarios, see Fig-
ure 2. This model uses different levels to repre-
sent the different aspects and properties of a scenario
(PEGASUS-Projekt, 2018). The first two levels L1
and L2 of the model describe the basic road layout
on which the scenario takes place. This includes both
the road topology and its characteristics, as well as the
guidance infrastructure such as construction barriers,
lane markings and traffic signs. Temporary modifica-
tions, such as changed lane alignments or guidance fa-
cilities in construction sites, are described in the third
level L3. Moving objects, as well as maneuver-based
interaction between road users is part of the fourth
level L4. The fifth level L5 is used for modeling en-
vironmental conditions and their influence on the lev-
els L1 to L4. Digital information, such as Vehicle-to-
Everything (V2X) communication or digital maps, is
described in the last level L6.
In order to obtain test scenarios for the validation
either a knowledge or data-driven approach can be
used (Stellet et al., 2015). The knowledge-driven ap-
proach derives test scenarios from system use cases
and addresses known driving states. By filtering rele-
vant cases from empirical data and extracting driving
scenarios from it, the data-driven approach enables
the identification from previously unknown driving
states. The empirical data encompasses data from
Naturalistic Driving Studies (NDS), Field Operational
Tests (FOT), accidents as well as driving simulator
and real world test trials (Ebner, 2014).
A major remaining challenge in scenario-based
testing is to extract a comprehensive and representa-
tive set of driving scenarios from recorded real world
data. To ensure that the extracted scenarios can also
be used for validation, a semantic description must be
available.
In this paper we present a concept for extracting
Street level (L1)
• Geometry and topology
• Condition and boundaries
Traffic infrastructure (L2)
• Construction barriers
• Signs and traffic guidance
Temporal modifications L1 and L2 (L3)
• Geometry and topology overlay
• Time dependent > 1 day
Movable objects (L4)
• Dynamic, movable
• Interactions, maneuvers
Environment conditions (L5)
• Influence on properties of other level
Digital Information (L6)
• V2X Information
• Digital maps
Figure 2: The 6-layer model to structure scenarios pre-
sented by PEGASUS(Project, 2019).
logical scenarios in an urban environment from bird-
view trajectories. This concept is applied on an inter-
section from the INTERACTION data set (Zhan et al.,
2019). The presented approach considers each vehi-
cle in the data set as a ego vehicle and is based on
the assumption that each vehicle can experience mul-
tiple composite scenarios. Thus, a much greater vari-
ety of logical scenarios can be extracted from the data
set. The description of the logical scenarios focuses
on driving maneuvers and the interaction with other
road users. Moreover, we present a visualization tool
that makes the data set accessible and browsable on a
logical scenario level. This tool can be used to search
specifically for scenarios with a certain content.
This paper is structured as follows: Section II
presents the related work regarding the extraction of
logical scenarios. In the third section we introduce
our concept. In Section IV we apply the concept on
an intersection from the INTERACTION data set and
show some results. After the evaluation in Section
V, some conclusions and future work are presented in
Section VI.
2 RELATED WORK
Zhao presents an open database that includes natural-
istic driving scenarios extracted from public data col-
lected by the Safety Pilot Model Deployment program
in an urban environment (Zhao et al., 2017). The pre-
sented database covers six different types of scenar-
ios:
VEHITS 2021 - 7th International Conference on Vehicle Technology and Intelligent Transport Systems
472
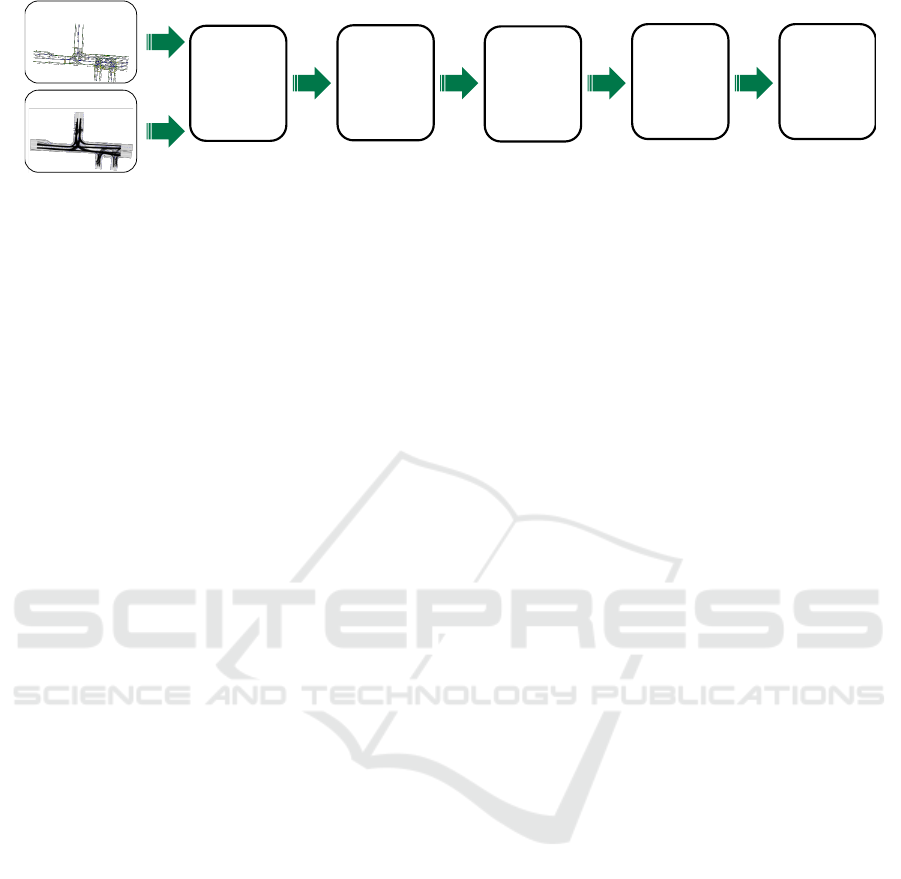
Extraction of
driving
maneuvers
Categorization
of traffic
participants
Identification
of concrete
scenarios
Aggregation
to logical
scenarios +
parameter
space
Trajectory data
Map data
Visualization
of logical
scenarios
Figure 3: Requited steps for the presented scenario extraction approach.
• Free flow scenario
• Car-following scenario
• Cut in scenario
• Lane change scenario
• Pedestrian crossing scenario
• Cyclist scenario
The data set used to perform the scenario extraction
is comprised of of object-list data from radar sensors,
information provided by a vision-based system from
Mobileye as well as a trip summary. For each scenario
Zhao provides an algorithm to query the respective
scenarios from the open accessible data base.
(Langner et al., 2019) extract scenarios of dy-
namic length for one traffic participant including traf-
fic infrastructure from map data, such as curviness,
slope and speed limits. The segmented scenarios are
enriched with a feature vector, containing relevant in-
formation for the system under test. For combining
the scenarios to logical scenarios, common cluster al-
gorithms are applied on the feature vector.
(Hartjen et al., 2019a) provide a semantic descrip-
tion of extracted scenarios for urban traffic based on
maneuvers. The maneuvers are grouped to infrastruc-
ture maneuvers, describing connections to the infras-
tructure, object-related maneuvers, describing inter-
action with other participants, and vehicle state ma-
neuvers, describing behavior without a connection to
external elements. The extracted maneuvers serve
as basis for logical scenarios, whereby the individ-
ual maneuver parameters are combined to parameter-
distributions. In further work, they show the appli-
cation of the concept for scenarios with interactions
with pedestrians (Hartjen et al., 2019b).
(Erdogan et al., 2019) extract scenarios based
on recorded trajectories focusing cut-in/out and lane
changes scenarios on highways. For detection of
these, they implemented rule-based, supervised and
unsupervised classification algorithms and compared
their results.
(Elrofai et al., 2016) extract turns and lane change
scenarios from only in-car sensor data. For the detec-
tion, a physical model is used. The extracted scenar-
ios are enriched with characterizing parameters.
An important purpose of scenarios during the val-
idation is that they serve as a basis for test definition.
Therefore, they should be available as logical scenar-
ios to enable the generalization approach. To test in-
teractive systems, a simple replay of trajectories is no
longer sufficient. The scenarios must therefore be ex-
tracted in a format that represents the relationships of
the road users at an abstraction level that allows an
interactive re-simulation. In addition, representative
parameter spaces and parameter distributions are re-
quired for a reliable validation.
3 EXTRACTION CONCEPT
We present an approach that identifies scenarios with
respect to the 6-layer model, shown in Figure 3. For
this purpose, we place a special focus on the interac-
tions with other road users at the layer L4, represented
by driving maneuvers. The first step of the proposed
concept comprises the identification and categoriza-
tion of all relevant traffic participants from input data.
Based on the classification, a driving maneuver ex-
traction is performed. Subsequently, concrete scenar-
ios are identified, which are then aggregated into logi-
cal scenarios. The final step is the visualization of the
results to enable further use. The individual steps are
described in more detail below.
Input Data. The input data for the extraction are
vehicle trajectories, for example from the INTERAC-
TION data set (Zhan et al., 2019), as well as map in-
formation. The map is represented in the Lanelet2
framework (Poggenhans et al., 2018) and includes
lane information, a routing graph and regulatory el-
ements. The entire processing chain from Figure 3 is
performed for each vehicle in the data set. Thus, each
vehicle can be both ego-vehicle and participant in the
extracted logical scenarios.
Categorization of Traffic Participants. The initial
step of the extraction concept is the categorization of
traffic participants. All surrounding vehicles are ex-
amined to determine if they are a preceding vehicle
Capturing the Variety of Urban Logical Scenarios from Bird-view Trajectories
473
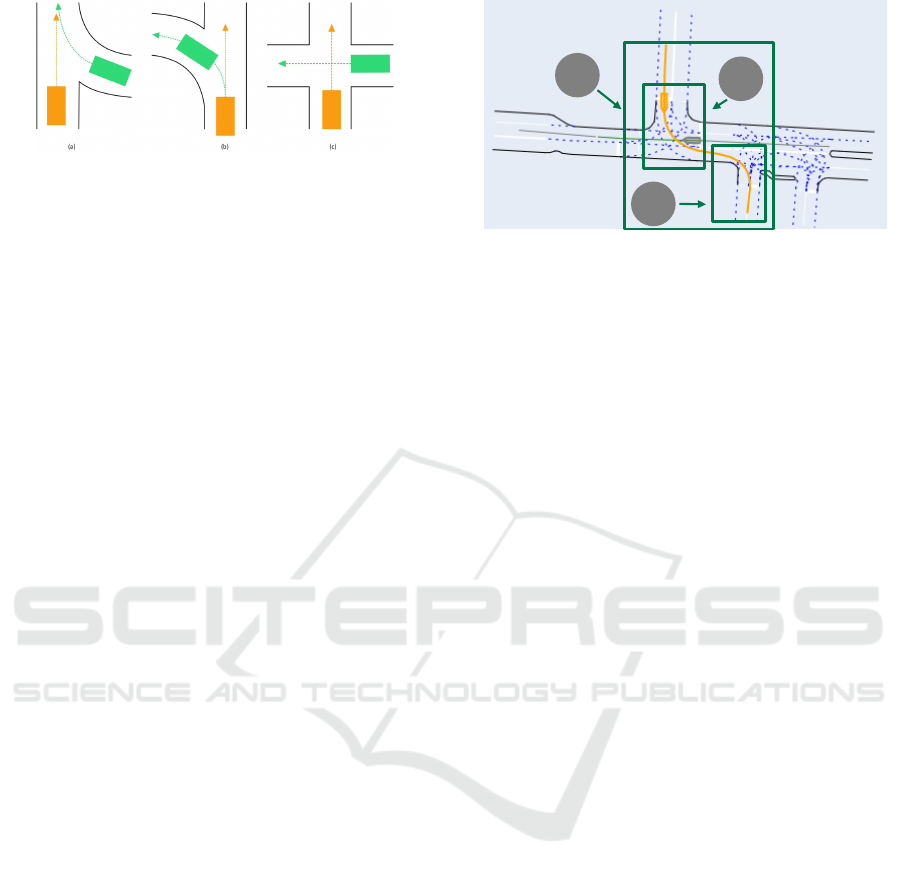
Figure 4: Possible interaction of ego vehicle (orange) with
other road users (green): (a) merging, (b) diverging, (c)
crossing.
or otherwise interacting with the ego vehicle. Hence,
this work considers three different types of interac-
tion between the ego vehicle and other road users, see
Figure 4.
Merging. The trajectory of another road user merges
on the ego trajectory and become a preceding ve-
hicle.
Diverging. The trajectory of a preceding road user
diverges from the ego trajectory.
Crossing. The trajectory crosses the ego trajectory in
space and time.
In order to reduce complexity, non-interacting ve-
hicles on adjacent lanes are not yet considered for sce-
nario extraction in the work. The different interaction
types are determined by crossing lanelet paths and tra-
jectories. Moreover, a crossing requires a positive
post encroachment time (PET). The PET describes
the time interval between two objects when the first
object leaves a conflict point and the second object
enters into it (Paul, 2019).
Extraction of Driving Maneuvers. During the
next step, a maneuver recognition is performed for
all relevant surrounding vehicles. We use a maneu-
ver model based on Hartjen (Hartjen et al., 2019a). A
distinction between driving maneuvers and the driv-
ing context is introduced in addition to the work of
Hartjen. The driving context includes interactions
with other road users as well as further information
on whether a lane change was performed, for exam-
ple, on the crossing area or the access road. Since the
data sets contains some lane changes that could not be
trivially performed on the routing graph, the maneu-
ver of illegal lane change is additionally introduced.
Identification of Concrete Scenarios. Based on
the driving maneuvers and the driving context we
perform the identification of concrete scenarios. The
presented work is based on the assumption that each
vehicle can experience multiple composite scenarios.
A brief example might clarify this concept, shown in
1
2
3
Figure 5: The ego vehicle (yellow) experiences three con-
crete scenarios: turn left with crossing participant (1), turn
right (2) and turn left and turn right (3).
Figure 5. For the purpose of this contribution,
the ego vehicle will always be represented by the
orange object in the images. The example shows a
vehicle turning to the left with crossing traffic and
then directly turning right. In terms of the validation,
both the turn left, the turn right and the combination
of both are interesting. Therefore, the complete
driving sequence can be considered as one scenario
with two turns or two smaller scenarios with one
turn each. Thus, three scenarios can be derived from
this single driving sequence. This distinction can
be particularly interesting for statements regarding
a potential coverage. At the layer L4, the concrete
scenario is represented as a sequence of maneuvers,
while preserving the causality of the maneuver se-
quence. To reduce artifacts in scenario identification,
we have introduced rules for when a scenario is
considered valid:
• The track of the object does not start on a crossing
area
• The object must cross an intersection
Finally, a parameter determination is carried out. The
parameters depend on the maneuver performed. For
instance, the minimum distance to the preceding vehi-
cle can be determined during a follow maneuver, but
not if the intersection is crossed alone.
Aggregation to Logical Scenarios. In the last ex-
traction step, the concrete scenarios are aggregated
into logical scenarios. We distinguish logical scenar-
ios as different maneuver sequences. Thus, concrete
scenarios with the identical maneuver sequence can
be grouped into the same logical scenario and their
explicit parameter values can be converted to param-
eter value ranges for the logical scenario. Lastly the
logical scenarios are stored in a database with follow-
ing information:
VEHITS 2021 - 7th International Conference on Vehicle Technology and Intelligent Transport Systems
474

Meta-Information. Logical scenario ID, including
concrete scenarios (Id, track id, start and stop
time), Parameter space
L1/L2. Reference to the map
L4. Maneuver Sequence
Visualization of Logical Scenarios. To visualize
the extracted logical scenarios we build a dashboard
that represents scenarios in a searchable and struc-
tured way. For this purpose, a prefix graph is used
in which nodes describe groups of logical scenarios.
The maneuver sequences are represented as succes-
sions in the prefix graph and scenarios of the child
nodes are more precise subdivisions of the respective
parents. Additionally, we use a subset graph for a
more in-depth visualization. The subset graph shows
the logical scenarios included in the group of logi-
cal scenarios selected in the prefix graph. In contrast
to the prefix tree, each node represents a logical sce-
nario. The subset graph utilizes a tree ordering and
each parent node includes the maneuver sequence of
the child nodes. Additionally, the maneuver sequence
and representative scene overviews from the scenar-
ios are displayed to support the understanding of the
logical scenario. This combination of a prefix graph
and subset graph create a tool that allows a step-by-
step filtering for scenarios with a certain content.
4 IMPLEMENTATION AND
RESULTS
The proposed scenario extraction approach is imple-
mented and applied on the DR USA Intersection EP
intersection from the INTERACTION data set. This
demonstrates that the approach is suitable for extract-
ing logical scenarios and representing them in a se-
mantic browsable manner. Additionally, further infor-
mation on occurrence probabilities and distributions
of logical scenarios are determined. First, general in-
formation about the extracted logical scenarios is pre-
sented. Thereafter, the actual content of the extracted
scenarios will be interpreted and discussed in more
detail. The data set comprises an American intersec-
tion without traffic lights and with a total number of
around 750 vehicles and a high density of aggressive
behavior and near collision situations (Zhan et al.,
2019). The topology of the considered road section
is shown in Figure 6. The intersection is composed
of two crossing areas and access roads from all direc-
tions. The indicated arrows visualize the direction of
travel. For the sake of simplicity, the term scenario
Figure 6: Intersection DR USA Intersection EP from the
INTERACTION data set with marked driving direc-
tions(Zhan et al., 2019).
will refer to a logical scenario in this section. Con-
crete scenarios are explicitly mentioned.
4.1 General Analysis of the Results
Throughout the data set, the presented approach iden-
tified 1172 concrete scenarios, which are then clus-
tered into 504 logical scenarios. From the figures it is
apparent that a significant number of vehicles experi-
ence several concrete scenarios. Figure 7 shows the
distribution of the number of concrete scenarios per
vehicle. The abscissa shows the number of concrete
scenarios per vehicle. The ordinate shows how many
vehicles have the respective number of concrete sce-
narios. Approximately 100 vehicles in the data set
do not meet the requirements listed in Sec. 3 and
therefore no concrete scenario can be identified for
them. The majority of vehicles have one or two con-
crete scenarios. The proportion of vehicles with 3
concrete scenarios is about the same as that with 0
concrete scenarios. There are vehicles for which 4 or
in one exception even 6 concrete scenarios are iden-
tified. The next analysis examines how the concrete
scenarios are distributed among the logical scenarios,
shown in Figure 8. The abscissa represents the num-
Figure 7: Distribution of the number of concrete scenarios
per vehicle.
Capturing the Variety of Urban Logical Scenarios from Bird-view Trajectories
475
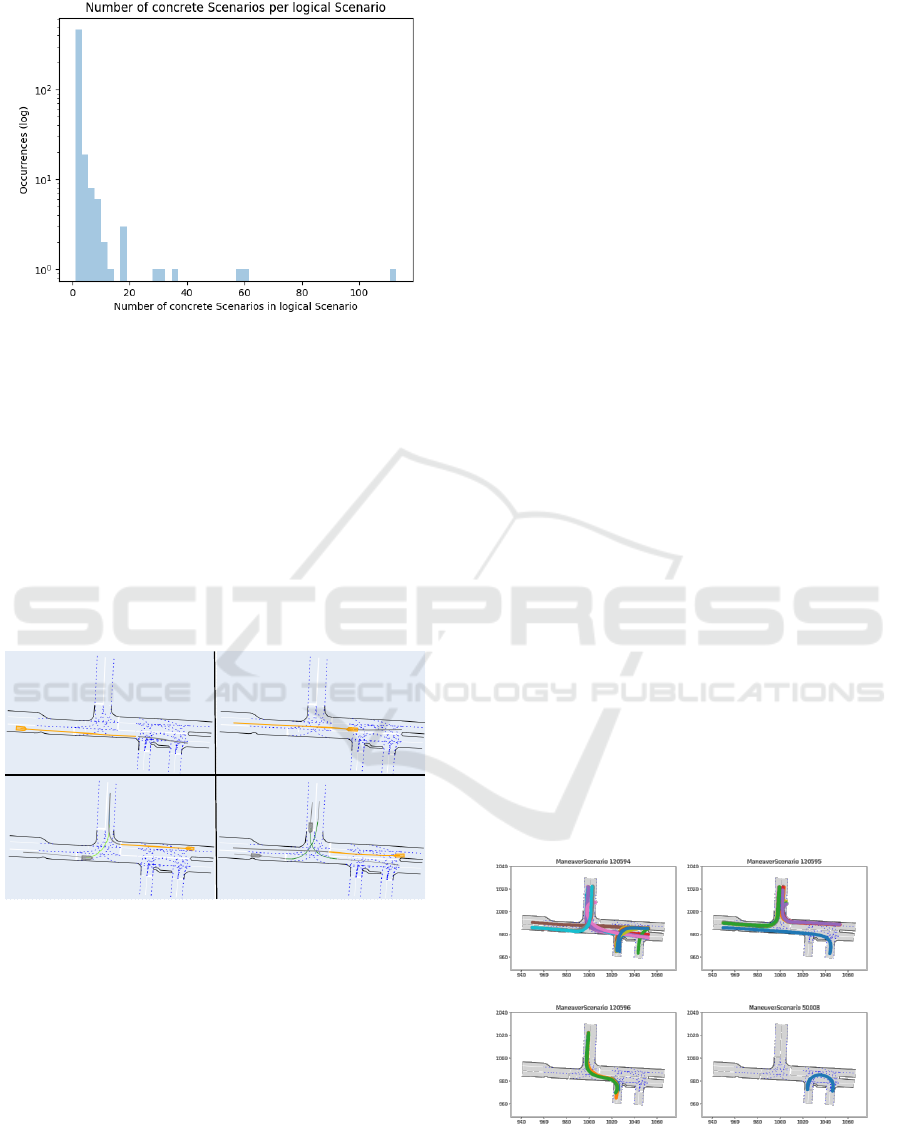
Figure 8: Distribution of the number of concrete scenarios
per logical scenario.
ber of concrete scenarios in a logical scenario and on
the ordinate the occurrences is shown on a logarithmic
scale. As it can be seen from Figure 8, there are only
a few logical scenarios that encompasses a large num-
ber of concrete scenarios. The largest logical scenario
comprises 113 concrete scenarios, which corresponds
to around 9.6% of the total number of concrete scenar-
ios. This scenario solely involves a straight passing
of an crossing area without any interaction with other
road users and thus serves as the basis for a variety of
larger scenarios.
Figure 9: Four concrete scenarios from the largest logical
scenario.
Four exemplary concrete scenarios from this log-
ical scenario are illustrated in Figure 9. Furthermore,
Fig 8 reveals that most of the extracted logical sce-
narios are formed by only one concrete scenario. In
this context, the term singular logical scenarios is in-
troduced. Possible reasons for this can be the special
characteristics of the scenarios on the one hand or the
limited size of the data set on the other hand. Since
only concrete scenarios with an identical maneuver
sequence are combined into a logical scenario, even
small variations ensure that concrete scenarios are no
longer combined. Therefore, we have analyzed the in-
fluence of the different maneuver types on the number
of scenarios. For this purpose, we examine in a first
step how many scenarios would have been identified
without a certain maneuver type. In the second step,
the scenario extraction is performed with this inves-
tigated maneuver type. By comparing the scenarios
found, a conclusion is drawn about the influence of
the maneuver type. A key finding from this analysis
is, that temporal variations in the maneuvers concern-
ing only the ego vehicle’s state, e.g. acceleration or
standing still, lead to the biggest increase in scenar-
ios. Additionally, the preceding object maneuver also
highly influence the number of scenarios. Overall,
91% of the logical scenarios contain only three or less
concrete scenarios, 95% six or less.
4.2 Interpretation of Extracted
Scenarios
In order to be able to use scenarios for validation, the
content of the individual scenarios must be known.
Hence, we analyze on the one hand how the vehicle
navigates through the road network and on the other
hand how it interacts with other road users. This in-
formation can then be used, for instance, for scenario
design during re-simulation.
Navigation through Road Network. The scenar-
ios are examined with regard to the turn and lane
change maneuvers, see Table 1. 39.29% of the ve-
hicles in the data set did not perform any turn ma-
neuvers and crossed the intersection straight ahead.
The remaining vehicles performed at least one left or
right turn. Thus, 31.94% of the scenarios include at
least one turn left and 28.77% involve at least one turn
right.
Turn left Turn right
Turn left + turn right Turn right + turn right
Figure 10: Logical scenarios with different turn maneuvers
extracted from the dataset.
The data suggest that the maneuvers are reason-
VEHITS 2021 - 7th International Conference on Vehicle Technology and Intelligent Transport Systems
476
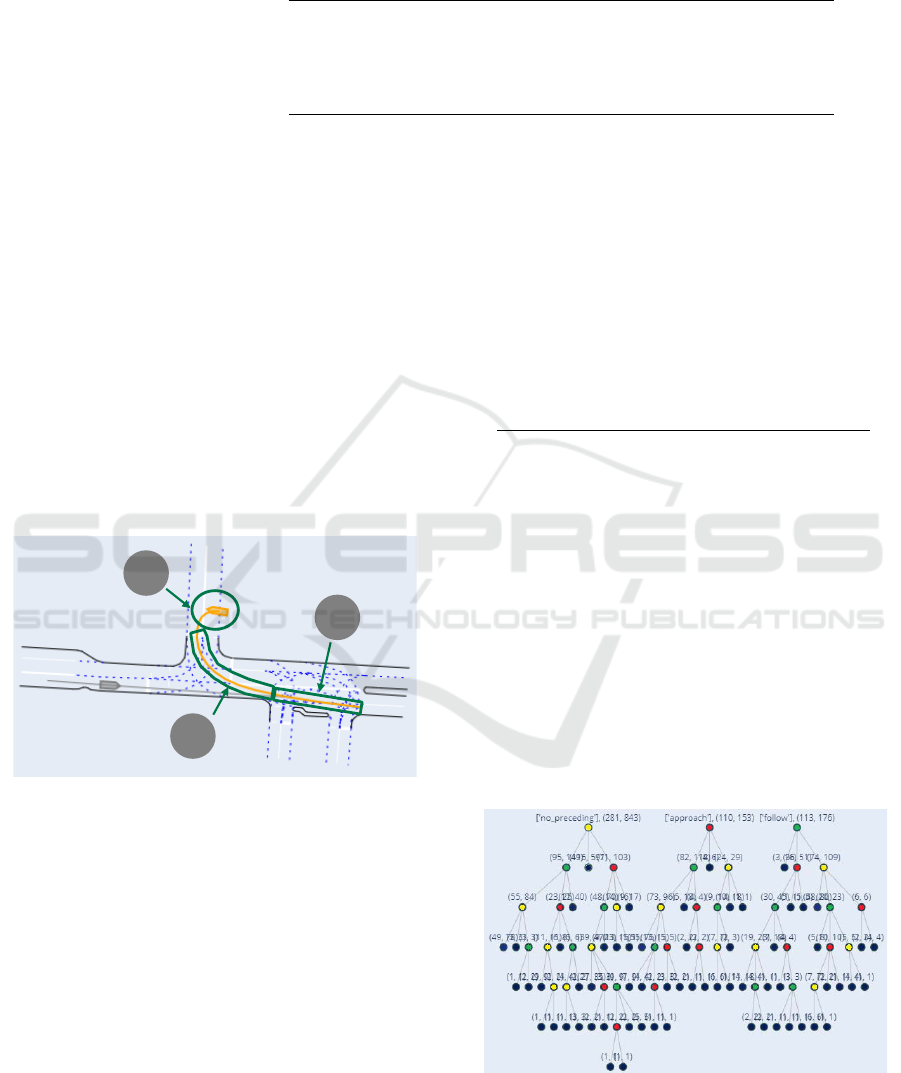
Table 1: Number of extracted logical scenarios regarding turn and lane change maneuvers.
Scenario defining
maneuver
Number of extracted logical scenarios
total relative
Turn maneuver
Turn left 161 31.94%
Turn right 145 28.77%
Cross straight 192 39.29%
Turn left + turn right 8 1.59%
Turn right + turn right 2 0.39%
Lane change maneuver
Follow lane 363 72.02%
Lane change 141 27.98%
Illegal lane change 34 6.7%
ably evenly distributed. Moreover, eight vehicles first
performed a turn left and then a turn right. Two vehi-
cles performed two turn rights in succession. An illus-
tration of the various turn maneuvers is shown in Fig-
ure 10. It can be seen from the figures that 27.98% of
the vehicles perform a lane change maneuver. Among
these 141 logical scenarios, 34 scenarios include a ve-
hicle that performs an illegal lane change. A logical
scenario that includes a composition of all three lane
change maneuvers is shown in Fig 11. Since (Zhan
et al., 2019) do not provide any information about the
exact location of the intersection we do not know the
surrounding infrastructure. Based on the trajectory in
1
2
3
Figure 11: Logical scenario composed of an illegal lane
change (1), follow lane (2) and a lane change (3).
Figure 11 we assume that there might be a parking
space in the top right corner. However, driving onto
or off the road has not been explicitly classified as a
maneuver and is therefore identified as an illegal lane
change.
The distribution of lane change and turn maneuvers
depends on the intersection and the traffic flow. Nev-
ertheless, the given results are a representative distri-
bution for the presented intersection.
Interaction with Other Road Users. Considering
the extracted logical scenarios with respect to interac-
tions with the surrounding traffic, we find that 22.82%
of the scenarios take place without any preceding ve-
hicle. 68.85% of the scenarios include at least one
follow maneuver and 50.79% approach maneuvers,
see Table 2. As mentioned before, the preceding ma-
Table 2: Number of extracted logical scenarios regarding
the preceding maneuver.
Scenario defining
maneuver
Number of extracted
logical scenarios
total relative
No preceding 115 22.82%
Approach 256 50.79%
Follow 347 68.85%
neuver is the second largest influencing factor on the
number of scenarios. This is also reflected in the vari-
ety of possible maneuver sequences. Figure 12 visu-
alizes all existing maneuver sequences as a prefix tree.
Starting at a root node each path to a final node rep-
resents an existing maneuver sequence of a scenario.
We used following color code within the graph:
no preceding yellow circle
approach red circle
follow green circle
final node blue circle
Figure 12: Visualization of existing maneuver sequences
as a prefix tree (yellow circle = no preceding, red circle =
approach, green circle = follow, blue circle = final node).
Capturing the Variety of Urban Logical Scenarios from Bird-view Trajectories
477

Table 3: Number of extracted logical scenarios regarding
the interaction types.
Number of
logical ScenariosInteraction
type total relative
Max Number
of Vehicles
Crossing 163 32.34% 9
Merging 194 38.49% 6
Diverging 111 22.02% 3
Crossing +
Merging
53 10.51%
Crossing:3
Merging: 2
Crossing +
Diverging
23 4.56%
Crossing: 2
Diverging: 2
Merging +
Diverging
26 5.16%
Merging: 3
Diverging: 1
Crossing+
Merging+
Diverging
16 3.17%
Crossing: 2
Merging: 1
Diverging: 1
The shortest scenario consists of one maneuver
and is created through the slicing of larger scenar-
ios. The longest maneuver sequence consists of two
consecutive sequences: ”no preceding” - ”approach” -
”follow”. During the design of test scenarios, the pre-
fix tree from Figure 12 can be used to search for real
logical scenarios with a certain maneuver sequence.
In addition to the preceding object, different types of
interaction with other road users are also considered.
For this purpose, the logical scenarios are examined
in more detail with regard to the different types of in-
teractions presented in Figure 4. Moreover, we also
consider the number of participants within the inter-
action as a parameter of the logical scenario. By look-
ing at the figures in Table 3, one can see that merging
is the most common type of interaction with a cumu-
lative frequency of occurrence of 38.49%. In contrast,
crossing has the highest number of involved objects,
with a total number of nine crossing vehicles within a
logical scenario. Figure 13 shows a more detailed his-
togram about the number of vehicles for each interac-
tion type. The number of interacting vehicles is plot-
Number of interacting vehicles by interaction type
1 2 3 4 6 7 8 9
Number of Vehicles
5
1
10
Occurences
100
crossing
merging
diverging
Figure 13: Distribution of the number of interaction vehi-
cles by interaction type.
1
2
3
Figure 14: Logical scenario that include crossing (1), di-
verging (2) and merging (3) objects.
ted on the abscissa and the frequency of occurrence
is plotted on the ordinate on a logarithmic scale. Ac-
cording to the diagram, most interactions involve one
or two vehicles.
Moreover, scenarios that have a combination of
two or three interactions are also present in the data
set and have been identified. Figure 14 shows a log-
ical scenario that include all three types of interac-
tion. The scenarios includes a preceding object that
diverges from the ego trajectory and passes the inter-
section straight ahead. Additionally, the ego vehicle
have to wait for two crossing objects from left and the
oncoming traffic as well as two vehicles merge into
the ego trajectory.
The representation of the logical scenarios in a prefix
and subset graph allows an easy and direct selection
of more remarkable scenarios like the one presented
in Figure 14. The selection setup for this scenario is
”turn left” in the prefix graph and ”merging + crossing
+ diverging” in the subset graph.
5 EVALUATION
Currently, there is no set of reference for scenarios ex-
tracted from the data set or any other type of ground
truth that could be used to validate the results of the
presented extraction. Thus, the evaluation has to be
done empirically. For the validation of the scenar-
ios with respect to turn and lane change maneuvers,
a ground truth is constructed from the existing data.
For this purpose, all tracks entering or leaving the
map on certain lanelets are identified. These track
clusters are then be compared to the extracted sce-
narios. No mismatches are found from the extracted
scenarios to the created ground truth. A random man-
ual review of logical scenarios is used to validate the
scenarios regarding the interactions with other road
users. In the process, it is checked for selected logi-
cal scenarios whether the assigned concrete scenarios
VEHITS 2021 - 7th International Conference on Vehicle Technology and Intelligent Transport Systems
478

matched in terms of content. Although all logical sce-
narios considered are judged to be plausible and cor-
rect, no general claim to correctness can be derived
from this small reviewing sample. In a third step, we
re-simulate individual scenarios in a simulation envi-
ronment and apply the scenario detection to the simu-
lated data. The results show that our approach is able
to correctly identify the initial scenario again.
The presented approach provides the capability to
search specifically for logical scenarios with a cer-
tain content in the data set. In addition, it provides
important information relevant to scenario design and
possible coverage statements, such as distribution of
certain maneuvers or scenario parameter.
6 CONCLUSIONS AND FUTURE
WORK
In this contribution, we presented a concept for the
extraction of logical scenarios in an urban environ-
ment. Thereby, a special focus is on the interaction
with other road users. The presented approach there-
fore operates centrally on the performed driving ma-
neuvers and the existing driving context. In particular,
interactions such as crossing, merging and diverging
are considered.
We presented some results from the application of
our approach to an intersection from the INTERAC-
TION data set. A total number of 1172 concrete sce-
narios were extracted from this data set, which can be
aggregated into 504 logical scenarios. Based on the
extracted logical scenarios a dashboard is created that
allows an easy analysis of the scenarios as well as en-
ables a semantic browsability of the data. For each
logical scenario the maneuver sequence is shown, as
well as all assigned concrete scenarios and the param-
eter ranges with their distribution.
As discussed earlier and shown in Figure 8, our
set of logical scenarios consists mainly of singular
logical scenarios and only a few larger logical sce-
narios are found. At this point, it must be exam-
ined to what extent an increase in the volume of the
data set results in the filling of known logical scenar-
ios or the creation of new logical scenarios. Consid-
ering a sufficiently large and representative data set,
such singular logical scenarios would represent cor-
ner cases. An extension of the maneuver catalog to
include pedestrian-related maneuvers as well as fol-
lowing objects or objects on adjacent lanes is also
necessary in order to adequately consider these inter-
actions as well. Although a complete validity proof
is not possible due to the lack of reference scenar-
ios or ground truth, we are convinced that the work
will make a valuable contribution to the validation
of HAD. The extracted scenarios can be used for a
scenario-based testing approach and with the avail-
ability of a representative data set, statements about
the coverage and relevance of individual logical sce-
narios can also be made. Future work will also focus
on the application of the approach on the entire IN-
TERACTION data set as well as other available data
sets. As part of this, the aggregation of results will
also become a future research question.
REFERENCES
Bagschik, G., Menzel, T., Reschka, A., and Markus,
M. (2017). Szenarien f
¨
ur entwicklung, absicherung
und test von automatisierten fahrzeugen. Workshop
Fahrerassistenzsysteme und automatisiertes Fahren.
de Gelder, E. and Paardekooper, J.-P. (2017). Assessment
of automated and driving systems and using real-life
and scenarios. In 2017 IEEE Intelligent Vehicles Sym-
posium (IV) June 11-14, 2017, Redondo Beach, CA,
USA. IEEE.
Ebner, A. (2014). Referenzszenarien als Grundlage f
¨
ur
die Entwicklung und Bewertung von Systemen der Ak-
tiven Sicherheit. PhD thesis, Fakult
¨
at V – Verkehrs-
und Maschinensysteme der Technischen Universit
¨
at
Berlin.
Elrofai, H., Worm, D., and den Camp, O. O. (2016). Sce-
nario identification for validation of automated driving
functions. In Advanced Microsystems for Automotive
Applications 2016, pages 153–163. Springer.
Erdogan, A., Ugranli, B., Adali, E., Sentas, A., Mungan,
E., Kaplan, E., and Leitner, A. (2019). Real-world
maneuver extraction for autonomous vehicle valida-
tion: A comparative study. In 2019 IEEE Intelligent
Vehicles Symposium (IV), pages 267–272. IEEE.
Hartjen, L., Philipp, R., Schuldt, F., Howar, F., and
Friedrich, B. (2019a). Classification of driving ma-
neuvers in urban traffic for parametrization of test sce-
narios. In 9. Tagung Automatisiertes Fahren.
Hartjen, L., Schuldt, F., and Friedrich, B. (2019b). Seman-
tic classification of pedestrian traffic scenarios for the
validation of automated driving. In 2019 IEEE In-
telligent Transportation Systems Conference (ITSC),
pages 3696–3701. IEEE.
Langner, J., Grolig, H., Otten, S., Holz
¨
apfel, M., and
Sax, E. (2019). Logical scenario derivation by clus-
tering dynamic-length-segments extracted from real-
world-driving-data. In Proceedings of the 5th Inter-
national Conference on Vehicle Technology and Intel-
ligent Transport Systems. IEEE.
Paul, M. (2019). Safety assessment at unsignalized inter-
sections using post-encroachment time’s threshold—
a sustainable solution for developing countries. In
Pulugurtha, S., Ghosh, I., and Biswas, S., editors,
Advances in Transportation Engineering, pages 117–
131, Singapore. Springer Singapore.
Capturing the Variety of Urban Logical Scenarios from Bird-view Trajectories
479

PEGASUS-Projekt (2018). Scenario description and
knowledge-based scenario generation. Abschlussver-
anstaltung.
Poggenhans, F., Pauls, J.-H., Janosovits, J., Orf, S., Nau-
mann, M., Kuhnt, F., and Mayr, M. (2018). Lanelet2:
A high-definition map framework for the future of
automated driving. In 2018 IEEE Intelligent Trans-
portation Systems Conference. November 4-7, Maui,
Hawaii. 2018 21st International Conference on Intel-
ligent Transportation Systems (ITSC).
Project, P. (2019). Functional decomposition.
P
¨
utz, A. (2017). System validation of highly automated ve-
hicles with a database of relevant. In 12th ITS Euro-
pean Congress.
Sax, E. (2008). Automatisiertes Testen eingebetteter Sys-
teme in der Automobilindustrie. Carl Hanser Verlag.
Shwartz, S. S., Shammah, S., and Shashua, A. (2017). On
a formal model of safe and scalable self-driving cars.
CoRR, abs/1708.06374.
Stavesand, J.-E. (2019). Approval and homologation of au-
tonomous vehicles - with dspace support. In dSpace
World Conference.
Stellet, J. E., Zofka, M. R., Schumacher, J., Schamm, T.,
Niewels, F., and Z
¨
ollner, J. M. (2015). Testing of ad-
vanced driver assistance towards automated driving:
A survey and taxonomy on existing approaches and
open questions. In 2015 IEEE 18th International Con-
ference on Intelligent Transportation Systems, pages
1455–1462.
VDA (2015). Automatisierung - von fahrerassistenzsyste-
men zum automatisierten fahren.
Zhan, W., Sun, L., Wang, D., Shi, H., Clausse, A., Nau-
mann, M., K
¨
ummerle, J., K
¨
onigshof, H., Stiller, C.,
de La Fortelle, A., and Tomizuka, M. (2019). INTER-
ACTION Dataset: An INTERnational, Adversarial
and Cooperative moTION Dataset in Interactive Driv-
ing Scenarios with Semantic Maps. arXiv:1910.03088
[cs, eess].
Zhao, D., Guo, Y., Jack, Y., Jia, of Mechanical, D.,
Robotics, E., Department, I., of Electrical, and En-
gineering (2017). Trafficnet: An open naturalistic
driving scenario library. In 2017 IEEE 20th Interna-
tional Conference on Intelligent Transportation Sys-
tems (ITSC). IEEE.
VEHITS 2021 - 7th International Conference on Vehicle Technology and Intelligent Transport Systems
480
