
Using Binary Strings for Comparing Products from
Software-intensive Systems Product Lines
Mike Mannion
1a
and Hermann Kaindl
2b
1
Department of Computing, Glasgow Caledonian University, 70 Cowcaddens Road, Glasgow, G4 0BA, U.K.
2
Institute for Computer Technology, TU Wien, Gußhausstr. 27-29, A-1040, Vienna, Austria
Keywords: Product Line, String Similarity, Metrics.
Abstract: The volume, variety and velocity of products in software-intensive systems product lines is increasing. One
challenge is to understand the range of similarity between products to evaluate its impact on product line
management. This paper contributes to product line management by presenting a product similarity evaluation
process in which (i) a product configured from a product line feature model is represented as a weighted
binary string (ii) the overall similarity between products is compared using the Jaccard Coefficient similarity
metric (iii) the significance of individual features and feature combinations to product similarity is explored
by modifying the weights. We propose a method for automatically allocating weights to features depending
on their position in a product line feature model, although we do not claim that this allocation method nor the
use of the Jaccard Coefficient is optimal. We illustrate our ideas with mobile phone worked examples.
1 INTRODUCTION
Many systems today are software-intensive and it is
often the software features that help make a product
distinctive. A product line comprises products that
share sets of features. A feature is often but not al-
ways a visible characteristic of a product. Some fea-
tures may be shared across all products; some may be
shared across many but not all products; some may be
unique to a single product. Whilst product lines can
generate significant cost-efficiencies, the ongoing
management of their scope and scale is getting harder
as customers increasingly demand personalised prod-
ucts (Deloitte, 2015, Zaggi, 2019). The range of prod-
ucts in a product line and the features in each product
evolve for many reasons including supplier sales and
profit motives, customer demand, customer confu-
sion (Mitchell, 1999), personnel changes, market
competition, brand positioning (Punyatoya, 2014),
mergers and takeovers, or changing legislation. One
challenge of the management task is understanding
which products in the product line are similar to each
other and the extent. This paper addresses that chal-
lenge.
a
https://orcid.org/0000-0003-2589-3901
b
https://orcid.org/0000-0002-1133-0529
The research question is: to what extent can prod-
uct similarity within a product line be determined by
a product similarity evaluation process that uses a
weighted binary string to represent product features
and a binary string metric to evaluate similarity
(where 1 represents a feature’s presence, 0 its ab-
sence, and the weight represents its relative im-
portance to the product)? Our interest is in the merits
and difficulties of the overall process. We do not
claim our choices of binary string encoding, weight
allocation method or binary string metric are optimal.
We illustrate the process using a worked example of
a mobile phone product line.
Binary strings offer a straightforward flexible
means to represent product feature configurations.
They map easily to feature selection processes, are
low on storage requirements and enable fast compar-
ison computations with existing similarity metrics
and measuring tools e.g. (Rieck, 2016). The metrics
are based on feature counts and assume each feature
has equal contextual value. However, one outcome is
that two products can be similar to the same degree
even if one product is missing what might be regarded
as essential features, but makes up the feature count
Mannion, M. and Kaindl, H.
Using Binary Strings for Comparing Products from Software-intensive Systems Product Lines.
DOI: 10.5220/0010441002570266
In Proceedings of the 23rd International Conference on Enterprise Information Systems (ICEIS 2021) - Volume 2, pages 257-266
ISBN: 978-989-758-509-8
Copyright
c
2021 by SCITEPRESS – Science and Technology Publications, Lda. All rights reserved
257

deficit with less important features. One way to ad-
dress this issue is to attach a weight to each feature
signalling its relative importance. For large feature
trees, this is only feasible if the initial allocation is
done automatically. We devised a method for auto-
matic allocation based on a feature’s position in the
product line feature model.
There are many binary similarity (and dissimilar-
ity) metrics. We selected the Jaccard Coefficient (JC)
similarity metric (Jaccard, 1901) because it compares
only the total number of common features in both
products. It was also used in other product line activ-
ities e.g. to identify similar groups of products that
can be manufactured on the same assembly lines
(Yuzgec, 2012, Kashkoush, 2014), for reverse engi-
neering a requirements repository (Li, 2019), for re-
verse engineering software components (Naseem,
2017), to detect adverse interactions when a new fea-
ture is introduced into an ageing software product line
(Khoshmanesh, 2018).
Section 2 discusses some challenges of making
product comparisons. Section 3 presents a similarity
evaluation process using a mobile phone product line
worked example. Section 4 shows a small real-world
iPhone example. Section 5 discusses these ideas.
2 BACKGROUND
Product comparison can have different purposes. One
is to determine how products of the same type differ-
ent for strategic product positioning and branding rea-
sons. This might be competitors’ products or the or-
ganization’s own products. A second purpose might
be to gauge if a product line needs to be reorganised.
A third purpose might be to understand if a product
falls within the legislative and regulatory boundaries
of the countries where the product is being sold. Com-
parison and decision-making criteria vary. They will
often include product similarity but other criteria are
also used e.g. perceived customer value of specific
features, sales, costs of maintenance, prices and prof-
its.
Within product management, different ap-
proaches to product overlap have been developed.
Examples include a product similarity scale across
different product categories to aid marketing manag-
ers, consumer policymakers, and market researchers
(Walsh, 2010); a model showing how the similarity
between two products can monotonically increase,
monotonically decrease, or have a non-monotonic ef-
fect on cross-price elasticity (Kolay, 2018); and a
neural network to collate product descriptions of the
same retail product on different e-shops but in differ-
ent formats (Ristoski, 2018).
Similarity matching can be seen in the context of
search-based software engineering (Jiang, 2017,
Lopez-Herrejon, 2015). The value of similarity repre-
sentations, algorithms, and metrics was explored in
(Cesare, 2012) for cybersecurity applications, such as
malware classification, software theft detection, pla-
giarism detection and code clone detection. Product
line similarity models and metrics were proposed for
mining variability from software repositories (Kaindl,
2014, Mannion, 2015). In (Vale, 2015) metric thresh-
olds were identified to support the evaluation of soft-
ware product line component quality. A review of
metrics for analyzing software product line variability
is set out in (El-Sharkawy, 2019).
There are different product comparison strategies.
One strategy is to compare only the total number of
common features in both products, though a compli-
cating factor is whether to include or exclude negative
matches i.e. does the absence of features advance the
case for similarity or not? Another strategy is to com-
pare only the total number of features that are differ-
ent between the two products. Another variation is to
compare only selected sets of features e.g. the most
interesting or distinguishing.
The choice of feature representation mechanism is
influenced by different factors including its purpose,
the ease with which it is understood and the complex-
ity of encoding the features into that representation.
For example, if there are a large number of compari-
sons to be made, then there is often a trade-off be-
tween a clear understanding of the representation
structure and the complexity of any processing using
that structure.
After choosing a product comparison strategy, the
next step is to choose a comparison metric. Some
metrics measure similarity, others dissimilarity
(Chen, 2009). Similarity metrics often have as a nu-
merator a function of the total number of features that
are the same in each product. Dissimilarity metrics
often have as a numerator a function of the total num-
ber of features that are different in each product. The
denominator is a function of the total number of fea-
tures but varies depending upon the inclusion or ex-
clusion of features absent in both products.
Similarity metrics continue to emerge from differ-
ent fields and applications e.g. industrial product de-
sign (Shih, 2011), linguistics (Coban. 2015), ecology
(Dice. 1945, Niesterowicz. 2016), population analy-
sis (Jaro, 1989). However, the combination of the ap-
plication context, the range of information and data
types, the choice of information representation mech-
ICEIS 2021 - 23rd International Conference on Enterprise Information Systems
258
anisms, and the intended use, have influenced the de-
sign and description of many metrics making it diffi-
cult to form comparative judgements. (Choi, 2010)
compared 76 binary similarity and dissimilarity met-
rics, observing close relationships between some of
them. Of the 76, 59 were similarity metrics (20 of
these excluded negative matches i.e. B
00
), and 17
were dissimilarity metrics (12 excluded negative
matches).
New similarity metrics were developed for im-
proving learning algorithms in (Yazdani, 2016). An
adaptation of the Hamming distance (Hamming,
1950) was used in (Al-Hajjaji, 2019) to prioritize the
testing order of a subset of products. In (Al-Hajjaji,
2018), test reduction times are a significant, though
not the only, motivating factor, for computing the
similarity between products by adding a measure of
problem-based similarity (e.g. a feature model) to a
measure of solution-based similarity (e.g. code frag-
ments). Several approaches exist for using similarity
metrics to make testing more efficient (Henard, 2014,
Sanchez, 2014, Devroey, 2016, Sahak, 2017).
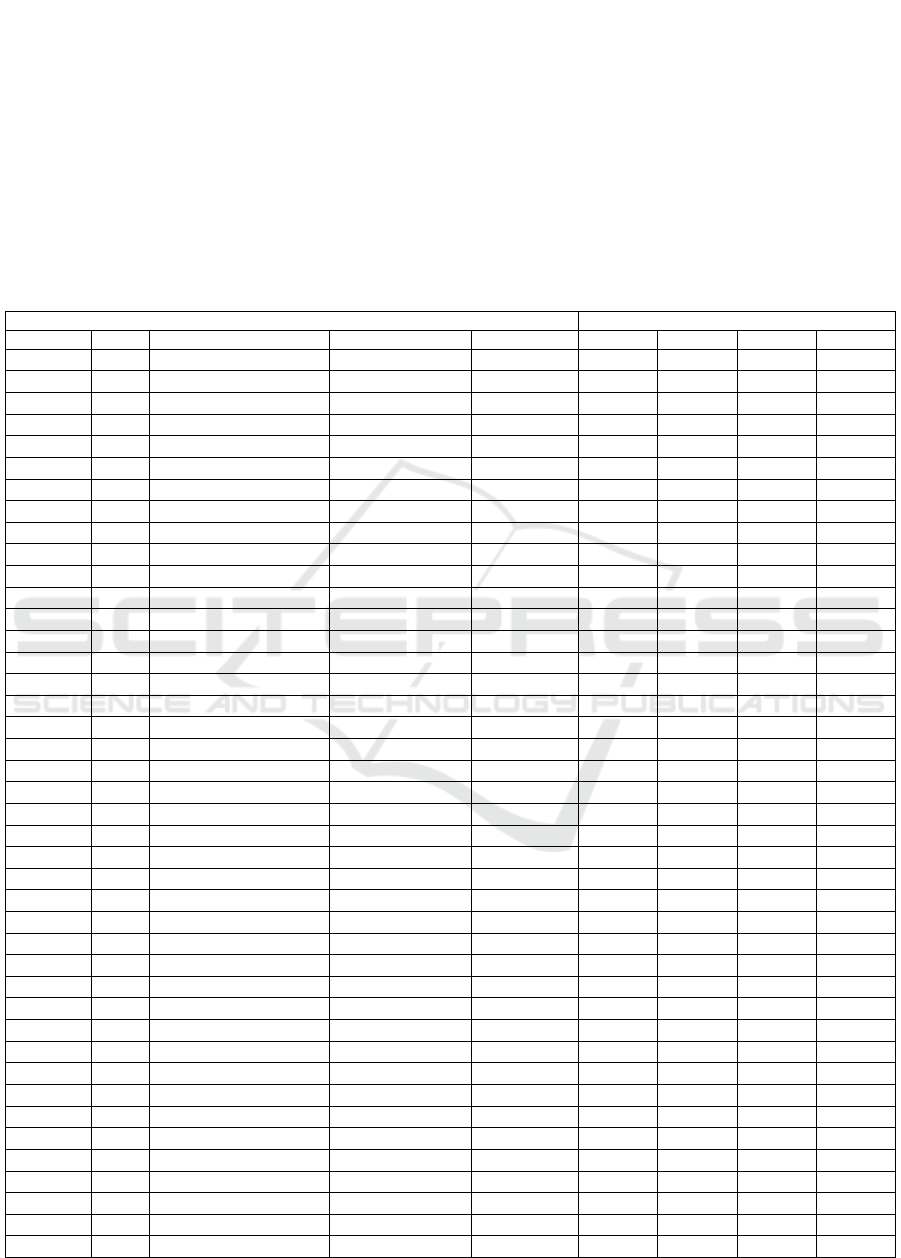
Table 1: Mobile Phone Product Line and Four Derived Products.
PLATFORM PRODUCTS
Feature Id No. Feature Variability Type Tree Level Basic Business Leisure Gold
F1 1 Mobile Phone Mandatory 1
✔ ✔ ✔ ✔
F2 2 Profile Settings Mandatory 2
✔ ✔ ✔ ✔
F2.1 3 Audio Mandatory 3
✔ ✔ ✔ ✔
F2.2 4 Display Mandatory 3
✔ ✔ ✔ ✔
F3 5 Connection Settings Mandatory 2
✔ ✔ ✔ ✔
F3.1 6 Mobile Data Mandatory 3
✔ ✔ ✔ ✔
F3.2 7 Wi-Fi Mandatory 3
✔ ✔ ✔ ✔
F3.2.1 8 802.11ac Exclusive-OR 4
✔
✔
F3.2.2 9 802.11ax Exclusive-OR 4
✔
✔
F3.3 10 Bluetooth Mandatory 3
✔ ✔ ✔ ✔
F3.3.1 11 5.0 Exclusive-OR 4
✔
✔
F3.3.2 12 4.0 Exclusive-OR 4
✔
✔
F4 13 Storage Settings Mandatory 2
✔ ✔ ✔ ✔
F4.1 14 4Gb Exclusive-OR 3
✔ ✔
F4.2 15 8Gb Exclusive-OR 3
✔ ✔
F5 16 Screen Settings Mandatory 2
✔ ✔ ✔ ✔
F5.1 17 Basic Exclusive-OR 3
✔
F5.2 18 High Definition Exclusive-OR 3
✔ ✔ ✔
F6 19 Sensors, Device Drivers Mandatory 2
✔ ✔ ✔ ✔
F6.1 20 Front Camera Mandatory 3
✔ ✔ ✔ ✔
F6.2 21 Rear Camera Optional 3
✔ ✔
F6.3 22 GPS Optional 3
✔ ✔ ✔
F6.4 23 Gyroscope Optional 3
✔
F6.5 24 Heart rate Optional 3
✔
F6.6 25 Barometer Optional 3
✔
F6.7 26 Accelerometer Optional 3
✔ ✔
F7 27 Mobile Messages Mandatory 2
✔ ✔ ✔ ✔
F7.1 28 Text Message Mandatory 3
✔ ✔ ✔ ✔
F7.2 29 Voice Message Optional 3
✔ ✔ ✔ ✔
F7.3 30 Video Message Optional 3
✔ ✔ ✔
F8 31 Mobile Calls Mandatory 2
✔ ✔ ✔ ✔
F8.1 32 Video Call Optional 3
✔ ✔ ✔
F8.2 33 Voice Call Mandatory 3
✔ ✔ ✔ ✔
F9 34 Security Mandatory 2
✔ ✔ ✔ ✔
F9.1 35 Passcode Mandatory 3
✔ ✔ ✔ ✔
F9.2 36 Voice Recognition Optional 3
✔
✔
F9.3 37 Fingerprint Recognition Optional 3
✔ ✔ ✔
F9.4 38 Face Recognition Optional 3
✔
✔
F10 39 Games Optional 2
✔ ✔ ✔
F10.1 40 Words For Friends Optional 3
✔ ✔ ✔
F10.2 41 Angry Birds Optional 3
✔ ✔
F10.3 42 Candy Crush Optional 3
✔ ✔
Using Binary Strings for Comparing Products from Software-intensive Systems Product Lines
259

3 PRODUCT SIMILARITY
EVALUATION PROCESS
The product similarity evaluation process we use is
(i) construct a product line feature model (ii) derive
product configurations from the model (iii) represent
each configuration as a binary string - 1s indicate a
feature’s presence, 0s its absence (iv) add a weight to
each feature (v) compare the weighted binary strings
using the JC (vii) explore the significance of specific
features on similarity by modifying the weights.
3.1 Product Line Feature Models
Product line feature models are often represented as
feature trees with additional cross-cutting constraints
(Benavides, 2010). Such models are large when prod-
uct lines have hundreds or thousands of features. De-
composition using sub-trees helps understanding.
Some product lines consist of other product lines e.g.
a camera in a mobile phone. Sometimes, abstract fea-
tures are included in the models to aid modelling and
understanding, but they are not implemented in any
product. Table 1 shows a mobile phone product line
feature model. The Basic phone enables telephone
calls or text messages. The Business phone offers
high-quality communication tools. The Leisure phone
is a communication and entertainment tool. The Gold
phone has the most features. There are several sub-
trees: Profile Settings, Connection Settings, Storage
Settings, Screen Settings, Sensors and Device Driv-
ers, Mobile Messages, Mobile Calls, Security,
Games.
3.2 Product Configuration
A product configuration is a product selected from a
product line feature model. Our concern is with fea-
tures rather than design or implementation assets. We
assume all constraints have been resolved during the
configuration process and a verifiable product selec-
tion made. Example 1 shows the product feature con-
figurations for the four mobile phone products con-
verted to binary strings.
Example 1.
Basic: 111111110101110110110000001110101110000000
Bus: 111111101110110101110100001111111111111100
Leis: 111111110101101101111100011111111110101111
Gold: 111111101110101111111111111111111111111111
Let a string S contain a set of N feature elements e
i
such that S = e
1
e
2
e
3
e
4
e
5
… e
N
. We assume all pos-
sible feature and feature attribute selections are repre-
sented in a single string, that N is the same for each
product, and that each feature element is in the same
position in the string regardless of the order of feature
selection during feature model construction. How-
ever, one challenge is the binary string representation
of a feature attribute value when there is a wide range
of values to select from. Consider the feature F5
Screen Settings. Suppose a new feature attribute
ScreenColor has a value selected from a palette of
100 discrete colour values each expressed as an inte-
ger. Representing each colour with a unique string el-
ement is cumbersome. If the range of values for a fea-
ture attribute was a set of real numbers, it would not
be plausible. We address this issue for pairwise prod-
uct comparison, where the first product’s attribute-
value combination is represented as a 1. If the second
product’s attribute-value is the same then it is repre-
sented as a 1, if different as a 0. Examples 2 and 3
illustrate for ScreenColor.
Example 2.
Suppose the ScreenColor attribute for the Basic
Phone and the Business Phone is Blue. This is repre-
sented initially as
Basic: 1111111101011101 (Color, Blue) 10110000001110101110000000
Bus:
1111111011101101 (Color, Blue) 01110100001111111111111100
which can be transformed into
Basic: 1111111101011101 1 10110000001110101110000000
Bus.
1111111011101101 1 01110100001111111111111100
Example 3.
Suppose the ScreenColor attribute for the Basic
Phone is Blue and for the Business Phone is Green.
This would be represented initially as
Basic: 1111111101011101 (Color, Blue) 10110000001110101110000000
Bus.
1111111011101101 (Color, Green) 01110100001111111111111100
which can be transformed into
Basic: 1111111101011101 1 10110000001110101110000000
Bus.
1111111011101101 0 01110100001111111111111100
3.3 Allocating Weights
For weighted binary strings a weight w
i
can be at-
tached to each element e
i
in the binary string. Weights
are defined for features in the product line model and
allocated to each feature in each product derived from
the product line model.
For large feature trees, the allocation of a weight
for each feature is only feasible if automated but with
manual override. One approach to automatic alloca-
tion is to recognise that the features upon which many
others depend are located in the higher levels of a fea-
ture tree. In Figure 1 the highest level is F1, at Level
1, then F2, F3, F4 are at Level 2, and so on. We can
then add weights to each of the string position varia-
bles in proportion to the Level of the match i.e.
ICEIS 2021 - 23rd International Conference on Enterprise Information Systems
260
Level 1: weight 1.00
Level 2: weight 0.75
Level 3: weight 0.5
Level 4: weight 0.25
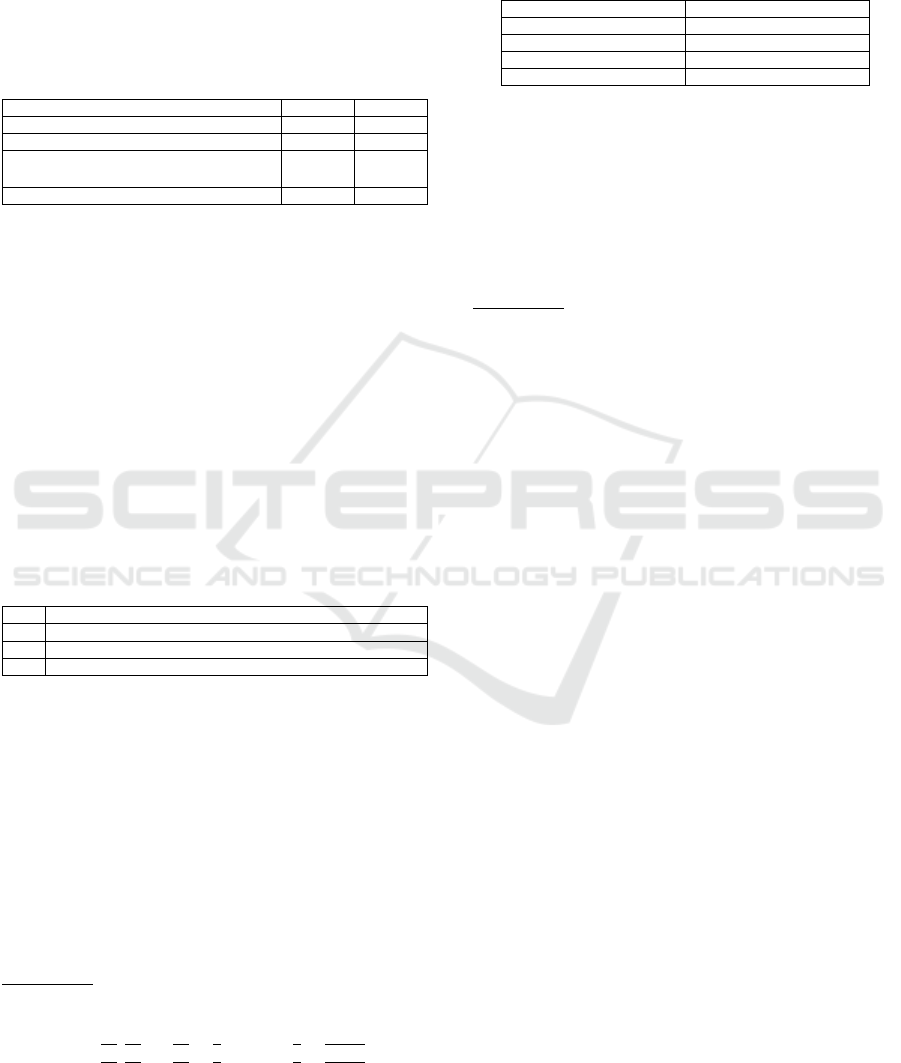
Table 2 shows the weights for each string posi-
tion. The weights are arbitrarily selected but can be
modified. Suppose we compare the Basic and Busi-
ness Phones (N= 42).
Table 2: Level Weights - Mobile Phone Product Line.
Mobile Phone String Position Level Weight
1 1 1
2,5,13,16,19,27,31,34,39 2 0.75
3,4,6,7,10,14,15,17,18,20,21,22,23,24,25,26,
28,29,30,32,33,35,36,37,38,40,41,42
3 0.5
4,5,6,8,9,11,12 4 0.25
Level: 123323344344233233233333332333233233332333
Basic:
111111110101110110110000001110101110000000
Bus:
111111101110110101110100001111111111111100
3.4 Calculating Similarity
Binary string similarity metrics can be described us-
ing a small set of string variables. Table 3 shows four
distinct string variables when comparing two binary
strings B1 and B2 each with N digits. Equations
(1)−(4) show calculations for each string variable,
where PA
i
is the value of the digit at the ith position
of the binary string representing Product PA, and PB
i
is the value of the digit at the ith position of the binary
string representing Product PB.
Table 3: String Variables.
B
11
the number of binary digits where e
i
in B1 is 1 and e
i
in B2 is 1.
B
00
the number of binary digits where e
i
in B1 is 0 and e
i
in B2 is 0.
B
01
the number of binary digits where e
i
in B1 is 0 and e
i
in B2 is 1.
B
10
the number of binary digits where e
i
in B1 is 1 and e
i
in B2 is 0.
N
B
11
= Σ PA
i
| (PA
i
=1, PB
i
=1) (1)
i=0
N
B
00
= Σ PA
i
| (PA
i
=0, PB
i
=0) (2)
i=0
N
B
01
= Σ PA
i
| (PA
i
=0, PB
i
=1) (3)
i=0
N
B
10
= Σ PA
i
| (PA
i
=1, PB
i
=0) (4)
i=0
Example 4.
Consider the Basic and Business phones
Basic: 111111110101110110110000001110101110000000
Bus: 111111101110110101110100001111111111111100
The underlined numbers (features 8, 9, 11, 12, 17,
18, 22, 25, 32, 36, 37, 38, 39, 40) show the differences
between the products. Table 4 shows the value of
each string variable (PA is the Basic phone and PB is
the Business phone).
Table 4: Comparison of Basic and Business Phones.
String Variable Basic v Business
B
11
20
B
00
8
B
01
11
B
10
3
The JC is defined as
JC= (B
11
) / (B
11
+ B
01
+ B
10
)
The JC is intuitive in that the numerator is the total
number of features in each product that do match, and
the denominator is the total number of features that
do match plus the total number of features that do not
match. It excludes negative matches.
Example 5.
JC= 20 / (20 + 11 + 3) = 0.59
Example 5 shows the JC similarity value for the Basic
and Business phones. Note that only 34 of the 42 total
product line features were included in this calculation
because 8 features are absent in both products i.e.
negative matches.
Weighted Binary String Metrics.
Using the weighted features from Table 2, Equations
(1)−(4) are adapted to become Equations (5)−(8).
N
B
11
= Σ w
i
PA
i
| (PA
i
=1, PB
i
=1) (5)
i=0
N
B
00
= Σ w
i
PA
i
| (PA
i
=0, PB
i
=0) (6)
i=0
N
B
01
= Σ w
i
PA
i
| (PA
i
=0, PB
i
=1) (7)
i=0
N
B
10
= Σ w
i
PA
i
| (PA
i
=1, PB
i
=0) (8)
i=0
Using Equations (5)−(8), B
11
, B
00
,
B
01
, B
10
become
B
11
=
(1
1
+0.75
2
+0.5
3
+0.5
4
+0.75
5
+0.5
6
+0.5
7
+0.75
13
+0.5
14
+
0.75
16
+0.75
19
+0.5
20
+0.75
27
+0.5
28
+0.5
29
+ 0.75
31
+ 0.5
33
+ 0.75
34
+ 0.5
35
)
= 12.50
B
00
= ((0.5
15
+ 0.5
21
+ 0.5
23
+ 0.5
24
+ 0.5
25
+ 0.5
26
+
0.5
41
+ 0.5
42
) = 4
B
01
=
(0.25
9
+0.25
11
+0.5
18
+0.5
22
+0.5
30
+0.5
32
+0.5
36
+0.5
3
7
+0.5
38
+0.75
39
+0.5
40
) = 5.25
B
10
= (0.25
8
+ 0.25
12
+ 0.5
17
) = 1.0
Using Binary Strings for Comparing Products from Software-intensive Systems Product Lines
261
Hence, for the Basic and Business phones
JC
w
= 11.75/(11.75+5.25+1.5)=0.67.
The increase in similarity between the two phones
from 0.59 (Example 5) to 0.67 (Example 6) reflects
the privileging for features higher up the feature tree.
3.5 Benchmarking
String similarity metrics can be used to benchmark
products in a product line and show how this compar-
ison varies over time.
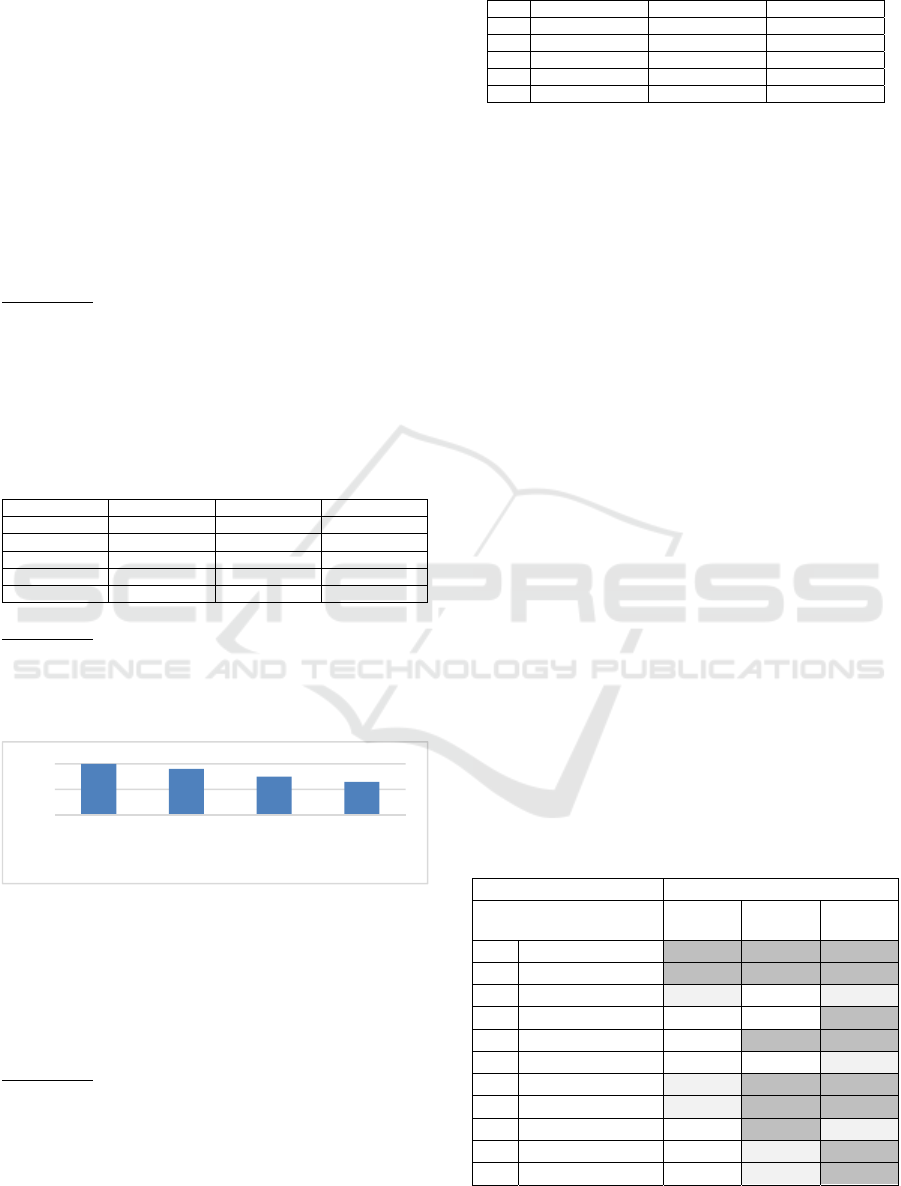
Product Comparison.
Example 6.
Suppose we want to understand the degree of similar-
ity of the Basic, Business and Leisure Phones in com-
parison to the Gold phone as a benchmark. The JC
values in Table 5 reveal how the Business and Leisure
phones compare similarly to the Gold phone and are
different from the Basic phone.
Table 5: Benchmarking Product Comparison.
String Variable Basic v Gold Business v Gold Leisure v Gold
B
11
19 30 31
B
00
0 2 2
B
01
19 8 7
B
10
4 1 2
JC 0.45 0.77 0.78
Example 7.
Figure 1 is an example of how the Leisure and Gold
phones increase in similarity over time. Subsequent
analyses might show if this was planned and the im-
pact on profits.
Figure 1: Overall Product Comparison Over Time.
Feature Comparison.
Comparisons can be holistic comparisons, with all
features and partial, with feature subsets. A similarity
metric is computed using only the relevant elements
of the binary string for those features.
Example 8.
To compare the Security features F9 to F9.4 in each
phone, the similarity metric is computed using only
the relevant elements of the binary string i.e. N=5.
Basic: 11000
Business: 11111
Leisure: 11010
Gold: 11111
Table 6: Comparison of Security Features.
Basic v Gold Business v Gold Leisure v Gold
B
11
2 5 3
B
00
0 0 0
B
01
3 0 2
B
10
0 0 0
JC 0.4 1.0 0.6
The JC values in Table 6 reveal how the Business
phone is the same as the Gold phone on Security even
though the Leisure phone is slightly more similar
overall to the Gold phone (Table 5).
Product and Feature Comparisons.
Table 7 shows the JCs for weighted binary string rep-
resentations of the three mobile phones when com-
pared to the Gold phone. Whereas the Business and
Leisure phones compare similarly to the Gold phone,
they differ at F3, F4, F9, F10. The shading is illustra-
tive to show how similarity threshold values may help
to highlight these differences. We have arbitrarily se-
lected dark shading for high similarity i.e. a JC >0.75,
light shading for medium similarity i.e. a JC > 0.5 and
<0.75, and no shading for weak similarity i.e. a JC
less than 0.5.
The difference in JC values of the unweighted
overall product comparisons (Table 6) and weighted
overall product comparisons (Table 7) reflects the
privileging for similarity at Levels 1 and 2, and there
being fewer features at Level 4.
As products evolve the significance value of indi-
vidual features changes. In Table 7 the calculations of
the JC
w
for the Security features assume that Finger-
print Recognition and Face Recognition are set to 0.5
(see Table 1, features 37 and 38) and Table 2. If these
two features were accorded greater significance and
given weights of 1.0. the JC
w
for F9 would change to
0.33, 1.00. 0.6 (cf. 0.45, 1.00, 0.64) and the JC
w
for
the product would change to 0.51, 0.80 and 0.82.
Table 7: Comparison of Weighted Security Features.
Feature Jaccard Coefficients
Basic
& Gold
Business
& Gold
Leisure
& Gold
F1 Mobile Phone 1 1 1
F2 Profile Settings 1 1 1
F3 Connection Settings 0.69 1.00 0.69
F4 Storage Settings 0.43 0.43 1.00
F5 Screen Settings 0.43 1.00 1.00
F6 Sensors, Dev Drivers 0.29 0.41 0.65
F7 Mobile Messages 0.78 1.00 1.00
F8 Mobile Calls 0.71 1.00 1.00
F9 Security 0.45 1.00 0.64
F10 Games 0.00 0.56 1.00
JC
0.53 0.79 0.84
0
0.5
1
Gold Leisure
2019
Leisure
2018
Leisure
2017
ICEIS 2021 - 23rd International Conference on Enterprise Information Systems
262
4 IPHONE EXAMPLE
To sense-check the value of these ideas we applied
them to a small real-world example. Apple has many
different software-intensive iPhone products. Table 8
shows 131 features in a product line of five iPhones:
iPhone 11 Pro Max, iPhone 11, iPhone XS, iPhone X,
iPhone 8, each one assumed to have 64Gb RAM (see
https://socialcompare.com/en/comparison/apple-iph-
one-product-line-comparison, accessed 14.02.21).
We reverse-engineered a product line feature
model from these feature sets. Table 9 shows part of
the iPhone product line feature model. For each of the
5 phones × 131 features i.e. 655 phone/feature com-
binations, a feature selection value (0/1) was made
and a weight allocated. We adopted the weight allo-
cation model used in the worked example.
The (B
ij
) string variables for each pairwise com-
parison were then calculated. Table 10 shows an un-
weighted comparison of the iPhone 11 Pro Max
against the other four iPhones. Table 11 shows the
same comparison but with weights from Table 9 at-
tached to each feature.
Table 8: iPhone Features.
Feature No. of Features
iPhone 1
Dimensions 37
Storage 11
Screen 17
Camera 22
Processor 4
Connection Settings 11
Sensors 5
Security & Safety 11
Battery (Wireless Charging, Capacity) 12
Table 9: iPhone Feature tree.
Feature Feature Tree Level Weight
iPhone Level 1 1
…….
Connection Settings Level 2 0.75
…..
Bluetooth Level 3 0.5
5.0 Level 4 0.25
4.0 Level 4 0.25
Table 10: Comparison of Unweighted iPhone Features.
iP11 v
iP11 Pro Max
iPXS v
iP11 Pro Max
iPX v
iP11 Pro Max
iP8 v
iP11 Pro Max
B
11
52 52 51 48
B
00
52 51 50 47
B
01
13 14 15 18
B
10
14 14 15 18
JC 0.66 0.65 0.63 0.57
Table 11: Comparison of Weighted iPhone Features.
iP11 v
iP11 Pro Max
iPXS v
iP11 Pro Max
iPX v
iP11 Pro Max
iP8 v
iP11 Pro Max
B
11
28.5 28 28 26.75
B
00
15 13.5 13.25 12.25
B
01
3.25 4.25 4.25 5.5
B
10
3.75 4 4.25 5.25
JC
w
0.8 0.78 0.78 0.72
Table 10 shows the level of the similarity to the iPh-
one11 Pro Max of all four phones is within a 10%
margin (0.57 to 0.66). Table 11 shows the same pat-
tern but the similarity to the iPhone11 Pro Max of all
four phones is higher (0.72-0.8). Tables 12 and 13
show these comparisons broken down by feature.
These kinds of quantitative results might inform
questions and answers about the product assortment
strategy such as: to what extent do levels of similarity
affect brand reputation, customer confusion, sales,
profits, product roadmaps, pricing strategies and
online vs offline channel mix? what are the similarity
thresholds beyond which these variables are nega-
tively affected? what effect will new product varia-
tions have on the company’s market share?
Table 12: iPhone Features Unweighted.
Feature Similarity to iP Pro Max
iP11 iPXS iPX iP8
iPhone Root 100 100 100 100
Dimensions 38 38 38 46
Storage 56 75 86 86
Screen 40 56 56 40
Camera 71 67 63 50
Processor 100 33 33 33
Connections 100 80 64 64
Sensors 100 100 100 100
Security 75 75 75 56
Battery 60 60 60 60
JC 0.66 0.65 0.63 0.57
Table 13: iPhone Features with Weights.
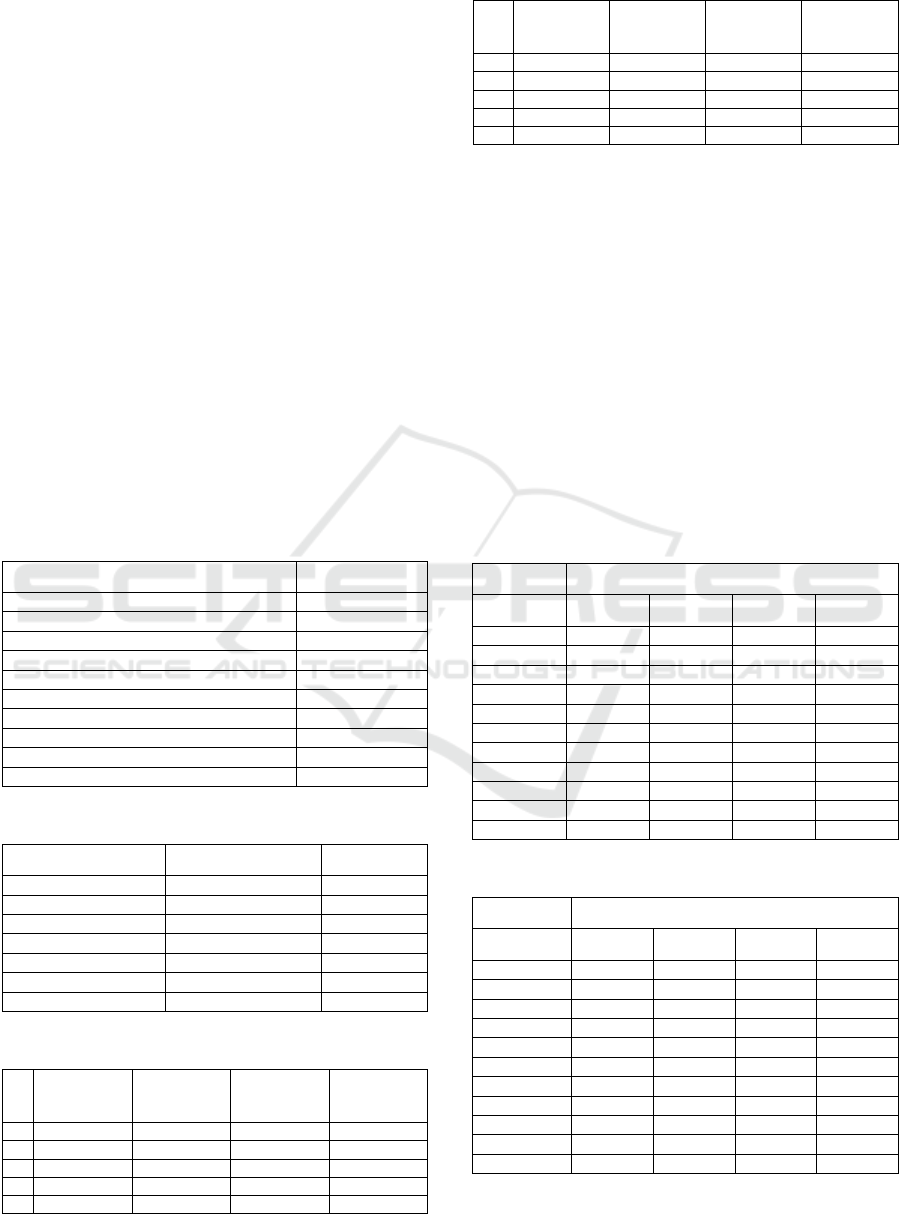
Feature Similarity to iP Pro Max
iP11 iPXS iPX iP8
iPhone Root 100 100 100 100
Dimensions 58 58 58 63
Storage 73 86 92 92
Screen 60 71 71 60
Camera 78 75 76 63
Processor 100 33 33 33
Connections 100 91 83 83
Sensors 100 100 100 100
Security 87 87 87 65
Battery 78 78 78 78
JC
w
0.8 0.78 0.78 0.72
Using Binary Strings for Comparing Products from Software-intensive Systems Product Lines
263

5 DISCUSSION
Product Configuration.
Converting product configuration selections to a bi-
nary string is intuitive and simple. Binary strings can
also be helpful when product comparisons must be
made with incomplete information. For example,
when comparing two phones, the differences in the
technical specification of their cameras may be of lit-
tle interest. This can be managed by setting to 0 all
the sub-features of the camera in each phone. The im-
pact of this technique is more effective when the met-
ric excludes negative matches (B
00
).
During product configuration, the order of feature
selection will vary by engineer. Feature selection
methods may be significant-feature first, depth-first,
breadth-first, a combination of or none of these. They
may also be influenced by how a product line feature
model is presented visually e.g. tree structure, graph.
In this work, feature selection order is not important
per se provided the features in the configurations of
the products being compared are always in the same
order i.e. the position in the binary string of each fea-
ture element is fixed at the same position for each
product under comparison.
We assume that the product configuration selected
satisfies the constraints of the product line feature
model. To do this is complex, especially for large
product line feature models with cross-cutting con-
straints, but progress is being made (Yi, 2018).
When a new feature is to be added to a product,
the data structure choices are (i) change the product
line feature model and the feature configuration (ii)
change only the product feature configuration. If (i) is
chosen, the constraint that all products will have an
equal number of features will hold. If (ii) is chosen,
the lengths of the binary strings for each phone will
be different. For comparing, the feature must be
added to all phones but given a 0 value.
Example 9.
Suppose we add a new security feature F9.5 IrisRec-
ognition only to the product configuration of the Gold
phone, and add this to the tail of the binary string. The
binary string for Gold will have 6 elements whereas
the other phones will have 5.
Basic: 11000
Business: 11111
Leisure: 11010
Gold: 111111
To simplify the similarity computation, we can add
this element to the other phones but with the value 0.
Basic: 110000
Business: 111110
Leisure: 110100
Gold: 111111
Similarly, when a feature is deleted from some prod-
ucts but is left in others, then for comparison one so-
lution is to leave the feature element in the binary
string but with a value of 0.
In principle, a binary string representation can be
used to benchmark against a competitor’s products.
We recognise there would be a cost to understanding
the competitor’s products, to transcribe them into bi-
nary string representations such that each feature was
mapped to the appropriate string element positions to
enable comparisons, and that the comparisons will
only be as good as the publicly available information
about competitor’s products.
Allocating Weights.
The impact of changing the weight of a single feature
on an overall product JC value will vary with the
number of features in the tree. However, in principle,
a product manager can explore the significance of in-
dividual features and feature combinations on overall
product similarity.
In both the worked and iPhone examples we se-
lected an allocation of weights in which features close
to the root carry more significance. We do not claim
this is optimal. For example, from the perspective of
implementation, one may argue that those closer to
the leaves carry more significance. What is important
is to choose a weights allocation method that is easy
to understand and adjustable.
In the iPhone example, each feature was allocated
a Level and each Level allocated a weight. For a few
hundred features, manual allocation is as efficient as
designing and implementing an automated algorithm.
However, it is untenable for much larger feature sets
and plays to the need for a weights allocation method
that is easy to automate, like the one we proposed.
Calculating Similarity.
The value of a similarity matching algorithm is pro-
portionate to the effort required to set up the data it
relies upon. The calculations of the binary string var-
iables in the similarity metrics in Table 3 are compu-
tationally light.
We argued for metrics that exclude negative
matches and chose the JC as an example. There are
benefits and limitations of including or excluding
negative matches (see Choi, 2010). Resolving opti-
mal solutions for this application context is a chal-
lenge. However, one criterion will be the degree of
similarity granularity sufficient for the comparison
e.g. if two metrics generate values within 5% of each
other and a 10% margin is sufficient for decision-
making then it may not matter which metric is used.
Benchmarking.
A benefit of product descriptions being represented
ICEIS 2021 - 23rd International Conference on Enterprise Information Systems
264

by binary strings is that benchmarking using pairwise
comparisons is straightforward. Another benefit is
that binary string matrices can be formed to enable
multi-comparisons using clustering algorithms that
can help assess the effectiveness of a product line.
One expects a degree of clustering because the pur-
pose of a product line is to leverage development ef-
ficiency gains from commonalties. However, as prod-
uct lines evolve, feature significance values alter. By
modifying feature weights new clusters may emerge
that inform strategic discussions about single or mul-
tiple product lines (Savolainen, 2012).
Benchmarking can also be used as an information
source when evaluating product manager perfor-
mance e.g. when product managers add new features
to increase short-term sales but neglect product dis-
tinctiveness causing customer confusion reducing
long-term sales.
When comparing against regulatory compliance,
a similarity measure is of less value than testing for
the presence of a feature or not, unless a business de-
cision has been taken to exceed minimum compliance
when a dissimilarity metric may be useful. Similarity
assessment may also help during development to
evaluate a candidate configuration from which to cre-
ate a compliant product.
6 CONCLUSION
Product buyers and sellers often make product com-
parisons and decisions. As product lines grow in
scale, scope and complexity, it is difficult to carry out
these comparisons. For an inexperienced product
manager, product comparison tools can help quickly
gain oversight of a product line. Even for experienced
product managers who have a deep understanding of
their product lines, product comparison tools can aid
with scale and scope management.
We described a product similarity evaluation pro-
cess that is based on configuring new products from
a product line feature model. We discussed different
issues for each of the process steps. We represented a
product configuration as a binary string and used a
binary string similarity metric to compare products.
We allocated weights to each feature and recom-
mended that the weights allocation method was easy
to understand and automate. However, changing indi-
vidual weights can reflect the changing significance
of individual features over time. We showed the fea-
sibility of our ideas with a small iPhone example. The
next step is to apply them to a larger more complex
product line. Our application focus was a comparison
of products from the same product line. However, the
technique can be used to compare products from dif-
ferent product lines e.g. competitor products.
REFERENCES
Al-Hajjaji, M., Schulze, M., Ryssel, U., 2018. Similarity of
Product Line Variants. In 22nd Int’l Systems & Soft-
ware Product Line Conf, 226-235.
Al-Hajjaji, M., Thüm, T., Lochau, M., Meinicke, J., Saake,
G., 2019. Effective product-line testing using similar-
ity-based product prioritization, In Softw. & Systems
Modeling, 18, 1, 499-521.
Benavides, D., Segura, S., Ruiz-Cortes, A., 2010. Auto-
mated Analysis of Feature Models 20 years Later: A
Literature Review. In Information Systems, 35, 615-
636.
Cesare, S., Xiang, Y., (Ed.), 2012. In Software. Similarity
and Classification, Springer.
Chen, S., Ma, B., Zhang, K., 2009. On the Similarity Metric
and the Distance Metric. In Theoretical Comp Sci,4,
2365-2376.
Choi, S., Cha, S., Tappert, C., 2010. A Survey of Binary
Similarity and Distance Measures. In Systemics, Cyber-
netics and Informatics, 8, 1, 43-48.
Coban, O., Ozyer, B., Guisah, T., 2015. A Comparison of
Similarity Metrics for Sentiment Analysis on Turkish
Twitter Feeds, Sentiment Analysis. In IEEE Int’l Conf,
333-338.
Deloitte Consumer Review Made-to-order: The rise of
mass personalisation, 2015.
Devroey, X., Perrouin, G., Legay, A., Schobbens, P-Y.,
Heymans, P., 2016. Search-based Similarity-driven Be-
havioural SPL Testing. In 10
th
Int’l Workshop on Vari-
ability Modelling of Software-intensive Systems
(VaMoS’16), 89-96.
Dice, L., 1945. Measures of the Amount of Ecologic Asso-
ciation Between Species. In Ecology, 26, 3, 297–302.
El-Sharkawy, S., Yamagishi-Eichler, S., Schmid, K., 2019.
Metrics for analyzing variability and its implementation
in software product lines: A systematic literature re-
view, In Info & Softw. Technology,106,1-30.
Hamming, R., 1950. Error Detecting and Error-Correcting
Codes, In Bell Syst. Tech. J., 29, 2, 47–160.
Henard, C., Papadakis, M., Perrouin, G., Klein, J., Hey-
mans, P., Le Traon, Y.L (2014). By Passing the Com-
binatorial Explosion: Using Similarity to Generate and
Prioritize T-Wise Test Configurations for Software
Product Lines, In IEEE Trans. Softw. Eng., 40, 7, 650–
670.
Jaccard, P., 1901. Distribution de La Flore Alpine dans Le
Bassin Des Dranses et Dans Quelques Régions
Voisines. In Bulletin de la Société Vaudoise des Sci Na-
turelles, 37, 241-272.
Jaro, M., 1989. Advances in Record-Linkage Methodology
as Applied to Matching the 1985 Census of Tampa,
Florida. In J. of the American Statistical Association,
84, 414–420.
Using Binary Strings for Comparing Products from Software-intensive Systems Product Lines
265

Jiang, H., Tang, K., Petke, J., Harman, M., 2017. Search-
Based Software Engineering (Guest Editorial). In IEEE
Computational Intelligence Magazine, 12, 2, 23-71.
Kashkoush, M., Elmaraghy, H., 2014. Product Family For-
mation for Reconfigurable Assembly Systems. In Pro-
cedia CIRP 17, 302–307.
Kaindl, H., Mannion, M., 2014. A Feature- Similarity
Model for Product Line Eng, In 14th Int’l Conf on Soft-
ware Reuse, 35-41.
Li, Y., Yue, T., Ali, S., Zhang, L., 2019. Enabling auto-
mated requirements reuse and configuration. In Softw.
& Systems Modelling, 18, 2177–2211.
Lopez-Herrejon, R., Linsbauer, L., Egyeds, A., 2015. A
systematic mapping study of search-based software en-
gineering for software product lines. In Info & Softw.
Tech, 61,33–51.
Mannion, M., Kaindl, H., 2015. Using Similarity Metrics
for Mining Variability from Software Repositories. In
18th ACM Int’l Softw. Product Line Conf, 2, 32-35.
Mitchell, V., Papavassiliou, V., 1999. Marketing causes and
implications of consumer confusion. In J of Product
and Brand Management, 8, 319–339.
Niesterowicz, J., Stepinski, T., 2016. On using Landscape
Metrics for Landscape Similarity Search. In Ecol Indi-
cators, 64,5,20-30.
Punyatoya, P., 2013. Consumer Evaluation of Brand Exten-
sion for Global and Local Brands: The Moderating Role
of Product Similarity. In J. of Int’l Consumer Market-
ing, 25:3,198-215.
Naseem, R., Deris, M., Maqbool, O., Li, J., Shahzad, S.,
Shah, H., 2017. Improved Binary Similarity Measures
for Software Modularization. In Frontiers of Infor-
mation Technology and Engineering, 18, 8, 1082-1107.
Khoshmanesh, A., Lutz, S., 2018. The Role of Similarity in
Detecting Feature Interaction in Software Product
Lines. In Int’l Symposium on Softw. Reliability Eng
Workshops,286-292.
Kolay, S., Tyagi, R., 2018. Product Similarity and Cross-
Price Elasticity, In Review of Industrial Organization,
52,1,85-100.
Ristoski, P., Petrovski, P., Mika, P., Paulheim, H., 2018. A
Machine Learning Approach for Product, Matching and
Categorization. In Semantic Web, 9, 5, 707-728.
Sahak, M., Jawai, D., Halim, S., 2017. An Experiment of
Different Similarity Measures on Test Case Prioritiza-
tion for Software Product Lines. In J. of Telecommuni-
cations, Electronics & Computer Engineering, 9, 3-4,
177-185.
Sanchez, A., Segura, S., Ruiz-Cortes, A., 2014. A Compar-
ison of Test Case Prioritization Criteria for Software
Product Lines. In Int. Conf. on Softw. Testing, Verifica-
tion and Validation,41-50.
Savolainen, J., Mannion, M., Kuusela, J., 2012. In Devel-
oping Platforms for Multiple Software Product Lines,
16th Int’l Software Product Line Conference, 220-228.
Shih, H., 2011. Product Structure (BOM)-based Product
Similarity Measures using Orthogonal Procrustes Ap-
proach. In Computers & Industrial Engineering, 61, 3,
608-628.
Rieck, K., Wressnegger, C., 2016. Harry: A Tool for Meas-
uring String Similarity. In J. of Mach. Learning Re-
search, 17,9,1-5.
Vale, G., Figueiredo, E., 2015. A Method to Derive Metric
Thresholds for Software Product Lines, In 29th Brazil-
ian Symposium on Softw. Engineering, 110-119.
Walsh, G., Mitchell, V-M., Kilian, T., Miller, L., 2010.
Measuring Consumer Vulnerability to Perceived Prod-
uct-Similarity Problems and its Consequences. In J. of
Marketing Management, 26, 1-2, 146-162.
Yazdani, H., Ortiz-Arroyo, D., Kwasnicka, H., 2016. New
Similarity Functions, In 3rd Int’l Conf on Artificial In-
telligence and Pattern Recognition (AIPR), 1-6.
Yuzgec, E., Alazzam, A., Nagarur, N., 2012. A Two-Stage
Algorithm to Design and Assess Product Family. In In-
dustrial and Systems Engineering Research Confer-
ence, 1-9.
Yi, X., Zhou, Y., Zheng, Z., Li, M., 2018. Configuring Soft-
ware Product Lines by Combining Many-Objective Op-
timization and SAT Solvers. In ACM Transactions on
Softw. Eng & Methodology, 26, 4, 1-4.
Zaggi, M., Hagenmaier, M., Raasch, C., 2019. The choice
between uniqueness and conformity in mass customiza-
tion. In R & D Management, 49, 2, 204-221.
ICEIS 2021 - 23rd International Conference on Enterprise Information Systems
266
