
Machine Learning Algorithms for Breast Cancer Detection in
Mammography Images: A Comparative Study
Rhaylander Mendes de Miranda Almeida
1
, Dehua Chen
2
, Agnaldo Lopes da Silva Filho
3
and Wladmir Cardoso Brand
˜
ao
1 a
1
Department of Computer Science, Pontifical Catholic University of Minas Gerais (PUC Minas), Belo Horizonte, Brazil
2
Department of Computer Science, Federal University of Minas Gerais (UFMG), Belo Horizonte, Brazil
3
Faculty of Medicine, Federal University of Minas Gerais (UFMG), Belo Horizonte, Brazil
Keywords:
Deep Learning, Classification, Mammography Screening, Mammogram Abnormalities, Breast Cancer.
Abstract:
Breast tumor is the most common type of cancer in women worldwide, representing approximately 12% of
reported new cases and 6.5% of cancer deaths in 2018. Mammography screening are extremely important for
early detection of breast cancer. The assessment of mammograms is a complex task with significant variability
due to professional experience and human errors, an opportunity for assisting tools to improve both reliability
and accuracy. The usage of deep learning in medical image analysis have increased, assisting specialists in
early detection, diagnosis, treatment or prognosis of diseases. In this article, we compare the performance of
XGBoost and VGG16 in the task of breast cancer detection by using digital mammograms from CBIS-DDSM
dataset. In addition, we perform a comparison of prediction accuracy between full mammogram images
and patches extracted from original images based on ROI annotated by experts. Moreover, we also perform
experiments with transfer learning and data augmentation to exploit data diversity, and the ability to extract
features and learn from raw unprocessed data. Experimental results show that XGBoost achieves 68.29% in
AUC, while VGG16 achieves approximately the same performance of 68.24% in AUC.
1 INTRODUCTION
According to the World Health Organization (WHO)
1
breast cancer is the most common cancer in women
worldwide, causing more than 627 thousand deaths
in 2018. The American Cancer Society estimated
more than 41 thousand deaths and 268 thousand new
cases of female breast cancer in the United States in
2019 (DeSantis et al., 2019). Mammography screen-
ing for early breast cancer detection has been adopted
in many countries, helping in a significant reduction
of deaths due to early diagnosis and treatment. While
the benefits of mammography screening have been
observed in the past years, its harms are also topics
of discussion. For instance, overdiagnosis of breast
cancer is the main harm resulted of mammography
screening, with an estimated occurrence of 31% in the
United States (Løberg et al., 2015).
Overdiagnosis is the diagnosis that would not have
been identified clinically, but that is previously iden-
a
https://orcid.org/0000-0002-1523-1616
1
http://www.who.int
tified (Løberg et al., 2015). Tumor regression, lack of
potential progression or even deaths caused by other
reasons prior to the clinical surface are cases of over-
diagnosis, all situations where the actual treatment
will not have benefit (Løberg et al., 2015). Surgery,
chemotherapy, antiestrogen treatment and radiother-
apy are treatment options for breast cancer, and the
last is known to increase the risk of death from cardio-
vascular disease (Løberg et al., 2015). While the risk
of radiation exposure in a mammogram is small, the
scenario may be different due to repeated X-rays in
follow-up exams and considerably increased in cases
of overtreatment (Darby et al., 2013).
The assessment of screening mammograms is a
complex task which has significant variability due to
many reasons such as professional experience and hu-
man errors. Therefore, it is encouraged the usage
of Computer Aided Diagnosis (CAD) to aid radiol-
ogists in diagnosing cancer to improve reliability and
accuracy (Ribli et al., 2018). Even though the qual-
ity of digital mammograms is higher when compared
to the conventional film version, interpretation is still
an issue as observer error is frequent in breast can-
660
Almeida, R., Chen, D., Filho, A. and Brandão, W.
Machine Learning Algorithms for Breast Cancer Detection in Mammography Images: A Comparative Study.
DOI: 10.5220/0010440906600667
In Proceedings of the 23rd International Conference on Enterprise Information Systems (ICEIS 2021) - Volume 1, pages 660-667
ISBN: 978-989-758-509-8
Copyright
c
2021 by SCITEPRESS – Science and Technology Publications, Lda. All rights reserved

cer screening, leading to misinterpretations of abnor-
malities or even lack of identification (Vadivel and
Surendiran, 2013). Abnormalities found in a mam-
mogram are broadly categorized as masses and cal-
cification, which have several distinguishing charac-
teristics used to classify a mammogram as benign or
malignant (Vadivel and Surendiran, 2013). Due to
the high correlation between breast cancer and the ap-
pearance of abnormalities, along with the difficulty in
distinguishing some characteristics such as shape and
margin, the use of CAD to help radiologists in ab-
normality classification represents an opportunity to
reduce misdiagnosis (Vadivel and Surendiran, 2013).
The use of Machine Learning (ML) have in-
creased in several research areas due to the increase of
the computing power required to train effective mod-
els, and the increase in the availability and capacity
of processing big amounts of data in the learning pro-
cess (Shen et al., 2017). The ability of learning from
raw and unlabeled data and the capacity of address-
ing complex problems and data structures are also
key factors to the increase on usage of ML (Baka-
tor and Radosav, 2018). Remarkable results have
been achieved by Deep Learning (DL) models in
medical image analysis to support specialists in early
detection, diagnosis, treatment or prognosis of dis-
eases (Shen et al., 2017), which is expected to in-
crease the overall quality of healthcare (Bakator and
Radosav, 2018). The accuracy and reliability of mam-
mography assessment vary with the level of exper-
tise of each specialist and a high variability has been
observed in previous studies (Sprague et al., 2016).
Hence, this represents an opportunity for the applica-
tion of CAD for mammography assessment to achieve
reliable and accurate solutions based on DL models.
In this article, we compare the performance of
XGBoost, a classic tree-based ML algorithm and
VGG16, a Convolutional Neural Network (CNN), in
the task of breast cancer detection using the Curated
Breast Imaging Subset of DDSM (CBIS-DDSM)
dataset composed of full mammogram images and
abnormality-focused patches extracted from original
images properly labeled by a trained mammogra-
pher (Lee et al., 2017). In particular, XGBoost is
a scalable gradient boosting library designed to han-
dle big amounts of data while consuming fewer re-
sources (Chen and Guestrin, 2016), while VGG16 is
one of the famous CNN architectures proposed during
the 2014 ImageNet (Simonyan and Zisserman, 2014;
Russakovsky et al., 2015). We also compare the abil-
ity of the algorithms to extract features and learn from
raw data.
The remainder of this article is organized as fol-
lows. In Section 2, we present a literature review. In
Section 3 we present relevant related work reported in
literature. Section 4 describes our proposed approach
to perform breast cancer detection, comparing ML al-
gorithms. In Section 5 we present the experimental
setup. Section 6 presents the experimental results. Fi-
nally, in Section 7 we present the conclusion and di-
rections for future work.
2 BACKGROUND
Machine Learning systems are able to learn from
past experiences to make decisions with no need of
explicit instructions. The learning process is based
on inductive reasoning, in which generic conclusions
are reached based on a dataset (Russell and Norvig,
2009). ML models are created based on datasets
with examples from the problem domain. However,
datasets often present imperfections, such as incon-
sistency, redundancy, missing and noisy data. Hence,
ML algorithms must be robust to minimize the impact
of data imperfections. Data preprocessing is usually
required to reduce this impact and improve general-
ization.
Particularly, the goal is to find a ML model with
good generalization, being capable of accurately pre-
dict not only the training data but also unknown data
from the problem domain. Bad generalization might
be a result of overfitting, when a model performs well
on the training data but has poor generalization on
new data items, or underfitting, when a model does
not perform well on the training data and has poor
generalization on new data items (Russell and Norvig,
2009).
There are different ML algorithms reported in the
literature. Decision trees use the divide and conquer
strategy to solve complex problems by recursively
splitting them into smaller ones. The data space is
split on each recursive interaction based on feature
values. Branches are created every time the data space
is split and a decision rule is defined to describe a por-
tion of the data space. A tree model is either defined
as classification tree if the target variable is a finite set
of values, or as regression tree if the target variable
can take continuous values.
Boosting algorithms combine weak learners into
an ensemble, resulting in a strong learner. A weak
learner is a classifier slightly better than a random
pick, and a strong learner is a well-correlated ar-
bitrary classifier with lower error rate. The main
idea is to interactively associate a hypothesis and a
weight to each example of the training set so that
the classification may focus on different examples
leading to different classifiers. On each interaction
Machine Learning Algorithms for Breast Cancer Detection in Mammography Images: A Comparative Study
661

the weights are adjusted and a weak classifier is in-
corporated. The ensemble output is the result of a
weighted vote of all classifiers. Gradient boosting is
commonly used with decision trees and has proven
to be effective and widely used on many ML chal-
lenges (Chen and Guestrin, 2016). Extreme Gradi-
ent Boosting (XGBoost) is a scalable gradient boost-
ing library designed to handle billions of examples
by providing a parallel tree boosting that consume
fewer resources, while achieving state-of-the-art per-
formance (Chen and Guestrin, 2016).
An Artificial Neural Network (ANN) is a dis-
tributed system composed of simple processing units
connected together, which have the ability to learn
from the environment and preserve experimental
knowledge (Russell and Norvig, 2009). The devel-
opment of ANNs is inspired by the human’s nervous
system and aimed the creation of models with simi-
lar learning capabilities of the human brain to acquire
knowledge. High generalization, fault tolerant, ro-
bustness to deal with noisy raw data are reasons for
ANNs popularity. However, the decisions taken by
their complex mathematical (black box) models are
usually difficult to understand. Thus “white box” sys-
tems are generally preferred by industries, since their
results are easily interpretable by humans (Loyola-
Gonz
´
alez, 2019).
Deep Learning (DL) is used to describe ANNs
with complex multilayers architecture (Liu et al.,
2017; Abiodun et al., 2018). By simulating how
key sensory areas of the human brain work (Pouyan-
far et al., 2018), DL models can represent complex
structures and are able to automatically perform fea-
ture extraction (Abiodun et al., 2018). They require
large datasets for training to effectively prevent over-
fitting (Liu et al., 2017). Particularly, remarkable re-
sults have been achieved by DN in the medical field to
support specialists in early detection, diagnosis, treat-
ment and prognosis of diseases (Shen et al., 2017).
The ability of learning from unlabeled raw data to au-
tomatically identify abstractions brings a lot of value
in the medical field (Bakator and Radosav, 2018).
Tissue segmentation, structure detection, computer-
aided disease diagnosis and prognosis are specific
uses of DL in the medical field (Shen et al., 2017;
Bakator and Radosav, 2018).
Convolutional Neural Network (CNN) is a popu-
lar DL architecture extensively used in computer vi-
sion, audio and speech processing, and natural lan-
guage processing (Pouyanfar et al., 2018; Abiodun
et al., 2018). Recently, an effective CNN model
called VGG16, achieves high accuracy on image clas-
sification (Simonyan and Zisserman, 2014). In par-
ticular, VGG16 is a VGGNet with 16 layers that
uses smaller (3x3) convolution filters stacked together
producing deeper networks with the same effective
receptive field and capable of handling more non-
linearities, and fewer parameters (Simonyan and Zis-
serman, 2014).
3 RELATED WORK
DL models have been extensively used in medi-
cal image analysis achieving remarkable results(Shen
et al., 2017; Bakator and Radosav, 2018). A CNN
model performs breast density classification based on
the four BI-RADS classes, using a dataset of over
200,000 screening mammography exams(Wu et al.,
2018). Particularly, it uses pixel intensity as a base-
line, since fibroglandular tissue absorbs much of the
radiation, which make them appear brighter than adi-
pose tissue. The authors report accuracy similar to hu-
man experts. In the same vein, a similar CNN-based
classifier based on AlexNet model can consistently
distinguish between the difficult classes “scattered ar-
eas of fibroglandular density” and “heterogeneously
dense” (Mohamed et al., 2018).
A challenging problem in DL for medical image
analysis is the access to large datasets with reliable
annotations from domain experts (Tan et al., 2018).
Transfer learning can mitigate this problem by train-
ing a model in a source domain with high quality
data, later using the learned model to perform pre-
dictions in a target domain(Tan et al., 2018; Perre
et al., 2019). In the context of lesion classification
in mammograms, transfer learning was already been
effectively used to overcome the problem of missing
datasets (Perre et al., 2019).
Experiments reported from the Digital Mammog-
raphy DREAM Challenge (DM Challenge) to diag-
nosis breast cancer using a dataset with 86,000 exams
show that an ensemble of two CNN models (R-CNN
and VGG16) can effectively detect breast cancer in
mammography (Ribli et al., 2018). Additionally,
other different DL architectures present outstanding
performance for the same task (Li et al., 2019). More-
over, random trees and random forest have also been
used to classify mammograms and the authors re-
ported 90% of accuracy (Vibha et al., 2006).
4 METHODOLOGY
As mentioned in the Section 2, DL can represent com-
plex models, automatically performing feature extrac-
tion learning from raw data (Abiodun et al., 2018;
ICEIS 2021 - 23rd International Conference on Enterprise Information Systems
662
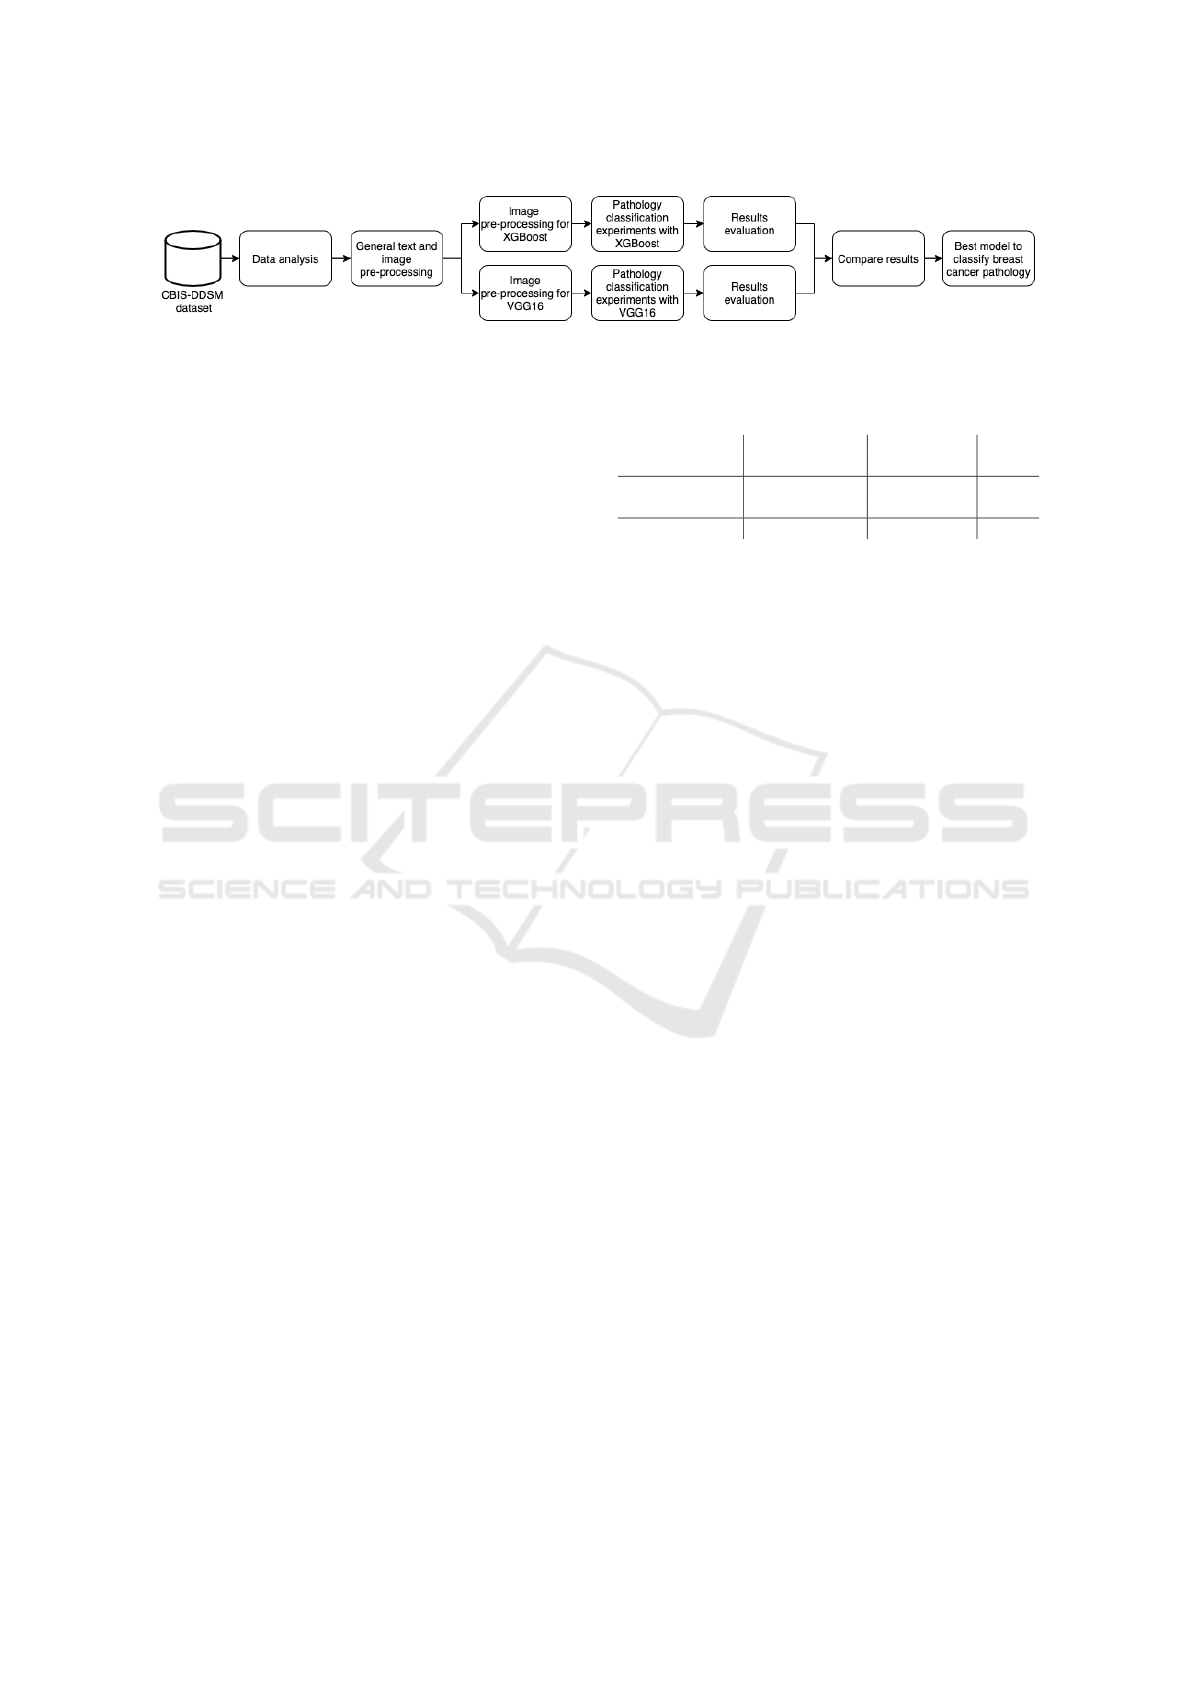
Figure 1: The methodology used to compare different algorithms for breast cancer detection.
Pouyanfar et al., 2018). In this article, we compare
the performance of the traditional XGBoost algorithm
and the classic VGG16 DL network for breast cancer
pathology classification on raw mammogram images
available in the CBIS-DDSM dataset.
Figure 1 presents each step of the comparison
methodology. First, we perform an analysis of the
dataset to understand available data and how it can
be used for breast cancer detection. Second, general
pre-processing steps are performed to fix and enhance
text metadata available in the dataset and extract raw
image data from DICOM files, creating intermediate
datasets. Third, different experiments are carried out
using both XGBoost and VGG16 to perform pathol-
ogy classification in mammograms. Particularly, each
ML algorithm requires specific image pre-processing
steps to adjust the dataset to the expected input for-
mat and to perform data augmentation. Fourth, exper-
imental results are collected and compared based on
research questions made on each experiment. Finally,
the most effective model of each ML algorithm are
evaluated and compared. The AUC metric and confu-
sion matrix are used to compare the results obtained
by the classification models.
5 EXPERIMENTAL SETUP
5.1 Dataset
The Curated Breast Imaging Subset of DDSM (CBIS-
DDSM) dataset is composed of decompressed DI-
COM images selected and curated by specialists (Lee
et al., 2017). It contains 10,239 images of 6,775 cases
from 1,566 patients, 753 of them calcification cases,
and other 891 mass cases. Table 1 presents the num-
ber of images tagged as benign or malignant in CBIS-
DDSM by category.
Each patch extracted from mammograms has an
equivalent ROI segmentation filter. The 3,568 ROI fil-
ters are not relevant to this work, so from the original
10,239 images we removed 3,568, considering only
6,671 images. There is no standard resolution across
all images in the dataset. Usually mammograms have
resolutions higher than 3000x4000 pixels, and the res-
Table 1: Number of images by category in CBIS-DDSM
dataset.
Train Test
Category Ben. Mal. Ben. Mal. Total
Mammograms 1,354 1,104 385 260 3,103
ROI patches 1,683 1,181 428 276 3,568
Total 3,037 2,285 813 536 6,671
olution of ROI patch images presents high variability,
ranging from 100x100 up to 2000x2000 pixels.
Each case contains the original decompressed im-
ages of Medio-Lateral Oblique (MLO) and Cranial-
Caudal (CC) views of mammograms from both
breasts, a ROI segmentation filter, patches contain-
ing ROI for each abnormally found on each mammo-
gram image, and metadata information about the pa-
tient (Lee et al., 2017). The available information on
patient are: Breast Imaging Reporting and Data Sys-
tem (BI-RADS) classification for mass shape, mass
margin, calcification type, calcification distribution,
and breast density, overall BI-RADS assessment from
0 to 5, rating of the subtlety of the abnormality from 1
to 5, age, date of the study, date of digitization, dense
tissue category, scanner used to digitize, resolution of
each image, and pathology (Lee et al., 2017). Fig-
ure 2 shows different examples of images available in
the dataset, CC, MLO, and ROI patch images from
both benign and malignant abnormalities are visible
for calcifications (a) and masses (b).
5.2 Data Pre-processing
5.2.1 Metadata Files
As mentioned in the Section 5.1, the dataset not only
has DICOM images but also metadata files. In par-
ticular, there are three columns used to map the path
to patients’ original decompressed images, ROI seg-
mentation filter and bounding boxes of all abnormali-
ties found on each original image. However, the paths
were all broken as the inner folder names were all
incorrect. Once this scenario was identified as part
of the dataset analysis, the first pre-processing effort
was to fix all paths and create two additional types
of metadata files after separating original mammo-
grams and patch images. The latter was required as
Machine Learning Algorithms for Breast Cancer Detection in Mammography Images: A Comparative Study
663
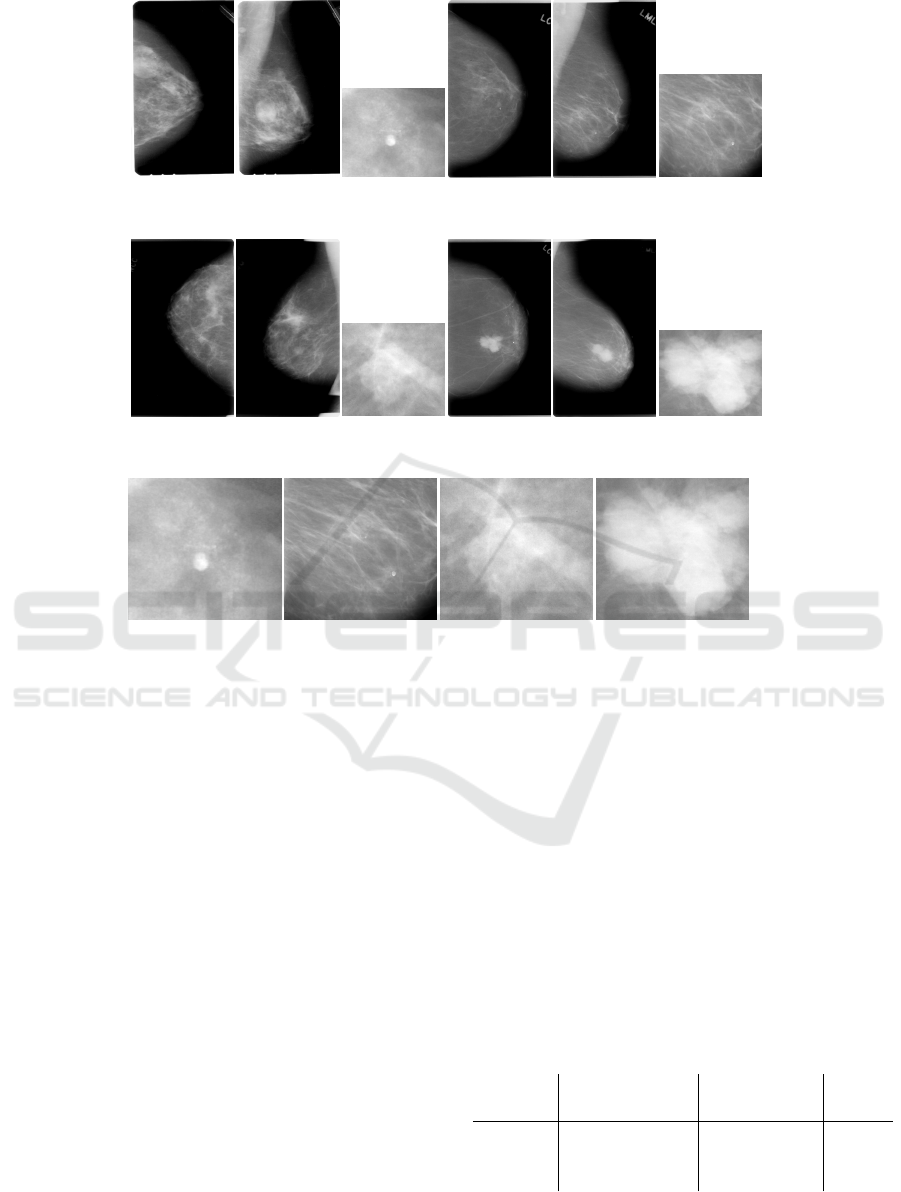
(I) CC (II) MLO
(III) ROI patch
(IV) CC
(V) MLO
(VI) ROI patch
(a) Examples of benign (I, II, and III) and malignant (IV, V, and VI) calcifications, they belong to a single breast of two
randomly picked patients.
(I) CC (II) MLO
(III) ROI patch
(IV) CC
(V) MLO
(VI) ROI patch
(b) Examples of benign (I, II, and III) and malignant (IV, V, and VI) masses, they belong to a single breast of two randomly
picked patients.
(I) Benign
(II) Malignant
(III) Benign
(IV) Malignant
(c) Examples of benign and malignant abnormalities, calcifications (I, II) and masses (III, IV).
Figure 2: Example of images from CBIS-DDSM dataset.
each metadata file would have duplicated instances in
case a mammogram would have multiple abnormali-
ties. This approach made it easier to perform further
experiments based on image types. Manual human
verification was required in order to ensure all image
paths were correct, a script to create thumbnails was
created to facilitate this effort.
5.2.2 Images
All experiments have been performed using raw im-
ages. Data augmentation techniques were used to in-
crease the data diversity of the dataset for training
and as a mechanism to help dealing with overfitting.
Images were generated during execution time, and
the number of images is the same as the number of
original images in the dataset. The random transfor-
mations performed as part of data augmentation are
random horizontal flips, rotation around the center,
shear transformation, vertical and horizontal shifts,
and zoom in and out. Lastly, images are resized to
224x224 pixels to comply with VGG16’s input and to
reduce data dimensionality.
Since all images from the dataset are in the DICOM
format, the pixel data information is extracted and
stored as TIFF format. During this step three datasets
are created, one containing only original mammo-
grams, another for abnormality patches and the last
one containing both image types, respectively called
dataset A, B and C, as presented in Table 2. These
datasets are used individually to evaluate and com-
pare how models perform when using raw original
images versus focused abnormality patches extracted
from original images, and to evaluate if mixing them
would bring any benefits.
Table 2: Datasets created after grouping images by cate-
gory.
Train Test
Dataset Ben. Mal. Ben. Mal. Total
A 1,354 1,104 385 260 3,103
B 1,683 1,181 428 276 3,568
C 3,037 2,285 813 536 6,671
ICEIS 2021 - 23rd International Conference on Enterprise Information Systems
664

5.3 Training and Validation
As mentioned in Section 5.2.2, we use data augmen-
tation to perform random transformations on images
during the training phase to not only increase data
diversity, but also to reduce overfitting. The images
used for validation are not transformed, except for
resizing all of them to keep the same dimensions.
Knowledge transfer and fine-tuning have been used
for both XGBoost and VGG16 models. Addition-
ally, the three datasets mentioned in Table 2 have
been used individually and also combined for trans-
fer learning as described in Section 6. We use AUC
to measure model’s performance for classifying pa-
tient’s pathology. We also present Confusion Matrix
to improve understanding in which class the models
performs better (or worst).
For XGBoost, we use 5-fold cross-validation for
tuning and Grid Search to find hyperparameters, in
particular learning rate = 0.2, gamma = 1.5, max
tree depth = 5, min child weight = 3 and subsam-
ple = 0.8. In addition, to avoid overfitting we set
epoch limit to 30. For VGG16, we use the last fully
softmax connected layer to properly classify outputs
in two classes. In addition, knowledge transfer has
been used by loading weights from ImageNet VGG16
ILSVRC2014 (Russakovsky et al., 2015) to under-
stand if the learned knowledge is useful for breast
pathology classification. For fine-tuning, we test
three different models: load weights from ImageNet
VGG16 ILSVRC2014 while locking convolutional
layers, training only the last max pooling and fully
connected layers; use the previous models as a start-
ing point, but unlocking convolutional layers; train
the entire network from scratch. For all the models
the training upper limit of epochs was set to 100 and
an early stopping callback was leveraged to stop the
execution in case there was no improvement in AUC
metric during the course of 30 consecutive epochs.
An stochastic gradient descent (SGD) optimizer was
used with learning rate = 1e-4 and momentum = 0.9.
6 EXPERIMENTAL RESULTS
In this section, we present the experiments we car-
ried out to evaluate the performance of XGBoost and
VGG16 in the task of breast cancer detection using
mammograms. As mentioned in the Section 5.1, since
the CBIS-DDSM dataset has full mammogram im-
ages and abnormality-focused patches extracted from
the original images, three other datasets were cre-
ated during pre-processing as an effort to have control
over an image type used as input and to compare how
would the models perform against each type. Particu-
larly, we perform experiments to answer the following
research questions:
• Experiment 1. Is the knowledge extracted from
a XGBoost model trained on abnormality patches
useful to predict pathology of full mammogram
images?
• Experiment 2. Is the knowledge extracted from a
XGBoost model trained on full mammogram im-
ages useful to predict pathology of abnormality
patches?
• Experiment 3. Which type of image would pro-
vide better features for pathology classification?
• Experiment 4. What is the XGBoost per-
formance when trained on dataset B? What if
we transfer knowledge and continue training in
dataset A?
• Experiment 5. Is knowledge transfer with no
fine-tuning useful for VGG16?
• Experiment 6. What is the VGG16 performance
when trained from scratch with no knowledge
transfer?
• Experiment 7. Is knowledge transfer with fine-
tuning useful for VGG16?
• Experiment 8. What is the VGG16 performance
when trained on dataset B? What if we transfer
knowledge and continue training in dataset A?
Table 3 presents the experimental results for all the
previous research questions. From Table 3 we observe
that train XGBoost model on abnormality patches to
predict pathology of full mammogram images (Ex-
periment 1) is better than train XGBoost model on
full mammogram images to predict pathology of ab-
normality patches (Experiment 2). Additionally, we
observe that transfer learning provide negligible gains
for XGBoost, since the AUC metric of 0.6829 in the
Experiment 3 with dataset A (no transfer learning) is
almost the same as AUC metric of 0.6849 in the Ex-
periment 4 (with transfer learning). Moreover, we ob-
serve that abnormality-focused patch images impact
negatively in XGBoost performance as the AUC score
for Experiment 3 dataset B was 19.14% less accurate
than dataset A, and 10.10% less accurate than dataset
C. However, Experiment 4 shows that abnormality-
focused images can be effectively used for transfer
learning, since the knowledge learned by the pre-
trained model that use these images (Experiment 3
dataset B) provides outperforming results when trans-
ferred to train dataset A.
Similarly to XGBoost, for VGG16 we observe
that abnormality-focused patch images impact nega-
Machine Learning Algorithms for Breast Cancer Detection in Mammography Images: A Comparative Study
665

Table 3: Experimental results for XGBoost and VGG16.
Algorithm Experiment Dataset AUC Precision Recall F1-Score
XGBoost
1 - 0.5694 0.5260 0.5541 0.4755
2 - 0.4207 0.5050 0.5308 0.3303
3
A 0.6829 0.6411 0.6409 0.6410
B 0.5522 0.5471 0.5516 0.5461
C 0.6139 0.5780 0.5852 0.5780
4 - 0.6849 0.6219 0.6243 0.6228
VGG16
5
A 0.6527 0.6022 0.5988 0.5905
B 0.6151 0.5138 0.5833 0.4287
C 0.6279 0.5472 0.5542 0.5442
6 A 0.6233 0.5843 0.5838 0.5841
7
A 0.6822 0.6405 0.6406 0.6405
B 0.6207 0.5082 0.5679 0.4133
C 0.6331 0.5598 0.5804 0.5506
8 - 0.6527 0.6026 0.6014 0.5828
tively in performance, since the AUC score for Exper-
iment 5 dataset B is 5.77% smaller than dataset A, and
2.04% smaller than dataset C. Additionally, Experi-
ment 6 show that training network from scratch pro-
vide downgraded results, particularly a drop of 4.50%
in AUC score when compared to the best result from
Experiment 5. Moreover, Experiment 7 shows that
transfer learning with fine-tuning impacts positively
VGG16 models, particularly for dataset A, with an
increase in AUC score of 4.52%. Finally, Experiment
8 shows that, differently from XGBoost, abnormality-
focused images can not be effectively used for trans-
fer learning, since the knowledge learned by the pre-
trained model that use these images (Experiment 5
dataset B) provides inferior results when transferred
to train dataset A (0.6527 of AUC in Experiment 8
compared to 0.6822 of AUC in Experiment 7).
In summary, both XGBoost and VGG16 performs
better when trained with original full mammogram
images, but XGBoost slightly outperforms VGG16
for classification of malignant tumors. For XGBoost,
abnormality-focused images can be effectively used
for transfer learning, but not for VGG16. Also,
transfer learning with fine-tuning impacts positively
VGG16, but provides negligible gains for XGBoost.
Precision, recall, and F1-Score measures follow the
same behavior than AUC metrics. Both XGBoost
and VGG16 can effectively discriminate instances be-
longing to the benign class, but there is still room for
improvement for malignant tumors classification.
7 CONCLUSION
In this article we compared the performance of XG-
Boost and VGG16 for breast cancer detection. Exper-
iments with CBIS-DDSM dataset show that they per-
formed similarly, achieving AUC scores of approxi-
mately 0.68. In addition, experimental results show
that patch images did not contribute to performance.
Moreover, XGBoost were able to identify more ma-
lignant samples than VGG16, finding a better balance
between both classes.
A limitation of this work is the amount of cases
in the CBIS-DDSM dataset. A larger well-annotated
dataset would contribute to deeply train a CNN and
further explore their ability to extract features from
raw data. For future work, we intent to: i) per-
form experiments with other mammography screen-
ing datasets that can either be used individually or
combined to increase the number of available cases;
ii) perform image normalization and feature extrac-
tion to assist ML algorithms, since mammograms
have noisy, and possibly annotations not relevant to
the problem; iii) combine image datasets with tex-
tual image metadata and demographic information
from patients; iv) use ensembles that can handle
high-resolution images; v) perform experiments with
datasets containing patients historical information to
perform analysis of abnormalities growth over time.
ACKNOWLEDGEMENTS
The present work was carried out with the support
of the Coordenac¸
˜
ao de Aperfeic¸oamento de Pessoal
de N
´
ıvel Superior - Brazil (CAPES) - Financing
Code 001. The authors thank the partial support of
the CNPq (Brazilian National Council for Scientific
and Technological Development), FAPEMIG (Foun-
dation for Research and Scientific and Technological
Development of Minas Gerais) and PUC Minas.
ICEIS 2021 - 23rd International Conference on Enterprise Information Systems
666

REFERENCES
Abiodun, O. I., Jantan, A., Omolara, A. E., Dada, K. V.,
Mohamed, N. A., and Arshad, H. (2018). State-of-the-
art in artificial neural network applications: A survey.
Heliyon, 4(11):e00938.
Bakator, M. and Radosav, D. (2018). Deep learning and
medical diagnosis: A review of literature. Multimodal
Technologies and Interaction, 2(3).
Chen, T. and Guestrin, C. (2016). XGBoost: A scalable
tree boosting system. In Proceedings of the 22nd
ACM SIGKDD International Conference on Knowl-
edge Discovery and Data Mining, KDD’16, page
785–794.
Darby, S. C., Ewertz, M., McGale, P., Bennet, A. M., Blom-
Goldman, U., Brønnum, D., Correa, C., Cutter, D.,
Gagliardi, G., Gigante, B., Jensen, M.-B., Nisbet, A.,
Peto, R., Rahimi, K., Taylor, C., and Hall, P. (2013).
Risk of ischemic heart disease in women after radio-
therapy for breast cancer. New England Journal of
Medicine, 368(11):987–998.
DeSantis, C. E., Ma, J., Gaudet, M. M., Newman, L. A.,
Miller, K. D., Goding Sauer, A., Jemal, A., and Siegel,
R. L. (2019). Breast cancer statistics. CA: A Cancer
Journal for Clinicians, 69(6):438–451.
Lee, R., Gimenez, F., Hoogi, A., Miyake, K., Gorovoy, M.,
and Rubin, D. (2017). A curated mammography data
set for use in computer-aided detection and diagnosis
research. Scientific Data, 4:170177.
Li, H., Zhuang, S., ao Li, D., Zhao, J., and Ma, Y. (2019).
Benign and malignant classification of mammogram
images based on deep learning. Biomedical Signal
Processing and Control, 51:347–354.
Liu, W., Wang, Z., Liu, X., Zeng, N., Liu, Y., and Alsaadi,
F. E. (2017). A survey of deep neural network ar-
chitectures and their applications. Neurocomputing,
234:11–26.
Løberg, M., Lousdal, M. L., Bretthauer, M., and Kalager,
M. (2015). Benefits and harms of mammography
screening. Breast Cancer Research, 17(1):63.
Loyola-Gonz
´
alez, O. (2019). Black-box vs. white-box:
Understanding their advantages and weaknesses from
a practical point of view. IEEE Access, 7:154096–
154113.
Mohamed, A. A., Berg, W. A., Peng, H., Luo, Y., Jankowitz,
R. C., and Wu, S. (2018). A deep learning method for
classifying mammographic breast density categories.
Medical Physics, 45(1):314–321.
Perre, A. C., Alexandre, L. A., and Freire, L. C. (2019).
Lesion classification in mammograms using convolu-
tional neural networks and transfer learning. Com-
puter Methods in Biomechanics and Biomedical En-
gineering: Imaging & Visualization, 7(5-6):550–556.
Pouyanfar, S., Sadiq, S., Yan, Y., Tian, H., Tao, Y., Reyes,
M. P., Shyu, M.-L., Chen, S.-C., and Iyengar, S. S.
(2018). A survey on deep learning: Algorithms, tech-
niques, and applications. ACM Computing Surveys,
51(5):92:1–92:36.
Ribli, D., Horv
´
ath, A., Unger, Z., Pollner, P., and Csabai,
I. (2018). Detecting and classifying lesions in mam-
mograms with deep learning. Scientific Reports,
8(1):4165.
Russakovsky, O., Deng, J., Su, H., Krause, J., Satheesh, S.,
Ma, S., Huang, Z., Karpathy, A., Khosla, A., Bern-
stein, M., Berg, A. C., and Fei-Fei, L. (2015). Ima-
geNet Large Scale Visual Recognition Challenge. In
Proceedings of the International Journal of Computer
Vision, IJCV’15, pages 211–252.
Russell, S. and Norvig, P. (2009). Artificial Intelligence: A
Modern Approach. Prentice Hall Press, Upper Saddle
River, NJ, USA, 3rd edition.
Shen, D., Wu, G., and Suk, H.-I. (2017). Deep learning in
medical image analysis. Annual Review of Biomedical
Engineering, 19:221–248.
Simonyan, K. and Zisserman, A. (2014). Very deep con-
volutional networks for large-scale image recognition.
CoRR, abs/1409.1556.
Sprague, B. L., Conant, E. F., Onega, T., Garcia, M. P., Be-
aber, E. F., Herschorn, S. D., Lehman, C. D., Toste-
son, A. N. A., Lacson, R., Schnall, M. D., Kontos, D.,
Haas, J. S., Weaver, D. L., Barlow, W. E., and Consor-
tium, P. R. O. S. P. R. (2016). Variation in mammo-
graphic breast density assessments among radiologists
in clinical practice: A multicenter observational study.
Annals of Internal Medicine, 165(7):457–464.
Tan, C., Sun, F., Kong, T., Zhang, W., Yang, C., and
Liu, C. (2018). A survey on deep transfer learning.
In K
˚
urkov
´
a, V., Manolopoulos, Y., Hammer, B., Il-
iadis, L., and Maglogiannis, I., editors, Proceedings of
the 27th International Conference on Artificial Neural
Networks and Machine Learning, ICANN’18, pages
270–279.
Vadivel, A. and Surendiran, B. (2013). A fuzzy rule-based
approach for characterization of mammogram masses
into BI-RADS shape categories. Computers in Biol-
ogy and Medicine, 43(4):259 – 267.
Vibha, L., Harshavardhan, G. M., Pranaw, K., Shenoy,
P. D., Venugopal, K. R., and Patnaik, L. M. (2006).
Classification of mammograms using decision trees.
In Proceedings of the 10th International Database En-
gineering and Applications Symposium, IDEAS’06,
pages 263–266.
Wu, N., Geras, K. J., Shen, Y., Su, J., Kim, S. G., Kim,
E., Wolfson, S., Moy, L., and Cho, K. (2018). Breast
density classification with deep convolutional neural
networks. In Proceedings of the IEEE International
Conference on Acoustics, Speech and Signal Process-
ing, ICASSP’18, pages 6682–6686.
Machine Learning Algorithms for Breast Cancer Detection in Mammography Images: A Comparative Study
667
