
A Journey to Salamis Island (Greece) using a GIS Tailored
Interactive Story Map Application
Varvara Antoniou
1a
, Paraskevi Nomikou
1b
, Konstantinos Papaspyropoulos
1c
,
Odysseas Karatzaferis
1d
, Othonas Vlasopoulos
1e
, Christos Stentoumis
2f
and
Ilias Kalisperakis
2g
1
National and Kapodistrian University of Athens, Department of Geology and Geoenvironment,
Panepistimioupoli Zografou, 15784 Athens, Greece
2
up2metric P.C., Computer Vision Engineering, Michail Mela 21, GR-11521, Athens, Greece
Keywords: GIS Story Maps, 3D Model, Web Application, Structure from Motion, Multipart Features.
Abstract: Web GIS applications have been used to communicate and showcase spatial information to the general public.
In the demonstrated Web GIS application, the aim was to highlight the importance of a historic area, Salamis
island (Greece), through its natural and anthropogenic environment using narrative text, multimedia, and web
content as well as geospatial data and 3D visualization. Using StoryMaps, a widespread geographical
visualization approach, used for science and spatial data communication, information, education, and
dissemination, new functions combining many scientific fields were integrated, producing an interactive
responsive web app in such a way that scientific knowledge can be received and comprehended by a broader
audience.
1 INTRODUCTION
Geographic Information Systems (GIS) technologies
can provide new opportunities for immersive content
while widely engaging public audiences with
complex multivariate datasets. One of their latest
accomplishments is story maps which can provide
support for scientific storytelling compellingly and
straightforwardly (Antoniou, et al., 2019a) using
multi-media content and narrative text for visualizing
spatial data effectively. Thereby, Story Maps can be
used to disseminate and understand scientific findings
to broader non-technical audiences (Janicki et al.,
2016; Wright et al., 2014).
In this paper, an effort has been made to present
history (archaeological sites, monuments),
biodiversity (unique flora and fauna), geodiversity
(geomorphology, geological formations, sea-level
a
https://orcid.org/0000-0002-5099-0351
b
https://orcid.org/0000-0001-8842-9730
c
https://orcid.org/0000-0002-6432-2602
d
https://orcid.org/0000-0003-2538-9094
e
https://orcid.org/0000-0002-6713-9141
f
https://orcid.org/0000-0001-9972-1761
g
https://orcid.org/0000-0002-3328-093X
changes, land cover), and cultural and recreation
areas for Salamis Island (Greece) through a narrative
interactive story map.
2 STUDY AREA
Salamis island is the largest island of the north
Saronic gulf and is located close to the Attica
coastline. Having a coastline that reaches 100 km in
length, it features tens of bays, peninsulas, capes,
bays, beaches, and small islands (Fig. 1).
The island of Salamis consists of low elevation
hills and small valleys in an approximately east-west
direction. Salamis has been delimited by sea-level
changes, forming an island or a land connected with
the Attica peninsula.
Antoniou, V., Nomikou, P., Papaspyropoulos, K., Karatzaferis, O., Vlasopoulos, O., Stentoumis, C. and Kalisperakis, I.
A Journey to Salamis Island (Greece) using a GIS Tailored Interactive Story Map Application.
DOI: 10.5220/0010440701870194
In Proceedings of the 7th International Conference on Geographical Information Systems Theory, Applications and Management (GISTAM 2021), pages 187-194
ISBN: 978-989-758-503-6
Copyright
c
2021 by SCITEPRESS – Science and Technology Publications, Lda. All rights reserved
187
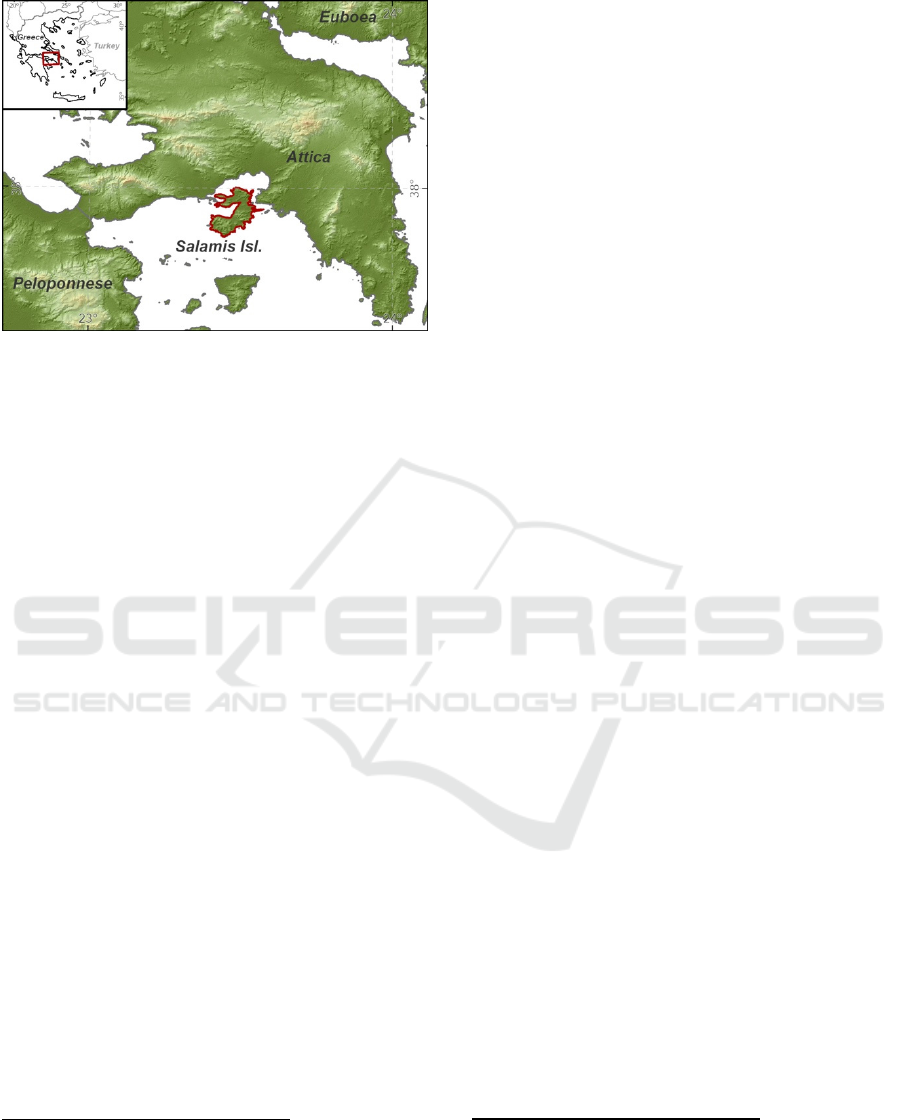
Figure 1: Geographic location of Salamis Island.
During the Pleistocene period, the straits that
separate Salamis Island and Attica, were sometimes
navigable while at other times one could cross them
on foot. Alpine and post alpine geological formations,
consisting mainly of carbonate rocks, ophiolites, and
alluvium respectively, form the geological structure
of Salamis. Fault zones have formed the characteristic
shape of the island. Salamis is an island that has been
inhabited non-stop, since the Mycenaean Era. Its
name is associated with the naval battle of Salamis in
480 BC, between the Persian fleet and the city-states
of the Greeks. It is an island filled with historical
monuments, many of which have had different uses
over the centuries.
3 METHODOLOGY
To meet the challenge of creating the Story Map of
Salamis Journey, which focuses on presenting the
natural as well as the anthropogenic environment of
the island in combination with its historical value,
different types of datasets have been compiled, either
new ones or from open-source portals. New ones
were collected during multiple data collection field
trips, aiming to capture geolocated photos and videos
for each site of interest to enrich the existing geo-
cultural knowledge.
Salamis Journey has been created using the
ArcGIS platform (Esri), although other software (free
1
https://storymap.knightlab.com
2
https://www.google.com/earth/outreach/
3
http://timemapper.okfnlabs.org/
4
https://cartodb.github.io/odyssey.js/
5
https://www.thinglink.com/
or commercial) is also available (e.g., StoryMapJ
1
,
Google Earth Outreach
2
, TimeMapper
3
, Odyssey by
CARTODB
4
, thinglink
5
). After sorting out the
outdated software, the selection was based firstly on
the fact that all available data could be processed in
the chosen platform. Additionally, all the necessary
tools and apps exist in this platform without the need
to use different software to achieve the same result
and without the need for programming. Lastly, the
research team has previous related experience with
this platform (e.g., Antoniou et al., 2018a, 2018b,
2019a, 2019b, 2020a).
Thus, all the available vector and grid spatial data,
along with descriptive ones, were first collected,
homogenized, and organized into a geodatabase via
ArcGIS Pro
6
v.2.6 software. Moreover, the
geodatabase also contained the necessary feature
layers to be used during fieldwork. ArcGIS
Collector
7
, an application available in web and mobile
version (for Android and iOS devices, tablets, or
smartphones) through the ArcGIS platform was used
to ensure the accuracy of the geographic location of
the sites of interest and to collect and update real-
time, spatial and descriptive data. Using a webmap,
created and shared via ArcGIS Pro, which contained
the feature classes devoted to data collection, points
that correspond to sites of interest were collected
using the map or the GPS signal, while descriptive
text and photos or videos completed the fields
available in the attribute table of the corresponding
layer as attachments. After sharing all available
information layers to ArcGIS Online
8
, 2D and 3D
webmaps (scenes) were created.
Furthermore, to enhance the interactivity of the
story map, a 3D representation of specific sites of
cultural interest was implemented. Firstly, a 3D
representation of the two museums operating on the
island was created. The building footprints were
converted to multipatch features and then extruded to
the buildings’ actual height. The features’ vertices
were then edited to more accurately and realistically
visualize their architectural features. Finally, facade
and rooftop textures were added to the buildings,
using photos obtained from the field trips. Due to
some building sides being partly blocked by other
structures, photos of other facades were used to
imitate their actual texture. The photos were edited,
cropped, and rectified to be sharp and best fit each
6
https://www.esri.com/en-us/arcgis/products/arcgis-
pro/overview
7
https://www.esri.com/en-us/arcgis/products/arcgis-
collector/overview
8
https://www.esri.com/en-us/arcgis/products/arcgis-
online/overview
GISTAM 2021 - 7th International Conference on Geographical Information Systems Theory, Applications and Management
188

side of the multipatch features. The outcomes were
then used to produce 3D webmaps (scenes).
Secondly, for the generation of detailed 3D
photorealistic models of two selected cultural
heritage landmarks, a field photogrammetric survey
was carried out. Highly overlapping vertical and
oblique images were taken using a DJI Phantom 4 Pro
drone. Ground control points (GCPs) were also
measured with GPS-RTK for establishing scale and
accurate geolocation of the 3D models. Textured 3D
mesh models were created through standard Structure
from Motion (SfM) workflows and synthetic fly-
through videos were rendered to showcase the
obtained results. The models were uploaded to an
online 3D viewer sharing app (Sketchfab
9
) to offer
users the possibility to interact with the reconstructed
spaces in 3D or Virtual Reality (VR) and then
embedded in the StoryMap.
An appropriate template for the StoryMap had to
be selected, after having gathered and processed all
the data for Salamis island. Esri provides several
configured apps
10
using open source as well as a new
StoryMap template combining popular features from
the previously mentioned ones, which can be used
either as they are (or with minor CSS code
modifications in ArcGIS Assistant
11
) through ArcGIS
Online or can be downloaded through GitHub,
modified and then served through a private server
(Antoniou & Vassilakis, 2019). The first approach
was followed during the deployment of this
StoryMap, not only due to the large number of users
expected to visit the application but also due to the
lack of a private server capable of managing them.
As far as the visual output is concerned, the new
story map approach called ArcGIS StoryMaps
12
was
implemented, as it features a user-friendly interface
having, at the same time a responsive design and
enhanced capabilities to incorporate 3D visualization.
Also, the ArcGIS StoryMaps template has many
important accessibility functions to support readers
with impaired vision or limited mobility, which have
been utilized. Furthermore, due to the large variety of
multiple information that needs to be presented, we
used the guided linear narration through immersive
scrolling (Antoniou et al., 2020) as it is more effective
for the users than the one that allows jumping from
one tab to another without sequence (Antoniou et al.,
2018a).
Finally, the ArcGIS StoryMaps builder accessed
also through a free, non-commercial ArcGIS public
9
https://sketchfab.com/
10
https://storymaps-classic.arcgis.com/en/app-list/
11
https://ago-assistant.esri.com/
account, was used to combine narrative text with
scenes, images, and multimedia as well as web
content in an engaging, full-screen scrolling
experience, as described in the following chapter.
4 THE STORY MAP
In the created StoryMap, all the geocultural,
ecological, and tourism data for the historical island
of Salamis
13
, were presented using 2D and 3D
webmaps (scenes), narrative text, images,
multimedia, and web content, as well as 3D models.
The thematic maps of the application were created
either in ArcGIS Pro or directly in the ArcGIS Online
platform, based on the collected data, fieldwork, and
literature review, depicting the most impressive
points of interest. The individual parameters for each
of the information layers, e.g., its symbol, the
appearance or not of pop-up menus, reference scale,
etc., have been determined (DiBiase et al. 1992;
Newman et al. 2010).
All available information was grouped into six
sections covering (a) the general information of the
natural and anthropogenic environment of the island,
(b) its geodiversity, (c) its biodiversity, cultural
information concerning Historical monuments (e)
and Archaeological sites (f) and (g) recreation and
outdoor activities. The different sections were
separated using a representative photo or video.
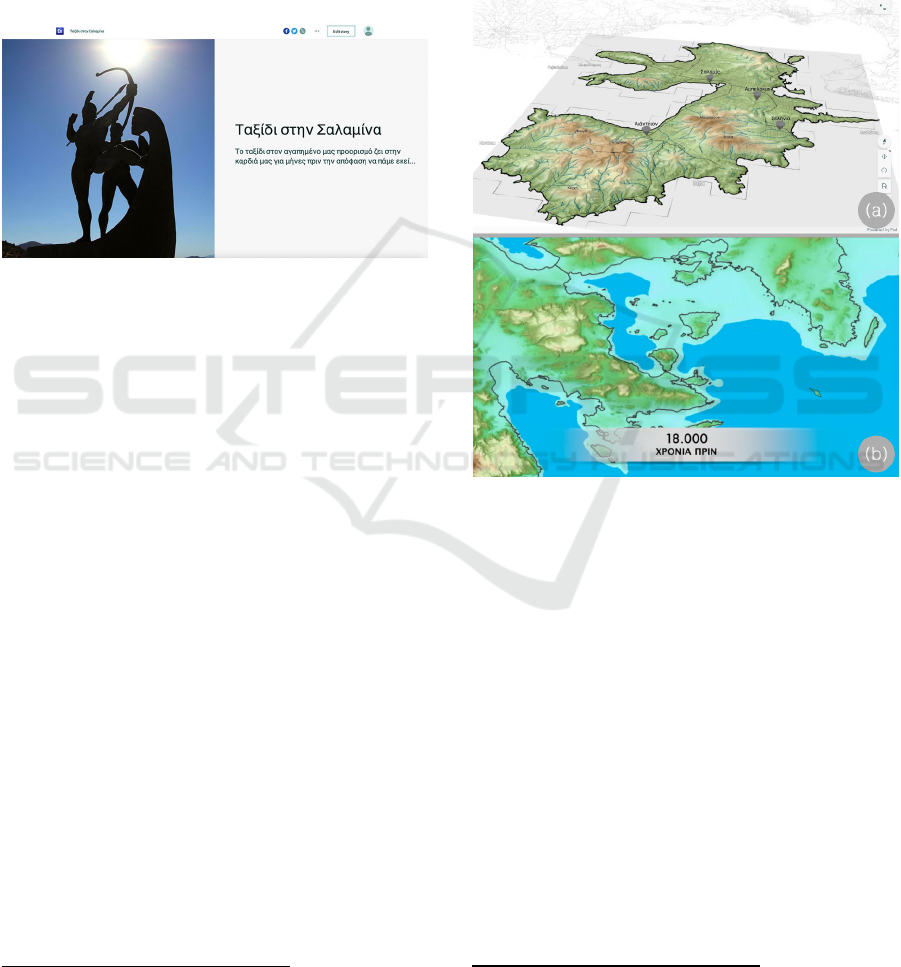
A user’s first impression upon entering the
interactive application is a representative photo of the
area showing the monument dedicated to the famous
naval battle of Salamis (Fig. 2), while a button
allowing the change of the display language is also
present. At this moment, the StoryMap is presented in
the Greek text, but efforts are already underway to
translate it to English.
The narration starts with a brief presentation of the
main natural and anthropogenic features of the island
that made it famous, while a video gives a glance of
Salamis Island in time and space. The narrative text
proceeds to provide information about the geographic
location of the island, as well as about its
morphology, while an interactive scene was created
to present the available information. A 5-m-resolution
digital elevation model from the National Cadastre &
Mapping Agency S.A. of Greece rendered according
to elevation, as well as a multidirectional shaded
relief was used to represent the morphology upon a
12
https://storymaps.arcgis.com/
13
https://arcg.is/jXqDD
A Journey to Salamis Island (Greece) using a GIS Tailored Interactive Story Map Application
189
light, neutral background basemap with minimal
colors, labels, and features, named Light Gray
Canvas. Drainage network in parallel with the main
settlements and specific locations (e.g., mountain
names, islands around the area) mentioned in the text
complete the scene. Users can use the tools at the
bottom right of the map, to zoom in and out or right-
click anywhere on the scene to tilt and rotate to view
the scene from different points of view (Fig. 3a), a
functionality available in all 3D map frames included
in this application.
Figure 2: Screenshot showing the home page of Salamis
Island StoryMap. In the upper left part, users can select a
different language for the narration.
18.000 years ago, Salamis was a part of the Attica
region, connected also with the other present islands
of the Saronic Gulf, and its morphology was altered
because of the constant upward movement of the sea
level. To demonstrate this movement and enhance the
narration, a video animation, in MP4 format was
created in ArcGIS Pro, being a combination of
successive thumbnails of the spatial distribution of
appropriate feature layers along with two digital
elevation models, one for onshore areas with pixel
size 25 m and one for offshore, provided by
EMODnet
14
with 1/16 * 1/16 arc minutes resolution.
Keeping the present days' coastline steady, we
defined the sea level boundary in two well-known
critical moments (Lambeck et al., 2014), 18.000 and
11.000 years ago (Fig. 3b).
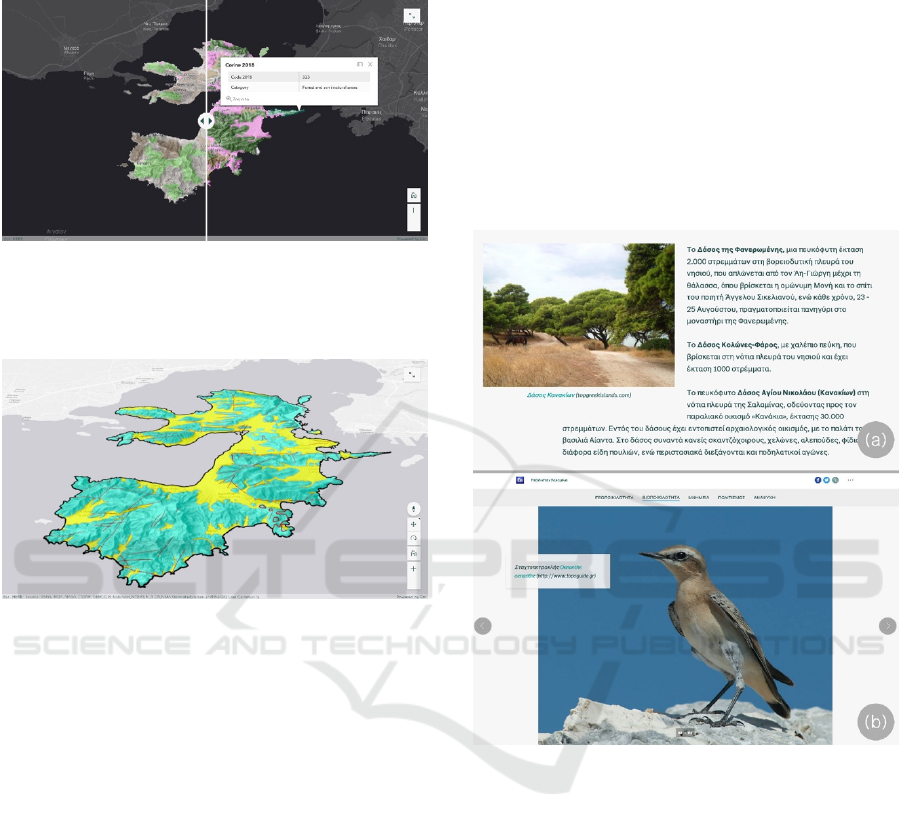
The anthropogenic environment of the island in
present days is also presented based on the CORINE
Land Cover
15
2018 classification. Also, using a
topographic map by Curtius, Ernst. and Kaupert,
Johann A. (Curtius & Kaupert,1895-1903), a land
cover feature class was created for the island’s area in
1895. These two datasets along with the shaded relief
of the island upon a neutral background basemap with
minimal colors, labels, and features, named Dark
14
https://www.emodnet-bathymetry.eu/
Grey Canvas, were combined to create firstly two
separated webmaps and secondly a Swipe media, to
demonstrate landcover changes between these two
different periods, 1895 and 2018. The user can swipe
left or right with the interactive slider to see how the
spatial distribution of each land cover category
changed over the last roughly 125 years (Fig. 4). This
functionality, in combination with pop-up menus,
provides additional information, making the
prevalence of the urban fabric in recent years evident.
Figure 3: Screenshots showing (a) the scene created to
present the morphology of the area and (b) the animation
video presenting the sea-level changes from 18.000 up to
present days.
The first section concludes with a narrative
overview of the archaeological research done on the
island, starting from 1883 when Schliemann
researched the islets in the northern part of the Strait
of Salamis until present days with the collaboration
between the Institute and the Tax Office of
Underwater Antiquities documenting the ancient port
facilities in Ampelakia bay.
The second section presents the geodiversity of
the island consisting of the geological – tectonic
structure which is demonstrated in three-dimensions
along with the shaded relief of the island upon a Light
Grey Canvas basemap using a scene (Fig. 5). Due to
their complexity and the absence of specialized
knowledge of geology by the general public,
15
https://land.copernicus.eu/pan-european/corine-land-
cover
GISTAM 2021 - 7th International Conference on Geographical Information Systems Theory, Applications and Management
190
geological formations are grouped into two main
categories: alpine and post- alpine.
Figure 4: Screenshot showing the Swipe media used to
compare changes in land cover over two time periods, 1895
(left webmap) and 2018 (right webmap). Through pop-ups,
users can extract more information.
Figure 5: Screenshot showing the spatial distribution of
geological formations grouped in two main categories:
alpine (green color) and post-alpine ones (yellow color).
Faults are also presented as line red-colored features.
Although Salamis island is covered mainly by
alpine formations (green color) a narrative text
presents the main characteristics of the geological
formations of each category as well as its tectonic
structure. Alpine formations are separated into two
main geotectonic units: (a) the Sub-Pelagonian one,
which represents the tectonic basement of the island,
and consists mainly of neritic limestone, ophiolites,
and a shale-chert-sandstone formation (Tataris,
1997), and (b) the overthrusted Eastern Greece Unit
at the northern part of the island, consisting mainly of
limestone, which forms the characteristic landforms
of the area. On the other hand, post alpine formations
overlay in unconformity on the alpine ones
differentiated in two phases: (a) the marly limestone,
marls, sandstone, and conglomerates deposited in the
marine environment and (b) the terrestrial formations
consist of slope debris, debris, conglomerate, and
alluvial deposits. The peculiar morphology of
Salamis island is the result of the different geological
formations combined with faults which create local
morphological variations and despite intense
urbanization are still visible to the visitor.
The third section presents the biodiversity and
ecosystems of the area through narrative text and
representative photos. The island belongs to the Euro-
Mediterranean vegetation zone, presenting typically
Mediterranean vegetation species, such as Aleppo
pine that form four forest areas (Fig. 6a) further
described in the text. Additionally, more info (photos
and text) regarding the species of flora and fauna of
the forests, hills, and coasts of the island, presented
through immersive Slideshows (Fig. 6b).
Figure 6: Screenshots showing (a) the narrative text
describing the main forest areas of the island while a
representative photo of one of them enhances the narration
and (b) the immersive Slideshow created to present
representative photos of fauna.
The narration of the fourth section starts by
presenting the historical information about significant
personalities of Ancient Greece, born or having lived
on the island e.g., Euripides and Ajax the Great, as
well as about the famous naval battle of Salamis.
Three presentation ways were chosen for the
important archaeological sites of the island. Firstly, a
3D representation of the Archaeological museum as
well as of the Folk and Maritime Museum of Salamis
was created (Fig. 7a) using the 3D model of the
building produced through a multipatch features
technique upon a 3D representation of satellite
A Journey to Salamis Island (Greece) using a GIS Tailored Interactive Story Map Application
191
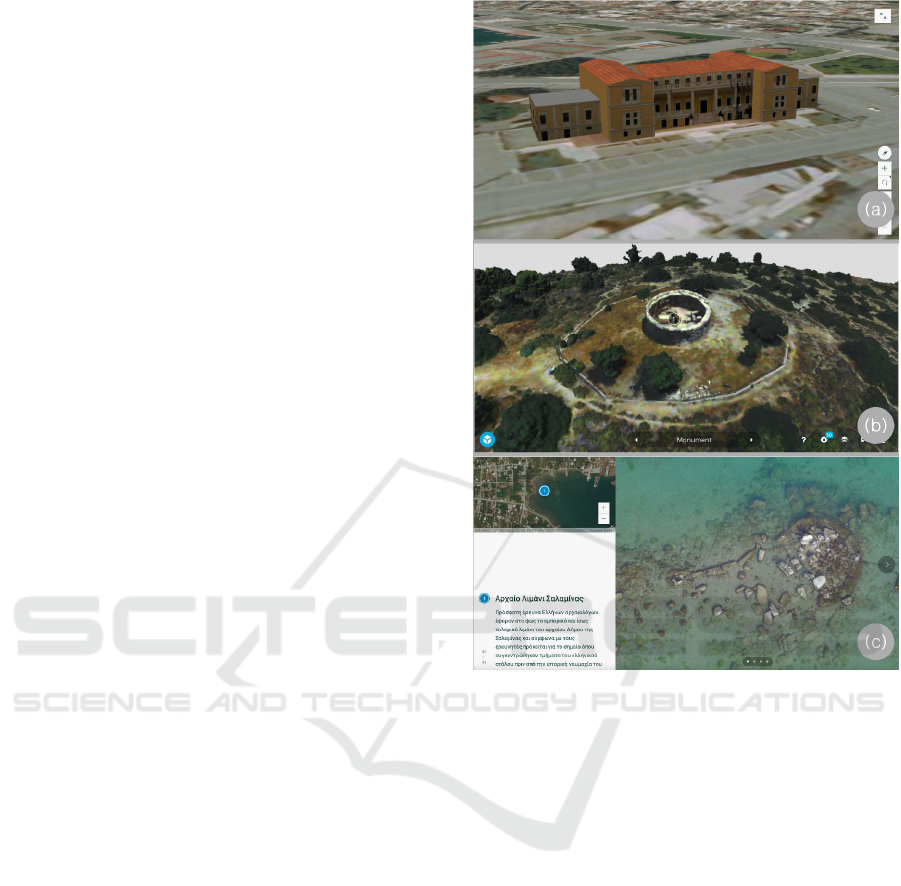
imagery basemap. The supplementary text outlines
the buildings’ main activities and exhibits.
After that, photogrammetric computer vision was
used to create a 3D model of one of the most
important monuments named “Circular burial
monument”, while the narrative text describes its
importance (Fig 7b). For the image-based 3D
reconstruction of the monument, vertical and oblique
photos from a drone survey were combined with GPS
measurements. Open-source tools AliceVision &
Meshroom (Jancosek and Pajdla, 2011; Moulon et al.,
2012) were employed for Structure-from-Motion.
Typically, scale-invariant feature transform (SIFT
features) and their corresponding descriptors (Lowe,
2004) are extracted on the available imagery and
matched across different viewpoints. At this stage, all
available GCPs are identified and measured on the
images. An incremental pose estimation algorithm is
followed by a self-calibrating bundle-adjustment
solution to optimally estimate the interior orientation
of the drone’s camera and the exterior orientation of
each view. A sparse 3D reconstruction is also
estimated through the triangulation of all feature
matches. A dense point cloud is then obtained through
multi-view dense stereo algorithms and a mesh model
is computed through 3D triangulation of the point
cloud. The photorealistic texture is applied through a
multi-view blending scheme. The final 3D model was
simplified, uploaded to Sketchfab online 3D viewer,
and embedded in the StoryMap. The users can
interact with the embedded 3D model, rotating,
zooming, and tilting it, while a VR option is active.
Other places of interest, including also modern
and religious monuments, are presented through a
guided immersive, media-focused, Map Tour where
users can scroll through them in sequential order (Fig
7c). Representative photos, as well as narrative text
for each place, frame the location of each area upon a
satellite imagery webmap.
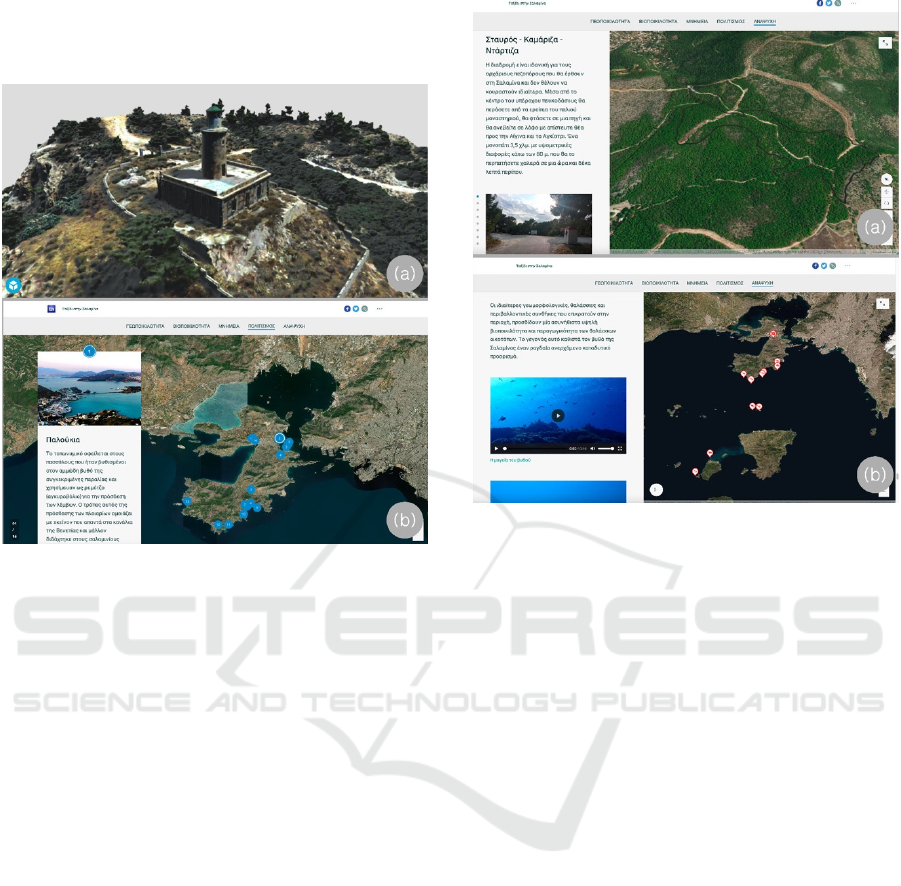
A second photogrammetric 3D reconstruction was
performed for the lighthouse of the island, following
the same workflow described above. The obtained 3D
model offers users the possibility to interact with it
and gain further knowledge by reading the description
in the text (Fig. 8a).
All the other places mentioned, are presented
through a guided immersive, map focused, Map Tour
where users can scroll through them in sequential
order (Fig 8b). Users navigate from place to place
either by following the list of places or jumping from
one place to the other, by choosing a point on the map.
Representative photos and narrative text frame each
point’s location on a satellite imagery webmap.
Figure 7: Screenshots showing the three different ways used
to represent the archaeological, modern, and religious
monuments. (a) 3D representation of the Folk and Maritime
Museum of Salamis using multipatch features technique in
a satellite imagery scene, (b) 3D model of “Circular burial
monument” using SfM technique, and (c) a media-focused
guided tour.
The last section is dedicated to the outdoor
activities on the island. Walking paths, cycling routes,
and scuba diving spots, an immersive Sidecar with a
docked panel is used to present the available
information. For walking paths, narrative text and
photos give information about each path, while a
scene highlights its trail upon satellite imagery. Using
the bullets on the left side of the Sidecar, users can
jump from one path to the other (Fig. 9a). Cycling
routes are presented by a representative photo and
corresponding text while in the diving section, scuba
diving possibilities are presented through a text-
multimedia content combination, accompanied by the
diving spots around it, presented in a satellite imagery
webmap (Fig. 9b). For fishing shelters and bathing
waters, a map focused Map Tour has been chosen.
GISTAM 2021 - 7th International Conference on Geographical Information Systems Theory, Applications and Management
192
At the end of the StoryMap, all references that
were used, are properly cited, along with the research
team responsible for its creation.
Figure 8: Screenshots showing the two different ways used
to present the cultural heritage and touristic information: (a)
a 3D model of the island’s lighthouse using the SfM
technique, (b) a map focused on a guided tour for the places
of interest.
5 DISCUSSION
Web GIS applications have been used to
communicate and showcase spatial information to the
general public. As is true with all online content, their
functionality and usefulness are made even more
evident during the current Covid-19 pandemic (e.g.,
Antoniou et al., 2020c). Esri’s StoryMaps in
particular, have aided in disseminating data and
information to all those concerned in a visually
compelling and engaging manner, as shown in
examples used to promote archaeology (e.g.,
Malinverni et al., 2019; Alemy et al., 2017), as well
as ones aiming to enhance the education process
(Kallaher et al., 2017; Cope at al., 2018).
In the demonstrated GIS application, the aim was
to highlight the importance of a historic area through
its natural and anthropogenic environment using
narrative text, multimedia, and web content as well as
geospatial data and 3D visualization.
Figure 9: Screenshots showing (a) the presentation of
walking path trails using text, photos, and a scene and (b)
scuba diving spots around the island along with descriptive
text and multimedia content.
Using StoryMaps, a geographical visualization
approach, which provides many possibilities, due to
the simplicity of use, both from the aspect of the
developer and the end-user, we manage to integrate
new functions combining many scientific fields and
produce an interactive responsive web app in such a
way that scientific knowledge can be received and
comprehended by a broader audience.
The developed application has already reached
several users in a very small period, and we expect to
broader the audience since it is shared through
Salamis Municipality and Regional Governor of
Attica websites.
Finally, as Salamis Island is adjacent to the Attica
peninsula, it has a recognizable historical identity that
the audience can easily access through this
application. Furthermore, the user can navigate
through the natural, historical and contemporary
environment of the Island. Visiting the Island in this
manner, the audience has a strong motivation for a
future in situ exploration.
ACKNOWLEDGMENTS
This work was funded by the "Regional Development
Fund of Attica", under the framework of the Research
A Journey to Salamis Island (Greece) using a GIS Tailored Interactive Story Map Application
193

Project "Recording and highlighting the geo-cultural
heritage of Salamis Island using modern digital
mapping tools". Mr. G. Patoulis and Mrs. V.
Theodorakopoulou-Bogri are gratefully
acknowledged for their support. This paper was
funded by the Special Account for Research Grants
of the National and Kapodistrian University of
Athens, grant number 70/4/16599. EMODnet
Bathymetry Consortium (2018):
EMODnet Digital Bathymetry (DTM) http://doi.org/
10.12770/18ff0d48-b203-4a65-94a9-5fd8b0ec35f6
was used.
REFERENCES
Alemy, A., Hudzik, S., Matthews, C.N., 2017. Creating a
User-Friendly Interactive Interpretive Resource with
ESRI’s ArcGIS Story Map Program. Hist Arch 51,
288–297. https://doi.org/10.1007/s41636-017-0013-7
Antoniou, V., Nomikou, P., Bardouli, P., Lampridou, D.,
Ioannou, Th., Kalisperakis, I., Stentoumis, Ch.,
Whitworth, M., Krokos, M., Ragia, L., 2018a. An
Interactive Story Map for the Methana Volcanic
Peninsula. 4th Int. Conf. on Geographical Information
Systems Theory, Applications and Management
GISTAM 2018, 68-78, ISBN: 978-989-758-294-3.
Antoniou, V., Ragia, L., Nomikou, P., Bardouli, P.,
Lampridou, D., Ioannou, T., Kalisperakis, I.
Stentoumis, C., 2018b. Creating a Story Map Using
Geographic Information Systems to Explore
Geomorphology and History of Methana Peninsula.
ISPRS Int. J. Geo-Inf., 7, 484.
Antoniou, V., Nomikou, P., Bardouli, P., Sorotou, P.,
Bonali, F.L., Ragia, L. and Metaxas, A., 2019a. The
Story Map for Metaxa Mine (Santorini, Greece): A
Unique Site Where History and Volcanology Meet
Each Other. 5th Int. Conf. on Geographical Information
Systems Theory, Applications and Management
GISTAM, 212-219.
Antoniou, V., Nomikou, P., Zafeirakopoulou, E., Bardouli,
P., Ioannou, T., 2019b. Geo-biodiversity and cultural
environment of Nisyros volcano. 15th Int. Congress of
the Geological Society of Greece, Sp. Pub. 7 Ext. Abs.
GSG2019-195, Athens, 22-24 May 2019, p. 716-717.
Antoniou, V. and Vassilakis, E., 2019c. Diffusion of Geo-
Environmental Datasets through Online Interactive and
Real-Time Applications. Case Study: The Natura
GR2440006 Protected Area. Annals of Geographical
Studies, 2, 1, 8-16.
Antoniou, V., Nomikou, P., Papaspyropoulos, K.,
Zafeirakopoulou, E., Vlasopoulos, O., Xrysopoulou
E.V., Tziannou, E., Ragia, E., 2020a. Corinth Gulf
Story Map: Enhancing Public Awareness in Natural and
Anthropogenic Environment using Interactive GIS
Applications. 6th Int. Conf. on Geographical
Information Systems Theory, Applications and
Management GISTAM 2020, 262-269.
Antoniou, V., Vassilakis, E., Hatzaki, M., 2020b. Is
Crowdsourcing a Reliable Method for Mass Data
Acquisition? The Case of COVID-19 Spread in Greece
During Spring 2020. ISPRS Int. J. Geo-Inf., 9, 605.
Cope, M.P.; Mikhailova, E.A.; Post, C.J.; Schlautman,
M.A.; Carbajales-Dale, P., 2018. Developing and
Evaluating an ESRI Story Map as an Educational Tool.
Nat. Sci. Educ. 2018, 47, 180008, doi:10.4195/
nse2018.04.0008.
Curtius, E., Kaupert, J.A., 1895-1903. Karten von Attika.
Berlin. https://doi.org/10.11588/diglit.776
DiBiase, D., MacEachren, A.M., Krygier, J.B. and Reeves,
C., 1992. “Animation and the Role of Map Design in
Scientific Visualization”. Cartography and
Geographic Information Systems, 19 (4): 201–2014.
Janicki, J., Narula, N., Ziegler, M., Guénard, B., Economo,
E., 2016. Visualizing and interacting with large-volume
biodiversity data using client–server web-mapping
applications: The design and implementation of
antmaps.org. Ecological Informatics
, 32, pp.185-193.
Jancosek, M., Pajdla, T., 2011. Multi-view reconstruction
preserving weakly-supported surfaces. Proc. IEEE
Comput. Soc. Conf. Comput. Vis. Pattern Recognition.
3121–3128.
Lambeck K., Rouby, H., Purcell, A., Sun, Y., Sambridge,
M., 2014. Sea level and global ice volumes from the
Last Glacial Maximum to the Holocene. Proc. Natl.
Acad. Sci. 111(43):15296–15303
Kallaher, A., Gamble, A., 2017. GIS and the humanities:
Presenting a path to digital scholarship with the Story
Map app. Coll. Undergrad. Libr., 24, 559–573,
doi:10.1080/10691316.2017.1327386.
Lowe, D.G., 2004. Distinctive image features from scale-
invariant keypoints. International journal of computer
vision, 60(2), pp.91-110.
Malinverni, E.S., Pierdicca, R., Colosi, F. and Orazi, R.,
2019. "Dissemination in archaeology: a GIS-based
StoryMap for Chan Chan". Journal of Cultural Heritage
Management and Sustainable Development, 9, 4, 500-
519. https://doi.org/10.1108/JCHMSD-07-2018-0048
Moulon, P., Monasse, P., Marlet, R., 2012. Adaptive
Structure from Motion with a contrario model
estimation. Lect. Notes Comput. Sci. (including Subser.
Lect. Notes Artif. Intell. Lect. Notes Bioinformatics)
7727 LNCS, 1–14.
Newman G., Zimmerman D., Crall A. Laituri M., Graham
J., Stapel L., 2010. User-friendly web mapping: lessons
from a citizen science website, International Journal of
Geographical Information Science, 24, 12, 1851- 1869.
Tataris, A.A. 1997.The articulation of the paleogeographic
area of the shale-chert-sandstone formation with
ophiolites of Eastern Greece and the place of Salamina
island and Trapezona Mt. in it. Ann. Geol. De pays
Hellen., 1e SÉRIE, XXXVII, 1015-1032.
Wright, D.J., Verrill, A., Artz, M., and Deming, R., 2014
Story maps as an effective social medium for data
synthesis, communication, and dissemination, Eos,
Trans. AGU, 95, Fall Meet. Suppl., Abstract IN33B-
3773, 2014.
GISTAM 2021 - 7th International Conference on Geographical Information Systems Theory, Applications and Management
194
