
An Analytical Tool for Georeferenced Sensor Data
based on ELK Stack
Thi Thu Trang Ngo
1a
, David Sarramia
2b
, Myoung-Ah Kang
1c
and François Pinet
3d
1
Université Clermont Auvergne, ISIMA, LIMOS-UMR CNRS 6158, Aubière, France
2
Université Clermont Auvergne, CNRS/IN2P3, LPC, Clermont-Ferrand, France
3
Université Clermont Auvergne, INRAE, UR TSCF, Clermont-Ferrand, France
Keywords: ELK Stack, Elasticsearch, Spatial Data Warehouse, Georeferenced Sensor Data, ETL, Streaming Data,
NoSQL, Data Lake, Data Integration.
Abstract: In the context of the French CAP 2025 I-Site project, an environmental data lake called CEBA is built at an
Auvergne regional level. Its goal is to integrate data from heterogeneous sensors, provide end users tools to
query and analyse georeferenced environmental data, and open data. The sensors collect different
environmental measures according to their location (air and soil temperature, water quality, etc.). The
measures are used by different research laboratories to analyse the environment. The main component for
data shipping and storing is the ELK stack. Data are collected from sensors through Beats and streamed by
Logstash to Elasticsearch. Scientists can query the data through Kibana. In this paper, we propose a data
warehouse frontend to CEBA based on the ELK stack. We as well propose an additional component to the
ELK stack that operates streaming ETL which allows integrating and aggregating streaming data from
different sensors and sources given the user configuration in order to provide end users more analytical
capabilities on the data. We show the architecture of this system, we present the functionalities of the data
lake through examples, and finally, we present an example dashboard of the data on Kibana.
1 INTRODUCTION
Sensor environmental data are very diverse, they can
be e.g., measurement of air quality, water or
temperature. These measurements constitute a
continuous stream of data. Accordingly, we need
solutions that can collect, transform, store, organise,
and analyse raw data into useful knowledge.
Data lake is a big data repository solution that can
be used to store many types of data from various
sources, including sensor data (LaPlante, 2016). A
data lake can store structured data, semi-structured
data, and unstructured data. In data lake, all the data
coming from different sources will be stored in the
original format (Ravat, 2019). CEBA is a cloud
infrastructure built for, among other things, collecting
data coming from several sensor networks like
(ConnecSenS, 2015-2020). Its main objective is to
a
https://orcid.org/0000-0003-3719-7073
b
https://orcid.org/0000-0002-7062-9707
c
https://orcid.org/0000-0001-5810-4599
d
https://orcid.org/0000-0001-7011-9216
design a system for collecting, storing, and analysing
environmental data around the region of Auvergne in
France.
CEBA is composed of several components
(Terray, 2020). One of the main components is the
ELK stack, i.e. Elasticsearch, Logstash and Kibana.
Logstash acts as a pipeline of data between sensors
and Elasticsearch. Data from sensors is mainly in
JSON format. Logstash parses the records, transforms
them into the required output and sends them to
Elasticsearch in order to be stored in indexes. Users
of CEBA use Kibana for querying indexes and for
visualisation. These three tools have been chosen
because they are widely used for collecting log
streams and their visualisation capabilities e.g. (Bajer,
2017) – this type of stream can be easily adapted for
sensor data stream.
82
Ngo, T., Sarramia, D., Kang, M. and Pinet, F.
An Analytical Tool for Georeferenced Sensor Data based on ELK Stack.
DOI: 10.5220/0010439200820089
In Proceedings of the 7th Inter national Conference on Geographical Information Systems Theory, Applications and Management (GISTAM 2021), pages 82-89
ISBN: 978-989-758-503-6
Copyright
c
2021 by SCITEPRESS – Science and Technology Publications, Lda. All rights reserved

An interesting functionality for CEBA users
would be to provide them with analytical tools.
Hence, in this paper, we aim to investigate using
Elasticsearch as a data warehouse and Kibana as a
Spatial OLAP visualisation tool. Data warehouses
support managers for decision-making (Jarke, 2002),
(Inmon, 2005), (Pinet, 2010). Traditionally, data
warehouses are based on relational data models, but
this type of models is not the most efficient model for
real-time sensor streams. ELK stack is more suitable
for stream management, but this approach does not
provide analytical features as proposed in data
warehouses. The authors of (Bicevska, 2017)
discussed the NoSQL-based data warehouse
solutions and provided some positive points for this
solution. They noted however the lack of reporting
tools compatible with NoSQL systems.
In this paper, we propose a method to model a
spatial data warehouse model with ELK stack. We
present the main structure of a component called IAT
(Integration and Aggregation Tool) that allows users
defining mappings (Lenzerini, 2002) and aggregation
options between sensors sources and a target index in
Elasticsearch. IAT acts as a streaming ETL (Sabtu,
2017). It continuously extracts records from Logstash
aggregate records, transforms and maps them
according to the output schema. The output data is in
JSON format and is stored in an Elasticsearch index.
Elasticsearch (ES) is powerful in search and
aggregation queries but less for join queries (Pilato,
2017). Hence, we store the data going out from IAT
in one ES index.
The paper is organised as follows. In the next
section, we present some related work. In section 3,
we present our work and the architecture composed
of the ELK stack, as well as the use case for analytical
queries. We present the functionalities of IAT
components through the use case. Finally, we present
an example of measurement station dashboard for our
use case and we conclude.
2 BACKGROUND AND RELATED
WORK
In this section, we present the main related work and
concepts related to our paper topic, i.e., sensor data,
spatial data warehouse, ETL process, ELK stack.
2.1 Sensor Data
Sensors are popular technology solutions to collect
environmental data. With the developing
technologies, there are many kinds of environmental
sensors, e.g., (Werner-Allen, 2006), (Yick, 2008),
(Richter, 2009), (Noury, 2018).
Usually, sensor data are georeferenced data. The
records consist of measurements or observations got
at a specific location (geo-point) or within a specific
area (geo-shape). The geographical information in the
measurement is usually the physical location of the
sensor. In CEBA, data collected from sensors are
georeferenced data.
2.2 Data Warehouse and Spatial Data
Warehouse
In principle, data warehouses are designed for
analytical queries (Inmon, 2005). Data can be
arranged into either as facts or dimensions and mainly
modelled in a star or snow-flake schema. Facts
consist mainly of measures or metrics (i.e., the data to
analyse), and dimensions are mainly descriptive and
upon which the aggregation are processed (Jarke,
2002). Data warehouses can be represented in a
multidimensional conceptual model. The
multidimensional data structures are also called data
cubes. Users can analyse data using online analytical
processing (OLAP) tools. The most popular OLAP
operations are roll up, roll down, slicing, and dicing
(Matei, 2014).
Spatial data warehouses and OLAP tools extend
these concepts. They especially provide support to
store, aggregate and analyse geographical data
(Nipun Garg, 2011). In spatial data warehouses, facts
and dimensions may be spatial objects.
2.3 Batch and Streaming ETL (Extract
Transform Load)
Traditionally, ETL is a process for (i) extracting data
from multiple sources, (ii) transforming and (iii)
loading them into a data warehouse (Bansal, 2015).
Batch ETL corresponds to the ETL process, it is
triggered at a specific time and which processes a
large volume of data in one time.
The streaming ETL is an enhanced approach of
the ETL process. It executes the ETL process in near
real-time. This approach solves the limitations of the
batch ETL for streaming data and allows analysing
data in a short time after it is produced by the sources.
2.4 ELK Stack
ELK stack (Elasticsearch, 2020) is composed of four
main open-source projects: Beats, Logstash,
Elasticsearch, and Kibana. Beats are data shippers.
An Analytical Tool for Georeferenced Sensor Data based on ELK Stack
83
Logstash is a data processing pipeline. Elasticsearch
is a document-oriented database. The documents are
JSON objects and Kibana is a user interface tool of
Elasticsearch for administration and queries.
2.4.1 Beats and Logstash
Beats are lightweight data shippers. They mainly ship
data from the source such as files to Logstash.
Logstash is a processing pipeline engine with real-
time pipelines. It ingests data from multiple sources,
transforms and ships the transformed data to the
configured destinations (Bajer, 2017) such as
Elasticsearch. Each data processing event is
processed in three main stages: input, filter, and
output.
2.4.2 Elasticsearch
Elasticsearch (ES) is the heart of the ELK stack. It is
a search engine with real-time and full-text searching.
It is also a document-oriented database. In ES,
documents are JSON objects that are stored within an
Elasticsearch index. An index in ES is comparable to
a database in the relational database world. A
document is like a row in a table and document fields
are table attributes. A field can be of many different
types such as a string, a number, etc. The mapping of
an index in ES is like a database schema. It defines
the types of the fields for the documents such as
keyword, integer, date, etc. and how the fields should
be indexed and stored in ES.
ES supports two spatial data types: geo_point and
geo_shape (Elasticsearch, 2020). Geo_point type
combines latitude and longitude information.
Geo_shape type includes point, linestring, polygon,
multipoint, multilinestring, multipolygon,
geometrycollection, envelope, and circle.
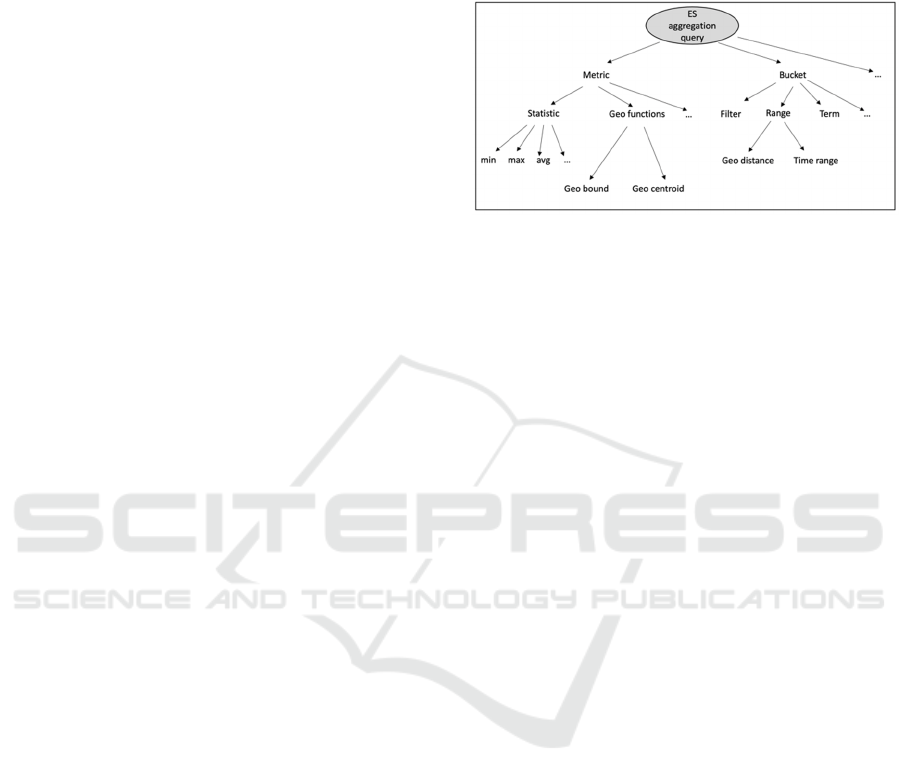
ES supports two main types of aggregation query
(Elasticsearch, 2020): metric aggregation and bucket
aggregation (see Figure 1).
Metric aggregation queries compute and return a
value over a set of documents. Two main kinds of
metric aggregation queries are interesting for our
project:
Statistic query such as min, max, average, etc.
Geo functions query such as geo-bound, etc.
Bucket aggregation query consists in grouping
documents with respect to some fields. It includes
three main categories:
Filter query is to compute one bucket.
Range query is to compute buckets by some
ranges such as time range, etc.
Term query is to compute one bucket for each
value in some fields.
Figure 1: ES aggregation query types tree.
The author of (Guo, 2020) provided an exhaustive
survey of geospatial information processing in
NoSQL databases. They conclude that document-
based NoSQL databases, i.e. Mongo DB,
Elasticsearch are the best in terms of functionalities
and query capabilities for geospatial information
systems. ES has the benefit to be natively connected
to the visualisation tool Kibana.
2.4.3 Kibana
Kibana is an application that connects natively with
Elasticsearch (Bajer, 2017) without any configuration
which makes it easy to use as a visualisation
application for data in ES.
An interesting visualisation functionality of
Kibana is the dashboard as it supports ES aggregation
queries. It is a combination of charts, plots, maps, data
tables, etc that user can construct in order to analyse
their data.
Kibana is also an administration tool of ES and
provides a human-friendly interface for writing
queries. Elasticsearch and Kibana are already used
widely in many use cases for storing and visualising
data (Bajer, 2017), (Dubey, 2018). We propose to use
Kibana as a spatial OLAP tool.
3 SPATIAL DATA WAREHOUSE
WITH ELASTICSEARCH
In this paper, we show how to design an analytical
tool based on Elasticsearch to allow users get useful
insights from the sensor data. Currently, we
experiment our approach on CEBA which is
composed of several components for e.g. data
GISTAM 2021 - 7th International Conference on Geographical Information Systems Theory, Applications and Management
84
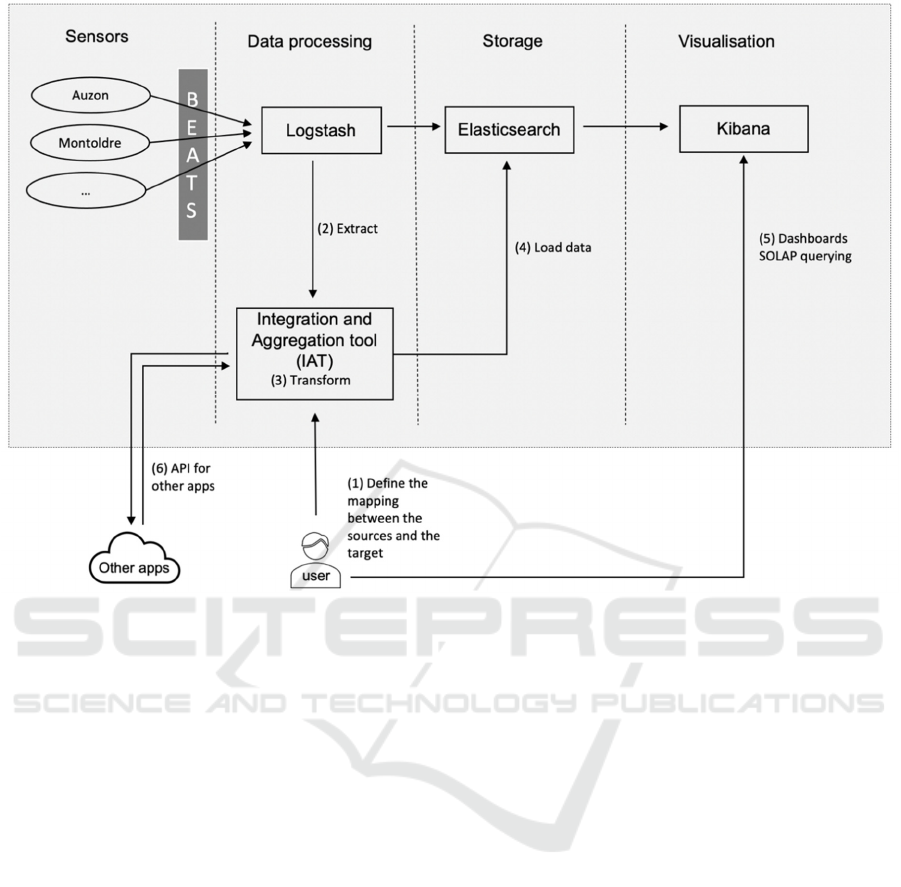
Figure 2: System architecture.
collecting, storing, archiving. ELK stack is one of the
main CEBA components for collecting, storing and
visualising data. As soon as a new record is generated
by a sensor, the record is collected by Beats and sent
to Logstash. The record is parsed and transformed to
cope with the corresponding index in Elasticsearch.
Finally, users can query and visualize the data
through Kibana.
However, it is not efficient to run complex
analytical queries upon different sensor data in the
current configuration for two main reasons: (i) The
mapping (schema) of the indexes may not be
homogeneous between sensors, (ii) Elasticsearch
does not perform well for joining indexes (Pilato,
2017).
Hence, our solution consists in building one index
in Elasticsearch for analytical purposes that we call
the target index. We also propose a streaming ETL
application (IAT). Its role is to pipeline data from
Logstash to the target index. This process is driven by
a user configuration described in section 3.4.
In the following, we first present the global
system architecture. Then we present a
multidimensional model for our use case and its
corresponding physical mapping in the ES target
index. We describe the functionalities of the
streaming ETL application. Finally, we show an
example of dashboard with use case data queries and
visualisations.
3.1 System Architecture
Figure 2 describes the architecture of our system.
Data generated by sensors are collected by Beats and
sent to Logstash. Then, the output of Logstash is both
stored in ES and extracted by IAT. IAT processes the
data following the user configuration (see section 3.4)
and stores the results in ES as well. The output of IAT
can be also sent to applications other than ES. The
functionalities of IAT are (i) fields mapping, (ii) time
window aggregation and (iii) integration with
external sources. (i) Fields mapping includes
mapping one or several fields in sources to one or
several fields in the target index. (ii) Time window
aggregation consists in aggregating sensor data
during a certain interval of time and operating
functions on measurement fields. (iii) IAT integrates
the sensor data with additional sources in order to
enrich the data with additional information (e.g city,
department). These functionalities will be more
detailed in the section 3.4.
An Analytical Tool for Georeferenced Sensor Data based on ELK Stack
85
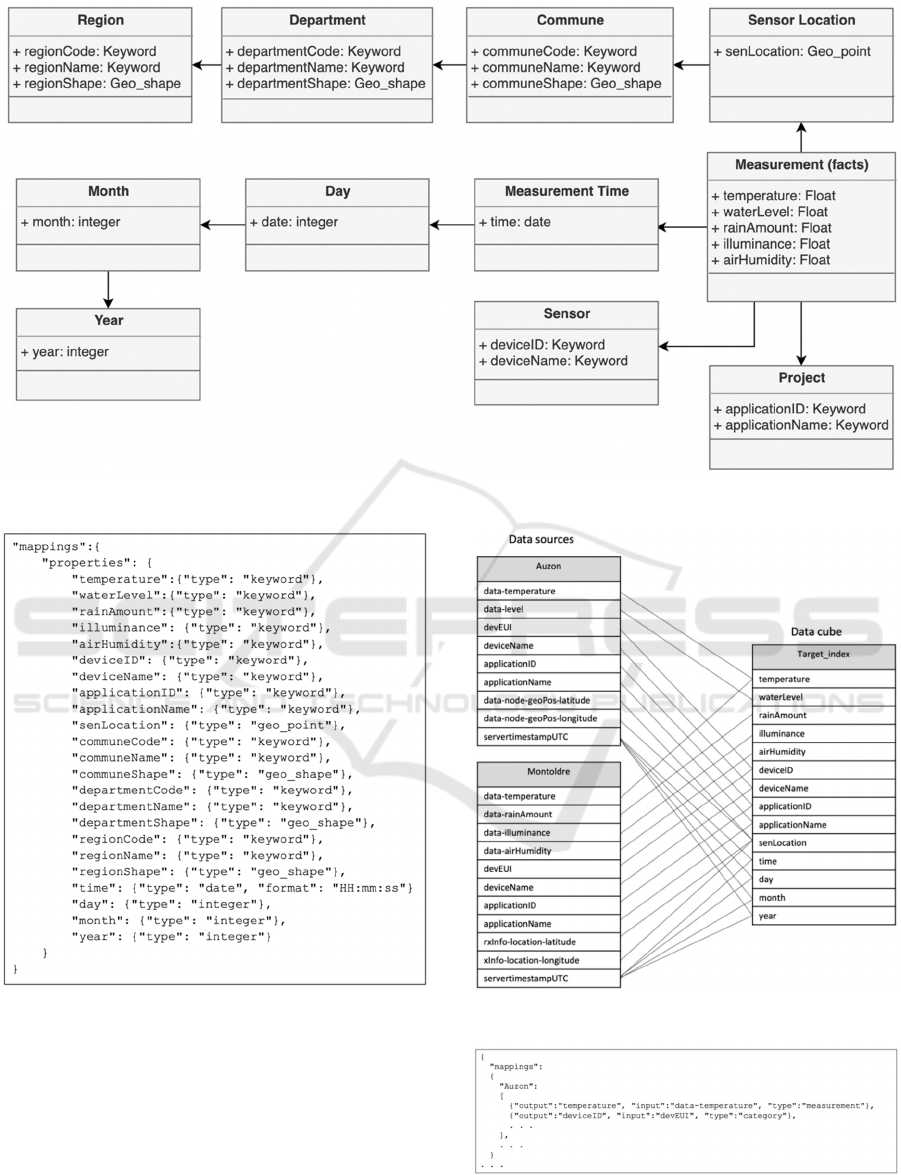
Figure 3: Multi-dimensional conceptual model for the measurement fact.
Figure 4: The target index mapping.
Figure 5: Mapping data sources to target index.
Figure 6: Snippet of mappings configuration file.
GISTAM 2021 - 7th International Conference on Geographical Information Systems Theory, Applications and Management
86

3.2 Multidimensional Model and Its
Corresponding Physical
Elasticsearch Index
In this section, we present one example of multi-
dimensional schema related to CEBA use case. We
also present the corresponding physical mapping of
the index that will store the data in Elasticsearch.
The multidimensional model in Figure 3 presents
the data warehouse classes and aggregating
associations noted by “←” (Pinet, 2010). The fact is
the Measurement class. The dimensions are
hierarchies of classes that start from Measurement.
The fact includes five sensor measurements:
temperature, water level, rain amount, illuminance,
and air humidity. We define four dimensions
including: sensor location, time of measurement,
sensor information and the scientific projects
associated to the data.
The time dimension is a hierarchy that allows
aggregating measurements according to days,
months, and years.
The space dimension is a hierarchy that allows
aggregating measurements according to
geographical shapes, communes, departments,
and regions in France (The regions of France,
2016). In France, communes are the smallest
administrative division of territory, equivalent
to towns.
Here are some examples of analytical queries that
can be computed upon this model:
Compute average/ min/ max measurement
(such as temperature) in a given area during a
certain interval of time.
Count the number of collected documents by
given measurement during a given time period.
Count the number of collected documents by
given measurement and location.
3.3 Target Index (Data Cube)
We implement the multidimensional model in Figure
3 in Elasticsearch as one index which mapping
(schema) is displayed in Figure 4.
We name this index the target index. The fact
(measurements) includes five fields {temperature,
waterLevel, rainAmount, illuminance, and
airHumidity} with data type as float. The dimensions
are (i) sensor location fields such as senLocation and
departmentCode, (ii) temporal fields such as time and
day, and (iii) information fields such as deviceID and
applicationID.
3.4 Streaming ETL Application (IAT)
IAT main purpose is to pipeline data from Logstash
to the target index in ES. We implemented it in
Python. The process is driven by the user
configuration which defines the rules for three
functionalities of the pipeline: (i) field mapping, (ii)
time window aggregating and (iii) integrating with
other sources. For our experiments, we used two
sources of sensor data in CEBA.
3.4.1 Field Mapping
This functionality aims to map fields from data
sources to fields in the target index. We consider four
types of fields:
Measurement group (e.g temperature, air
humidity)
Information group (e.g device name,
application name)
Location group (e.g latitude, longitude)
Time group
For information group, the mapping is mainly
renaming. For measurements, the user can define a
transforming function, e.g transforming Celsius to
Fahrenheit or meter to kilometres. For location fields,
this functionality builds the geo-point type recognised
by ES. For time, the mapping consists in splitting the
fields into different granularity of time (day, month,
week, …).
Figure 5 displays the mapping between two sensor
data sources of the ConnecSenS project and the target
index.
Figure 6 represents a snippet of the configuration
file for fields mapping. The snippet displays the
mapping of two fields of the Auzon data source.
3.4.2 Time Window Aggregating
This functionality consists in aggregating
continuously records generated during a window of
time of fixed size. This functionality is useful in case
the sources have different frequency of record
generation. The snippet in Figure 7 shows the user
configuration for time windows aggregation. IAT will
aggregate sensor data by intervals of 10 minutes and
compute the average of all measurement fields.
3.4.3 Integrating Other Sources
This functionality consists in integrating sensor data
with external sources. Figure 8 displays a snippet of
the configuration for integrating external sources.
This configuration implies that IAT will make a
An Analytical Tool for Georeferenced Sensor Data based on ELK Stack
87
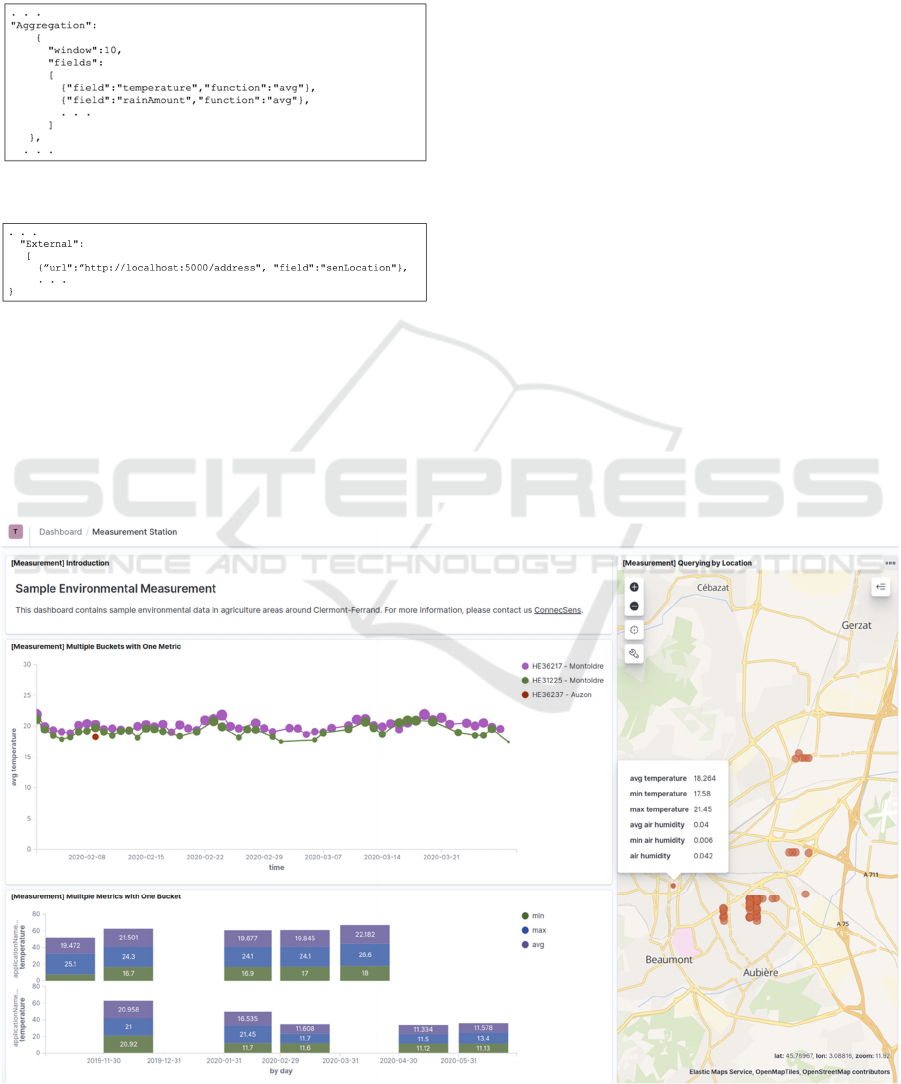
request to the API defined by the URL and will send
the coordinates in the senLocation field. The response
is a set of tuples (City, Commune and Country)
related to the coordinates. The response will be joined
to the set of records.
Figure 7: Snippet of aggregation configuration file.
Figure 8: Snippet of external configuration file.
3.5 Queries and Visualisation in
Kibana
Once the data are stored in the target index in ES, user
can be able to build dashboards for this index in
Kibana. As presented in section 2.4.3, we aim to use
dashboard of Kibana as a spatial OLAP tool. Kibana
provide a dedicated GUI (a panel) to build easily
aggregation queries. The result can be a plot, chart or
map. These figures can be gathered in a dashboard.
We show in Figure 9 an example dashboard for
our use case data. The plot at the top left displays the
variation of the average temperature per the
dimensions time (level “day”), project and device. In
this chart, we combine three bucket aggregations and
one metric aggregation. The plot at the bottom
displays three statistics of the fact temperature for the
two projects per day. In this chart, we combine three
metric aggregations and one bucket aggregation. The
map on the right shows the physical location of the
sensors. Users can discover the statistical information
of a specific sensor by hovering the mouse over it.
4 CONCLUSION AND FUTURE
WORK
We presented our work for creating an analytical tool
on top of Elasticsearch for sensor data. We presented
the general architecture of our system. We also
presented a streaming ETL application that pipelines
sensor data in near real time to Elasticsearch and
showed a dashboard based on the use case data. For
Figure 9: The measurement station dashboard.
GISTAM 2021 - 7th International Conference on Geographical Information Systems Theory, Applications and Management
88

future work, we want to provide the users of CEBA
with our analytical tool and evaluate its impact on
their respective work. We also aim to improve IAT
tool to be able for example to handle additional
measurements for an already existing target index, or
to propose spatial aggregation functions for
georeferenced measures. We as well want to
automate the creation of the target index mapping
from the multidimensional conceptual model.
ACKNOWLEDGEMENTS
This research was financed by the French government
IDEX-ISITE initiative 16-IDEX-0001 (CAP 20-25)
and the PhD is funded by the European Regional
Development Fund (FEDER).
REFERENCES
LaPlante, A. a. (2016). Architecting data lakes: data
management architectures for advanced business use
cases. O'Reilly Media Sebastopol.
Ravat, F. a. (2019). Data lakes: Trends and perspectives.
International Conference on Database and Expert
Systems Applications (pp. 304--313). Springer.
ConnecSenS, P. (2015-2020). Retrieved from
http://www.lpc-clermont.in2p3.fr/spip.php?article583
Terray, L. a.-J. (2020). From Sensor to Cloud: An IoT
Network of Radon Outdoor Probes to Monitor Active
Volcanoes. Sensors (p. 2755). Multidisciplinary Digital
Publishing Institute.
Bajer, M. (2017). Building an IoT data hub with
Elasticsearch, Logstash and Kibana. 5th International
Conference on Future Internet of Things and Cloud
Workshops (FiCloudW) (pp. 63--68). IEEE.
Inmon, W. H. (2005). Building the data warehouse. John
wiley & sons.
Jarke, M. a. (2002). Fundamentals of data warehouses.
Springer Science & Business Media.
Pinet, F. a. (2010). Precise design of environmental data
warehouses. Operational Research (pp. 349--369).
Springer.
Bicevska, Z. a. (2017). Towards NoSQL-based data
warehouse solutions. Procedia Computer Science (pp.
104--111). Elsevier.
Lenzerini, M. (2002). Data integration: A theoretical
perspective. Proceedings of the twenty-first ACM
SIGMOD-SIGACT-SIGART symposium on Principles
of database systems, 233--246.
Sabtu, A. a. (2017). The challenges of extract, transform
and loading (etl) system implementation for near real-
time environment. 2017 International Conference on
Research and Innovation in Information Systems
(ICRIIS). IEEE.
Pilato, D. (2017). How to fetch data from multiple index
using join like sql. Retrieved from Elasticsearch:
https://discuss.elastic.co/t/how-to-fetch-data-from-
multiple-index-using-join-like-sql/106131
Werner-Allen, G. a. (2006). Deploying a wireless sensor
network on an active volcano. IEEE internet
computing.
Yick, J. a. (2008). Wireless sensor network survey.
Computer networks, 52, 2292--2330.
Richter, C. (2009). Visualizing sensor data. Media
Informatics Advanced Seminar on Information
Visualization.
Noury, N. a.-N.-S. (2018). Challenges and Limitations of
Data Capture versus Data Entry. Connected Healthcare
for the Citizen (pp. 85--97). Elsevier.
Bansal, S. K. (2015). Integrating big data: A semantic
extract-transform-load framework. Computer (pp. 42--
50). IEEE.
Elasticsearch. (2020). ELK. Retrieved from
https://www.elastic.co/elastic-stack
Guo, D. a. (2020). State-of-the-Art Geospatial Information
Processing in NoSQL Databases. ISPRS International
Journal of Geo-Information (p. 331). Multidisciplinary
Digital Publishing Institute.
Dubey, S. a. (2018). Data Visualization on GitHub
repository parameters using Elastic search and Kibana.
2018 2nd International Conference on Trends in
Electronics and Informatics (ICOEI) (pp. 554--558).
IEEE.
The regions of France. (2016). Retrieved from
https://www.map-france.com/regions/
Nipun Garg, S. M. (2011). Spatial databases Spatial Data
warehouses. Retrieved from pdfs.semanticscholar.org:
https://pdfs.semanticscholar.org/684a/4a2c41360e596
5281ee09cabbb621f4400cb.pdf
Matei, A. a.-M. (2014). OLAP for multidimensional
semantic web databases. Enabling Real-Time Business
Intelligence (pp. 81--96). Springer.
An Analytical Tool for Georeferenced Sensor Data based on ELK Stack
89
