Assessment of Building Integrated Photovoltaic Panels on Facades of
Commercial Buildings with Respect to Energy
Conservation Building Code
Achinta N Shetty
1
, Pradeep G. Kini
2,*
, Pranav Kishore
2
and Vipin
Tandon
2
1
Manipal School of Architecture & Planning, Manipal Academy of Higher Education, Manipal, India
2
Center of Sustainable Built Environment, Manipal School of Architecture and Planning,
Manipal Academy of Higher Education, Manipal, India
Keywords: BIPV Panels, Performance Analysis, Energy Production, Optimal Tilt Angle, Design Builder, Payback
Period, BIPV Integration Style.
Abstract: The formulation of the paper considered the need for adapting to renewable resources in fast-growing world.
The integration of Building Integrated Photovoltaic (BIPV) panels will minimize the environment damage,
climate change, and resource shortages. The BIPV system implemented on the facade is one of the suitable
solutions to increase the building performance using the on-site renewable resource with a reduced impact on
the surroundings. The methodology introduced in this paper is carried out by using Design Builder software
initially, which provides an understanding of the PV energy produced to achieve 3% renewable energy in a
modelled commercial building of 20,000 m
2
according to the Energy Conservation Building Code (ECBC)
while placed in a moderate climatic zone. This paper aims at studying various approaches to further enhance
the energy production of the modelled building after attaining the ECBC minimum requirement. PVGIS
system is used to assess parameters such as PV technology used, integration of the panels, system loss, year
to year variability, tilt angles of the panels. Further, shadow analysis of the optimal angle to maximize energy
production is analysed. A comparative study between the modelled building and the PVGIS system on the
panel cost and payback period is conducted. Based on the optimum tilt and azimuth angles, shadow analysis
and daylighting analysis is carried out. The paper provides an understanding of the optimal integration style
of the BIPV panels on the building facade.
1 INTRODUCTION
The escalating growth of the world and energy use
has raised concerns globally on the prolonged
exhaustion of energy resources and their destructive
environmental impacts. Commercial, residential, and
public buildings are presently contributing to 31% of
the world’s energy demand. Alternatively, fossil fuels
are presently in use as the world’s most primary
energy source. However, the use of fossil fuels has its
own disadvantages, such as, environmental
destruction, lack of energy, and change in the climate.
Hence, the use of alternative energy resources which
non-polluting and renewable, is the need of the hour.
(lHassanGholami, 2019)
Pradeep.kini@manipal.edu
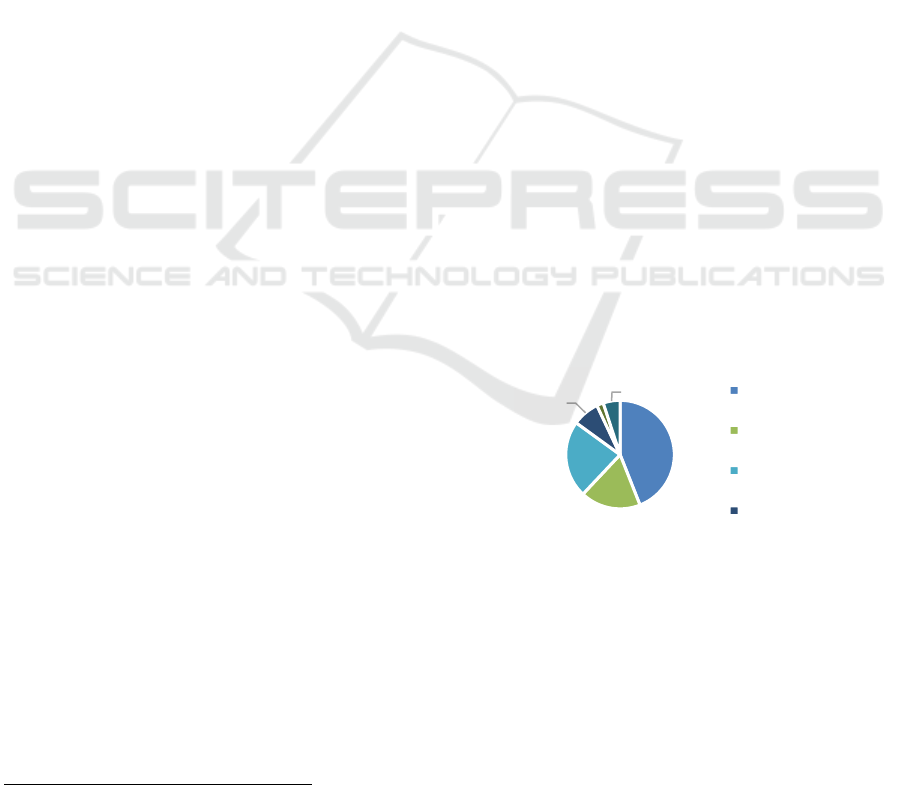
Figure 1: Sector-wise energy consumption (Energy
Statistics).
Fig.1. represents the total energy consumption in
India in 2015, i.e., 948,328 GWh, in which the highest
energy-consuming sector is the industries followed
by domestic power consumption. India’s combined
key energy demand is expected to grow by 2.3 times
in the following two decades due to continued
economic progress in the building, industrial sectors,
and transportation (Joshi, 2018).
44%
18%
23%
8%
2% 5%
Industry
Agriculture
Domestic
Commercial
148
Shetty, A., Kini, P., Kishore, P. and Tandon, V.
Assessment of Building Integrated Photovoltaic Panels on Facades of Commercial Buildings with Respect to Energy Conservation Building Code.
DOI: 10.5220/0010438501480155
In Proceedings of the 10th International Conference on Smart Cities and Green ICT Systems (SMARTGREENS 2021), pages 148-155
ISBN: 978-989-758-512-8
Copyright
c
2021 by SCITEPRESS – Science and Technology Publications, Lda. All rights reserved

A building to become a zero energy or zero-
emission building, the use of non-renewable energy,
i.e., solar energy plays a very important role. In this
regard, the use of building-integrated photovoltaics
(BIPV) can play an important part towards the zero
energy or zero-emission building. The BIPV is
photovoltaic cells which can be used in building
envelopes such as facade or roof. The lifetime of the
BIPV system is expected to be 30 years
(B.Winnettabc, 2012), however, additional studies
indicate the lifetime to be around 50 years. The BIPV
system capacity can differ from a limited
kilowatt(kW) for a residential building to several
megawatts (MW) for a commercial purpose.
The present study focusses on the use and
implementation of the BIPV system on improving
energy efficiency and consequently enhance the
overall building performance according to ECBC
(ENERGY CONSERVATION BUILDING CODE,
2017).
1.1 Background and Literature Review
The BIPV products were found in 1990; initially, the
rooftop mounted PV panel was installed on metal
frames. In the later period, technological
developments led to the creation of easier
architectural designs that carefully integrates the
collection of solar energy into its building design
(Hall, 2014).
The BIPV panels are suitable for significant
buildings and cities. However, it is quite expensive as
compared to the conventional solar system. Yet, the
researchers consider the supplementary costs reduced
significantly if a revamp or new building envelope is
needed anyway. The clients can be benefitted of
around ten years of payback time for these additional
costs incurred (Bhambhani, 2019).
The vertical integration provides a chance to
substitute with solar panels, resulting in reduced
energy footprint and delivering a positive ROI (return
on investment) on the supplementary investment.
The factors affecting the function of the panel
(MarcoCasini, 2016) are:
(i) Shape and size of the glazing factor
(iii) the distance amongst the PV cells (gradation
of transparency)
(ii) technology (monocrystalline and
polycrystalline silicon)
Various studies were conducted considering several
parameters such as the energy generation, types of
material, tilt angles, etc. Biyik et al. (BaverAtlıf,
2017) aimed at increasing the system efficiency
considering various factors affecting the BIPV panels
such as ambient temperature, the direction of the
building and the slope of the PV to get higher power
output using simulation tools Energy plus and
TRNSYS. YilinLi et al. (Yilin Li a Zhi, 2017)
examined the influence of the PV facade's on
different tilt angles (30, 45, and 60°) on the surface
temperature and PV cell efficiency of the naturally
ventilated PV façade. The optimum tilt angle of 30
degrees has the lowest mean surface temp, which
provides the optimal performance of elimination of
heat from the PV panel. Daniel Tudor Cotfas at el.
(Daniel Tudor Cotfas, 2014) provides simple
methods to enhance the amount of the electrical
energy delivered by the PV panels. Photovoltaic
Geographical Information System was used to get
calculations based on various materials and angles.
The results showed an increase in energy produced
without additional costs and materials. AliceBellazzi
at el. (Alice Bellazzi, 2018) investigates the energy
and thermal performance of a BIPV integrated façade
based on different configurations, the global
efficiency and the electric production were assessed
through a supervising operation of the environmental
and energy variables in physical working
environments and a mathematical model designed to
compare the performance of the system. It was found
out that all the parameters were interdependent and
depended mainly on climatic variations. A. K.
Sharma at el. (Sharma, 2017) provided an
understanding of design tool for BIPV systems
considering factors such as orientation, location, and
panel efficiency and reported that the facade's
orientation and the building's location which provided
an ideal solution. Grasshopper, Ladybug, and
Honeybee are all Rhinoceros 3d plug-ins, were all
used to interface Energy Plus and Radiance for the
illuminance and calculation for the annual energy
computations.
2 DESCRIPTION OF THE
METHODS
The fig.2 shows the flow chart of methods followed
to assess the BIPV panels-
- The design-builder is initially used to identify the
PV energy production (according to ECBC) and the
modelled building's active façade area placed in
Bangalore (temperate zone-ECBC).
- PVGIS system is used to assess the PV
technologies based on the energy production and
active area resulted in the Design-Builder (optimum
angle, orientation, PV technology, and the cost is
identified).
Assessment of Building Integrated Photovoltaic Panels on Facades of Commercial Buildings with Respect to Energy Conservation Building
Code
149
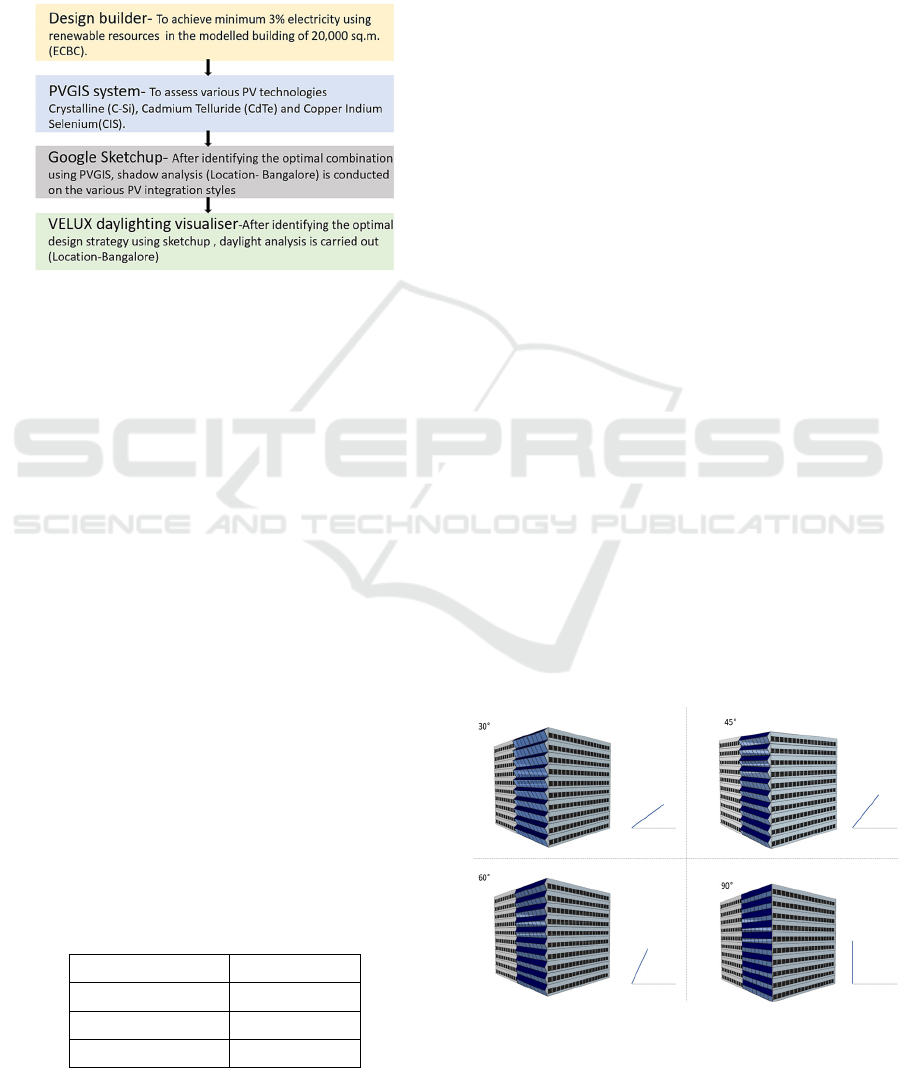
- A comparative study between the Design-Builder
and PVGIS system is carried out based on the energy
production and payback period.
- Based on the PVGIS result (optimum
combination), Google sketch-up is used to illustrate
the panels' integration styles on the facade, and
shadow analysis is conducted (Location-Bangalore).
Figure 2: Outline of the methods followed.
2.1 Design Builder
To understand the minimum PV energy produced by
a commercial building (according to ECBC) out of
the total energy consumption and to identify the
active area on the façade.
The design-builder is used to provide minimum
PV energy production to reach the ECBC requirement
for a 20,000m
2
commercial building considering
parameters such as the U value of different elements,
WWR ratio, climatic condition, etc. to calculate the
EPI of the building.
A commercial building of 20,000 m
2
should have
a minimum of 3% of the total power consumption that
should be generated using Renewable Energy
Generating Zone (REGZ) as per the ECBC. A 10-
story building was modelled on Design Builder with
a total area of the building to be 20,000 m
2
. PV cells
were integrated into the south façade of the building.
The location of the building was Bangalore (26℃
annual temperature temperate zone). The building
was modelled, according to (Mayank Bhatnagar,
2019). Parameters considered are shown in table 1
(ECBC 2017).
Table 1: Parameters followed in the modelled building
according to ECBC.
U value of wall 0.4 W/m2K
U value of roof 0.33 W/ m2K
U value of glass 3 W/m2K
WWR ratio 40%
2.2 Using PVGIS System
PVGIS helps to assess the PV capacity for various
patterns and technologies of grid-connected and
stand-alone systems. PVGIS system is used to assess
Slope angle [°], Yearly PV energy production [kWh],
Azimuth angle [°], Yearly in-plane irradiation
[kWh/m2], Year-to-year variability [kWh] in
Bangalore, which design builder does not provide.
Hence after reaching the minimum requirement
according to ECBC using design builder and
identifying the active area on the façade and PV
energy production, further enhancement is carried out
by assessing the PV technology.
The assessment is conducted based on three
different PV technologies: Crystalline (C-Si),
Cadmium Telluride (CdTe) and Copper Indium
Gallium Selenide(CIS). The efficiency and price per
kWh are considered as follows: C-Si: 12-15%, 36.01
INR, CdTe: 6-9% ,22.78 INR and CIS: 7.5-9.5%,
26.46 INR. The lifetime of the BIPV system is
expected to be 25 years.
Alternate 1 -The slope angles, i.e., 30°,45°,60°,
and 90°, is tested with different azimuth angles (for
other PV technology) to understand the optimal
orientation and tilt angle for the panel integration.
Alternate 2- The most efficient PV technology (C-
Si, CdTe, CIS) is also identified by comparing yearly
PV energy production [kWh], Yearly in-plane
irradiation [kWh/m2], Year-to-year variability
[kWh], and the total loss (%).
Alternate 3 - The PV cost (INR) is calculated for
various PV technology.
2.3 Using Google Sketchup
Google SketchUp is a freeware 3D modelling
software, used to illustrate various integration of
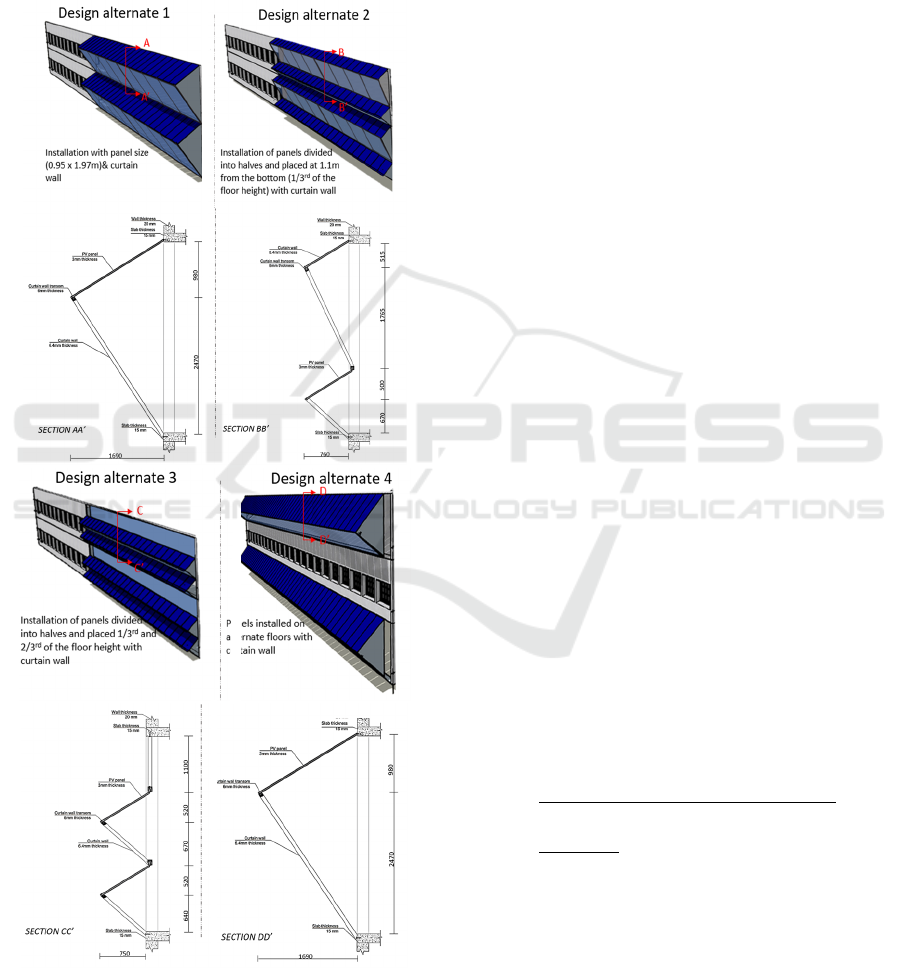
Figure 3: Illustration showing various tilt angles on building
façade.
SMARTGREENS 2021 - 10th International Conference on Smart Cities and Green ICT Systems
150
panels on the façade. The same building was used as
designed in the design-builder for further assessment.
Alternate 1 – Fig. 3 shows an illustration for the tilt
angles integrated on the building facades used in the
PVGIS system.
Alternate 2 – Assessing the optimal orientation, tilt
angle and yearly PV energy production.
Figure 4: Various integration styles on the building façade
with sections.
Further enhancement of the suitable combination is
carried out by integrating various design strategies on
the façade (fig. 4), conducting shadow analysis by
modelling a similar building modelled in Design
builder (3.1.). The shadow analysis is carried
throughout the day when the sky is clear. The shadow
cast is measured (%), and an optimal design strategy
is identified.
2.4 Using VELUX (Badri Mohapatra,
2018)
VELUX Daylight Visualizer is a specialized lighting
simulation tool for the assessment of daylight
requirements in buildings. It is intended to boost the
use of daylight and help professionals by assuming
and documenting daylight factor and the appearance
of an area before reaching the building design. The
daylighting analysis is conducted on a building with
40% WWR according to ECBC 2017.
Alternate 1 - The design integration styles (fig. 4)
modelled in Google SketchUp for the optimal
combination identified using PVGIS are further
assessed for daylighting (after results achieved from
2.2.).
The building modelled in Google Sketchup is
simulated in VELUX, in Bangalore
(12.9716°N,77.5946°E) at 15:00 IST with the
integrated design style on the southern side.
3 RESULTS & ANALYSIS
3.1 Using Design Builder to Achieve
ECBC Minimum Requirements:
(2.1)
The amount of energy consumption in the modelled
building of 20,000 sq.m. resulted in 46,80,000 kWh
in the commercial building. Hence the EPI was
calculated to be:
EPI= Annual energy consumption in kWh
Total built-up area
= 46,80,000 = 234 kWh/m
2
-yr
20,000
The above calculated EPI index produced is for a 24h
operating commercial building modelled in a
temperate zone.
The photovoltaic power generated is 89,076.537
kWh, with a power conversion loss of 4,453.83 kWh
providing efficiency of renewable energy efficiency
of 4.27 %. To achieve 3% renewable energy of the
Assessment of Building Integrated Photovoltaic Panels on Facades of Commercial Buildings with Respect to Energy Conservation Building
Code
151
total power consumption of the building (ECBC), a
comparative calculation is carried out based on the
modelled building; 59,453.91 kWh (59.45MW/h) of
photovoltaic power is generated (includes power
conversion loss). The active photovoltaic area
calculated is 450 m
2
on the southern façade.
3.2 Using PVGIS System (2.2)
Table 2 was formulated based on the outputs
produced by the PVGIS system. Each slope angle is
tested with different azimuth angles to identify the
optimal orientation for the panel integration. The
assessment also finds out the optimal tilt angle of the
panel when integrated in Bangalore. The most
efficient PV technology is further identified by
comparing yearly PV energy production(kWh),
Yearly PV energy production [kWh], Yearly in-plane
irradiation [kWh/m2], Year-to-year variability
[kWh], and the total loss (%).
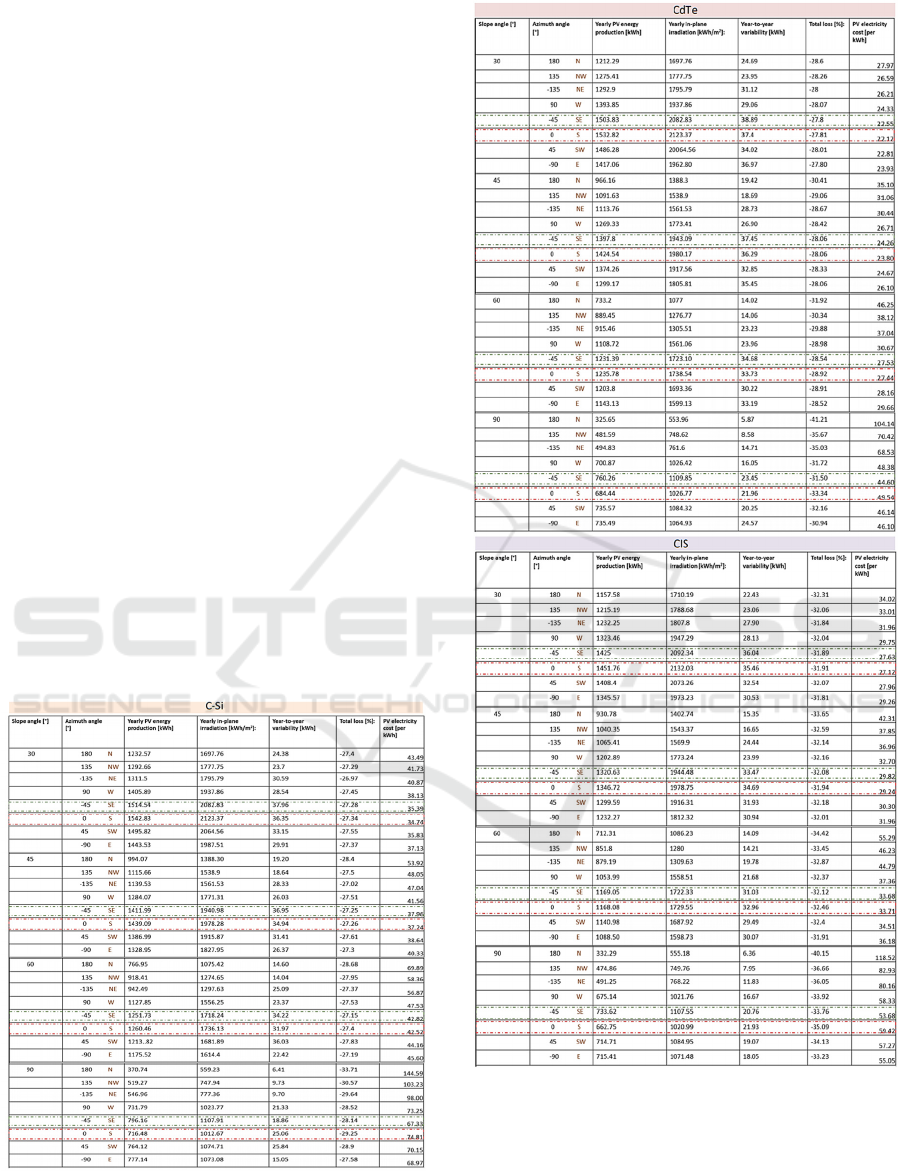
Table 2. shows the data collected for PV
technologies- C-Si, CdTe, CIS. Each technology is
assessed based on each tilt angle (30°,45°,60°, and
90°); each tilt angle is placed in different azimuth
angles (N/180°, NW/135°, NE/-135°, W/90°, SE/-
45°, S/0°, SW/45°, E/-90°) for the various PV
technology.
Table 2: Comparison of PV technologies based on energy
production, system loss, electricity cost, variability.
Analysis: PV technology- Crystalline Silicon
produces maximum yearly PV energy production
while compared to CdTe and CIS.
Orientation- The South and South-East provide
maximum yearly PV energy production (kWh) due to
high yearly in-plane irradiation (kWh/m
2
) and low
system loss (%).
SMARTGREENS 2021 - 10th International Conference on Smart Cities and Green ICT Systems
152
Optimal angle-The optimal angle is identified to
be 30 degrees with the highest annual PV energy
production (kWh).
Cost- The crystalline technology is the costliest
while compared to the CdTe and CIS technology but
has higher PV energy production and reduced system
loss.
- Summary of the above tabulated form (table 2)
is shown in fig. 5 and 6
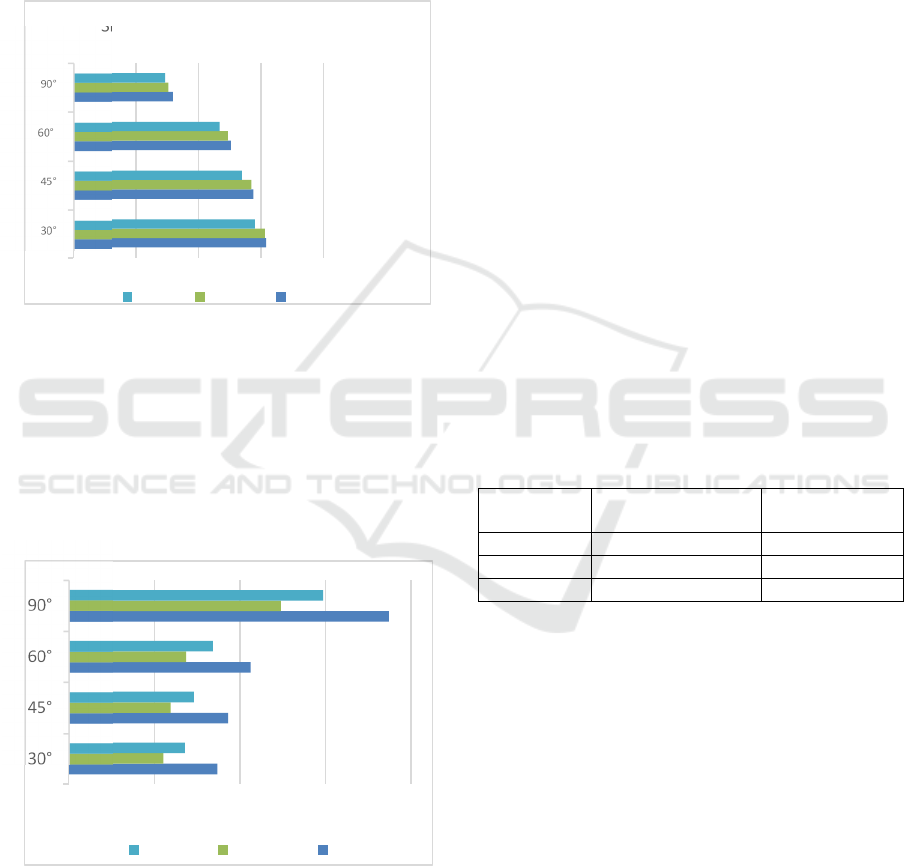
Figure 5: Graph showing a comparison between PV
technology, yearly energy production (kWh) and the PV tilt
angle.
The crystalline silicon PV technology has the highest
yearly PV energy production with an optimum tilt
angle of 30° followed by 45°,60° and 90°. The second
highest PV energy is produced by the CdTe
technology with an optimum angle of 30° and CIS has
the least energy production comparatively (fig.5).
Figure 6: Graph showing a comparison between PV
technology, price in INR and the PV tilt angle.
The crystalline silicon PV technology is the costliest
technology i.e. 34.74 INR/kWh, followed by CdTe -
22.12 INR/kWh and CIS-27.12 INR/kWh while
integrated at an optimum angle of 30° (fig.6).
3.3 Comparing Modelled Building in
Design Builder with PVGIS System
The modelled building (Design builder) 's total
energy production is 46,80,000 kWh, integrated on
the southern façade. A comparison between the
modelled building and the results achieved in the
PVGIS system is carried out to provide an
understanding with respect to the PV technology,
yearly PV energy production, and the cost incurred.
The comparison is carried on based on the most
suitable factors identified in Table 2, i.e., optimal tilt
angle 30 degrees is considered, and a comparison is
conducted for all the PV technologies (C-Si, CdTe &
CIS) based on the energy production, cost, etc.
The direct solar heat gain is noted to be five hours
per day i.e., 13:00 -18:00 IST, i.e., 5h x 365 =
1825h/year. The PV energy produced is 59,453.9
kWh/year by the modelled building; 38.8 kWp is
produced in Bangalore when installed on the
Southern side.
kWp x PV energy production = total energy
generated by the system,
Using the above formula, yearly PV energy
production is calculated considering the PV energy
production for C-Si:1542.83 kWh, CdTe:1532.82
kWh & CIS:1451.76kWh and the peak performance
to be 38.8kWp.
Table 3: Yearly PV energy production and panel cost.
PV
technolo
gy
Yearly PV energy
production (kWh)
Panel cost (INR)
C-Si 59,861.80 20,79,598.93
CdTe 59,473.41 13,15,551.83
CIS 56,328.28 15,27,622.95
Table 3-Considering the PV price based on the PV
technology (fig.6) i.e. C-Si -34.74 INR/kWh, Cdte-
22.12 INR/kWh and CIS-27.12 INR/kWh while
integrated at an optimum angle of 30°,the panel cost
is calculated for the yearly PV energy production
(kWh).
3.3.1 Payback Period
The amount of energy consumption resulted in
46,80,000 kWh in the commercial building with
59,453.9 kWh of PV energy produced yearly (3.1).
Considering C- Si PV technology from table 3 yearly
PV energy production results in 59,861.80 kWh with
BIPV panel cost of 20,79,598.93 INR (table 3). The
lifetime of the system is expected to be 25 years
according to the PVGIS tool. The cost per kWh
electricity in India is 5.43 INR (Jaganmohan, 2020),
1542
1439,09
1260,46
796,16
1532
1424,54
1235,78
760,26
1451,76
1346,72
1169,05
733,62
0 500 1000 1500 2000
30°
45°
60°
90°
SlopeanglevsPVenergyproduction
CIS Cdte C‐Si
34,74
37,24
42,52
74,81
22,12
23,8
27,44
49,54
27,12
29,24
33,71
59,42
0 20406080
30°
45°
60°
90°
PVpriceinrupees/kWh
SlopeanglevsPVcost
CIS Cdte C‐Si
Slopeangle(°)
Slopeangle(°)
Assessment of Building Integrated Photovoltaic Panels on Facades of Commercial Buildings with Respect to Energy Conservation Building
Code
153
for 59,861.80 kWh of PV energy produced would
result in savings equivalent to 3,25,049.57 INR
annually. Hence the payback period for the PV panel
cost is 6.4 years, the system is expected to function
with profit for the remaining 18.6 years (The system
losses projected consists of all the losses in the system
due to which the power distributed to the electricity
grid could be lesser than the power generated by the
PV modules. There are numerous reasons for this
loss, as the loss in the cables, dirt (snow at times) on
the modules, power inverters, etc. Over the years the
modules tend to lose their power over time, so the
average yearly output over the system's lifetime will
be a few percent lesser than the output in the initial
years which has been considered 14% in table 2).
Similarly, the payback period for the CdTe
technology with 59,473.41 kWh PV energy and panel
cost 13,15,551.83 INR, the electricity cost per annum
is equivalent to 3,22,940.61 INR yearly the payback
period will be 4.1 years and CIS technology with
56,328.28 kWh PV energy and panel cost
15,27,622.95, the electricity cost per annum is
equivalent to 1,94,332.56 INR yearly the payback
period will be 7.9 years.
3.4 Design Consideration for
Maximum Energy Production
using Google Sketchup(2.3)
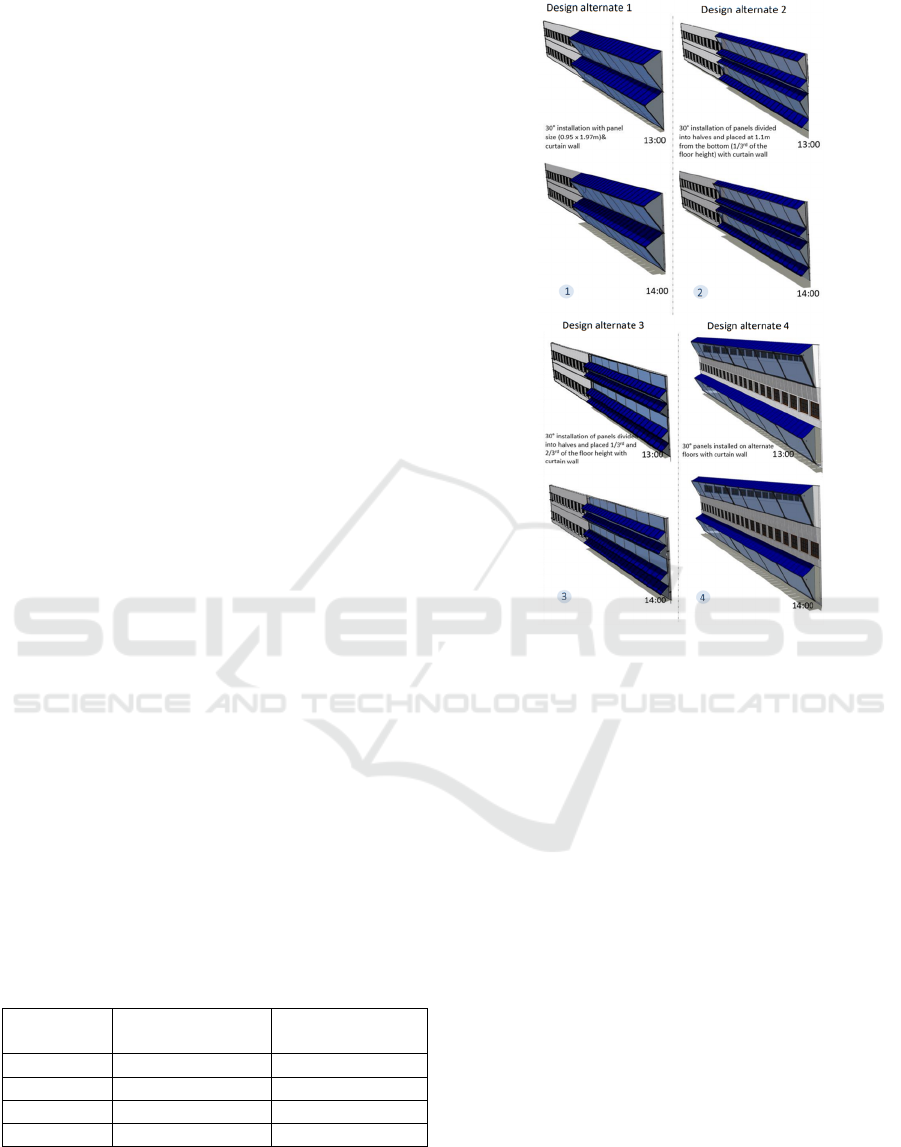
The design considerations are analyzed based on the
optimum angle, i.e., 30 degrees installed on the
southern façade (table 2). Various integration styles
on the façade are carried on. A shadow analysis is
carried out for panels integrated on the S façade in
Bangalore using Google Sketchup.
Shadow analysis: It is observed that the integrated
panels receive direct solar heat gain from 13:00 to
18:00 IST. Partial shadow is casted from 13:00 -14:30
IST (14:30 – 18:00 IST no shadow is observed).
Assuming that the shadow casted is solely by the
overlying panels (integration style).
Table 4: Shadow overcast on various integration style.
Integration
style
Overcast at
13:00 (in %)
Overcast at
14:00 (in%)
1 0.67 0.24
2 0.59 0.23
3 0.56 0.21
4 0.34 0.00
Figure 7: Illustration showing various styles 30-degree PV
panels can be integrated on the façade.
The table 4 shows the percentage of shadow casted on
the panels based on the integration style. Design
alternate 4 is identified to be the most suitable
integration style with minimal shadow casted i.e.,
0.34% which will lead to increased energy production
due to increased direct solar heat gain. Followed by
design alternate 3 design alternate 2 and design
alternate 1.
3.5 Daylight Simulation using VELUX
(2.4)
The daylight simulation carried out for the design
integration style modelled in Google Sketchup.
The Daylighting Factor (DF) is the ratio of the
light level inside the structure to the light level outside
the structure. It is defined as: DF = (Ei/Eo) x 100%.
The designate alternate 1,2,3 and 4 have
1%,0.79%,0.76% and 1.35% daylighting factor
ranging from 2.62-3.00.The daylighting factor
ranging from 2.62-3.00 design alternate four is
identified to be the most efficient, followed by design
alternate 1, design alternate two, and design alternate
SMARTGREENS 2021 - 10th International Conference on Smart Cities and Green ICT Systems
154
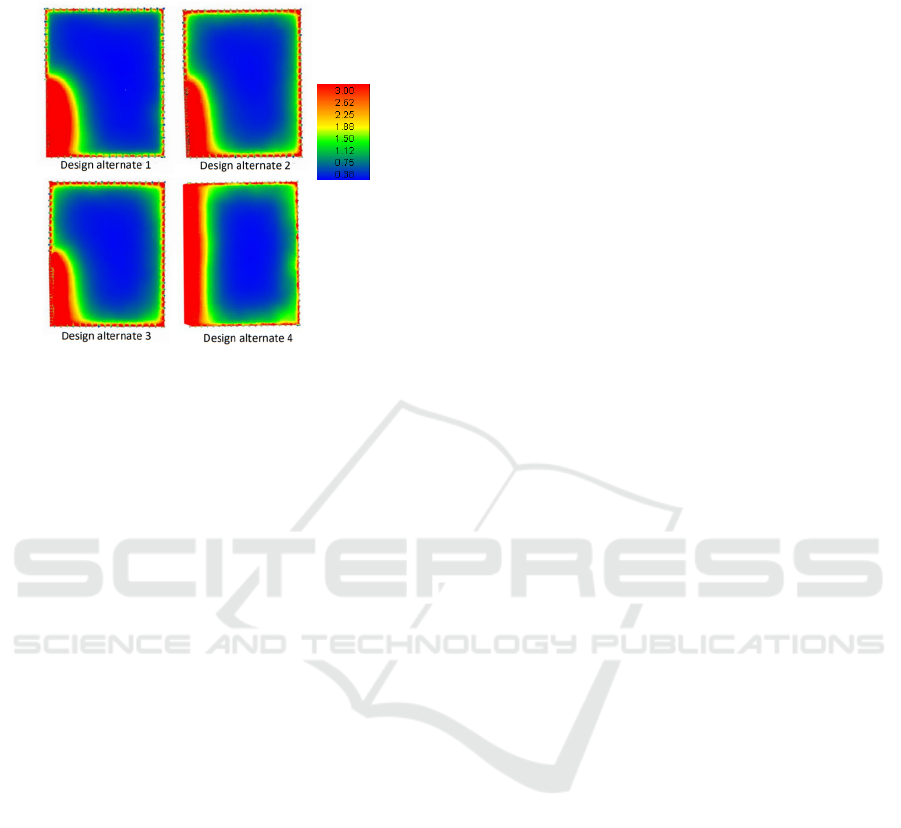
3. The daylighting factor assessment is restricted to
the region with BIPV panels.
Figure 8: Daylighting analysis conducted on various design
integration styles.
4 CONCLUSIONS
This study examined the ways to improve PV energy
production when integrated on a building façade. It
identifies the optimal combinations to be integrated
on the building façade to rigorously increase the PV
energy production. The analysis of adopting BIPV
panels in projects based on the optimal tilt angle,
orientation, payback period, integration style, etc.
The study conducted could be helpful to the
practitioners in the industry to understand the
working and advantages of the system and ways to
integrate the panels to generate maximum energy
production in Bangalore. A similar methodology can
be followed to study the performance of BIPV panels
in various parts of the world. The optimal PV
technology identified in this study is crystalline
silicon with annual energy production of 59,861.80
kWh in a 20,000 sq.m. commercial building,
integrated at an optimal angle of 30 degrees on the
southern façade for maximum solar heat gain and has
a payback period of 6.4 years. Further analysis can be
done in various places by following similar
methodology to enhance energy production using
BIPV panels installed on the façade and the large
spectrum of PV technology can be assessed by
conducting on-site or
laboratory experiments, since
using software tools have limited access to assess
various PV technology.
REFERENCES
Alice Bellazzi, L. B. (2018). Estimation of the performance
of a BIPV façade in working.
B.Winnettabc, G. P. (2012). Whole systems appraisal of a
UK building integrated photovoltaic (BIPV) system:
energy, environmental, and economic evaluations.
Energy Policy.
Badri Mohapatra, M. R. (2018). Analysis of daylighting
using daylight factor and luminance for different room
scenarios. International Journal of Civil Engineering
and Technology 9(10):949-960.
BaverAtlıf, E. M. (2017). A key review of building
integrated photovoltaic (BIPV) systems. Engineering
Science and Technology, an International Journal.
Bhambhani, A. (2019, April 01). Taiyang news. Retrieved
from http://taiyangnews.info/technology/building-
case-for-bipv-to-mass-production/
Daniel Tudor Cotfas, P. A. (2014). A Simple Method to
Increase the Amount of Energy Produced by the
Photovoltaic Panels. ENERGY CONSERVATION
BUILDING CODE. (2017).
Hall, S. (2014, September 8). Benefits of building
integrated photovoltaics. Retrieved from https://
www.reminetwork.com/articles/benefits-of-building-
integrated-photovoltaics/
Jaganmohan, M. (2020). Statista. (Energy & Environmental
Services) Retrieved from https://www.statista.com/
statistics/808201/india-cost-of-state-electricity-supply/
Joshi, M. (2018). High-rise Apartment Buildings as a
Sustainable Buildingtypology in the Indian
Subcontinent. International journal of Engineering
Sciences & Researchtechnology.
lHassanGholami, H. N.-E. (2019). Holistic Economic
Analysis of Building Integrated Photovoltaics (BIPV)
System: Case Studies Evaluation. Energy and Buildings.
MarcoCasini. (2016). Energy-generating glazing. Smart
Buildings.
Mayank Bhatnagar, J. M. (2019). Developement of
reference Building Models for India. Journal of
Building Engineering.
Sharma, A. K. (2017). Solar PV Facade for High-rise
Buildings in Mumbai.
Yilin Li a Zhi, Z. T. (2017). Simulation study of a naturally-
ventilated Photvolatic (PV) facade for high-rise
buildings.
Daylight
factor
Assessment of Building Integrated Photovoltaic Panels on Facades of Commercial Buildings with Respect to Energy Conservation Building
Code
155
