
Experimental Platform for Obtaining Electrical Resistance
of a Shape Memory Alloy Actuator
Wislayne Dayanne P. da Silva, Tony Carlos Moura Cavalcanti, Jaidilson J
´
o da Silva
a
and Angelo Perkusich
Department of Eletrical Engineer, Federal University of Campina Grande, Campina Grande, Paraiba, Brazil
Keywords:
Deformation, Electronic Instrumentation, Electrical Resistance, Shape Memory Alloy Actuator, Strain-Gauge.
Abstract:
Shape Memory Alloys (SMA) are unique metallic materials with the Shape Memory Effect (SME), which
refers to a material’s capacity to recover its original shape through temperature variation subjected to defor-
mations. These alloys are commonly used as actuators to control vibration, deformation, position and have
been used in several sectors in the last decades. Therefore, in order to enable a study about the behavior of
the electrical resistance of an SMA actuator and the deformation measurement using strain-gauge sensors, an
experiment is proposed in this work to be applied to the course of Electronic Instrumentation Laboratory of
Electrical Engineering Degree at the Federal University of Campina Grande, Brazil. We used an experimental
platform composed of a steel beam and an SMA actuator, and we also developed the necessary electronic
system and Human Machine Interface. The experiment consists of activating the actuator by applying electric
current and obtaining data corresponding to its electrical resistance and beam deformation. With the experi-
ment’s realization, the students will be able to draw the behavior curves and prepare a report with the analyses.
1 INTRODUCTION
Shape Memory Alloys (SMA) are metal alloys that,
when submitted to deformations, return to their orig-
inal shape after a thermal cycle. This effect is known
as the Shape Memory Effect (SME), and it was dis-
covered in 1963 by Willian J. Buehler from research
developed with nickel-titanium alloys (NiTi) at the
Naval Ordinance Laboratory (NOL) in Maryland,
USA. In the 1960s, SME was observed in other alloys
besides nickel-titanium, Cobalt (Co), and Iron (Fe).
The addition of these two elements allowed a reduc-
tion in the transformation temperatures of the alloys
(Lagoudas, 2008).
Later on, titanium-palladium (TiPd), titanium-
platinum (TiPt), and titanium-gold (TiAu) alloys were
used for high-temperature applications. However, it
was only in 1980 that SMA started to be used more
widely since the effect was better understood. Cur-
rently, SMA comprises a unique class of materials,
which presents the capacity to recover from the orig-
inal form when its temperature is increased and has
the characteristic of superelasticity. When increasing
the temperature, the form can be recovered from the
a
https://orcid.org/0000-0002-1273-7865
application of high loads, which cause high densities
of actuation energy (Lagoudas, 2008).
SMA actuators are widely used in sensing, impact
absorption, and vibration damping applications in this
context. Of the different industrial sectors that are ap-
plied, stand out: aerospace, automotive, biomedical,
dental, orthopedic, robotic, and oil.
Thus, in this work, we propose an experiment to
obtain an SMA wire actuator’s electrical resistance
behavior. Therefore, we developed an experimental
platform for which a mechanical structure was used,
composed of a steel beam and an SMA wire actuator.
Also, we developed an electronic system and a user
interface. The platform makes it possible to carry out
experiments to obtain the SMA’s electrical resistance
and measure the beam’s deformation caused by elec-
trical current application in the actuator.
The proposed experiment is to be applied in the
course of Electronic Instrumentation Laboratory of
the Electrical Engineering Degree at UFCG Brazil for
studies of sensors and actuators. The work’s main
motivation was the importance of carrying out experi-
ments in the laboratory as a learning tool in Engineer-
ing courses, allowing students to apply the concepts
presented in the classroom.
The rest of the paper is organized as follows. In
P. da Silva, W., Cavalcanti, T., Jó da Silva, J. and Perkusich, A.
Experimental Platform for Obtaining Electrical Resistance of a Shape Memory Alloy Actuator.
DOI: 10.5220/0010438203150322
In Proceedings of the 13th International Conference on Computer Supported Education (CSEDU 2021) - Volume 1, pages 315-322
ISBN: 978-989-758-502-9
Copyright
c
2021 by SCITEPRESS – Science and Technology Publications, Lda. All rights reserved
315
Section 2 we present the theoretical foundation. In
Section 3 we present the developed experimental plat-
form, and in Section 4 we describe the proposed ex-
periment. In Section 5 we present the results and dis-
cussions, and in Section 6 we present conclusions and
future work.
2 THEORETICAL FOUNDATION
This section presents the main concepts that underlie
this work: the fundamentals of SMA, the strain-gauge
sensors, and their use in deformation measurement.
2.1 Shape Memory Alloys
SME refers to a material’s ability to recover its orig-
inal shape, through temperature variation, after be-
ing submitted to mechanical deformation. This phe-
nomenon can be perceived in special metallic mate-
rials called Shape Memory Alloys (SMA) (Elahinia,
2016).
SMA has two distinct phases, each with specific
physical properties. These phases are named austen-
ite and martensite. Austenite normally presents a
cubic crystalline structure with a centered face or
body-centered at high temperatures. The martensite
phase can present a tetragonal, orthorhombic, or mon-
oclinic structure at low temperatures. In the marten-
site phase, the crystals can be oriented in different di-
rections; each direction is called a variant. The vari-
ants can have two directions of orientation: twinned
martensite and detwinned or reoriented martensite.
Self-accommodating variants form the first, and the
last has a variant that is dominant in the grouping
(Lagoudas, 2008).
The transformation from one phase to another can
occur directly or inversely. The direct transformation
refers to the change from the austenite to the marten-
site phase and occurs when cooling the SMA in the
absence of an applied load. In the reverse transforma-
tion, in turn, when heating the same SMA, the crys-
talline structure undergoes a reverse transformation,
returning from the martensite to austenite phase (Ku-
mar et al., 2020).
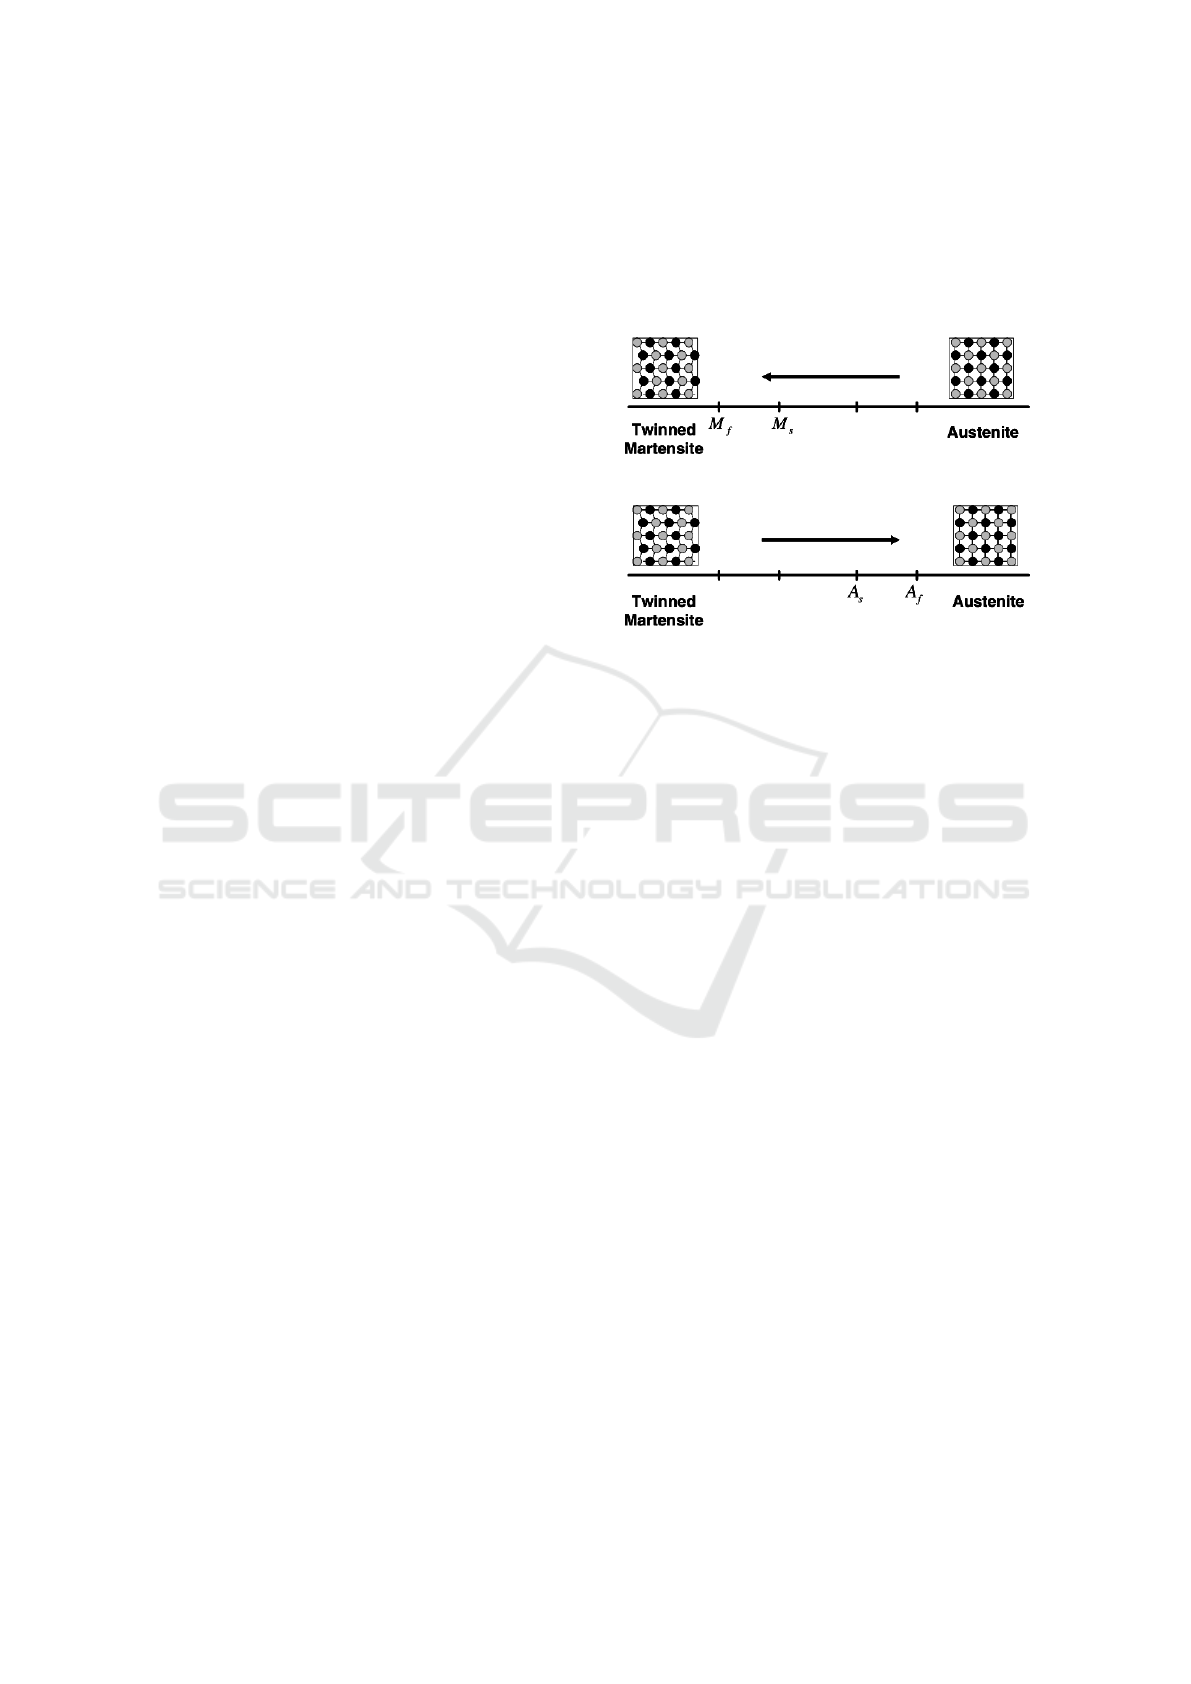
The transformations are shown in Figure 1, in
which the structures in the form of twinned marten-
site and austenite are presented. As can be seen, in
the direct transformation, without mechanical load,
the austenite phase begins the transformation to the
twined martensite phase at the initial temperature of
martensite (M
s
) and the transition is completed at the
final temperature of martensite (M
f
). At this tempera-
ture, the alloy will be completely transformed into the
twinned martensite form, thus completing the direct
transformation. When heating the alloy, the process
of reverse transformation begins at the initial temper-
ature of austenite (A
s
). Furthermore, the transition is
completed at the final temperature of austenite (A
f
).
Figure 1: Representation of the Phase Transformation of an
SMA (Lagoudas, 2008).
2.2 Deformation Measurement with
Strain-Gauge
The physical deformation of a material occurs
through the application of forces, which causes
changes and can be defined as the relation between
the variation in the length of a material and its orig-
inal length. A common type is flexion deformation,
which is caused by applying a linear force in the ver-
tical direction, resulting in a deformation of one side
of the material by contraction of the opposite side (In-
struments, 2019).
Deformation measurement is essential for the cor-
rect understanding of how a given object reacts to dif-
ferent applied forces. For this purpose, strain-gauge
sensors can be used, which are devices that vary their
electrical resistance when they undergo deformation.
They consist of a small grid formed by metal sheets
that can be fixed to the surface of a component or
structure to be measured, with a layer of adhesive that
serves to transmit the structure’s deformations to the
sensor.
The strain-gauge is capable of measuring small
deformations in the range of 0 to 50 µm/m with an ac-
curacy of ±0.15%, typically presenting nominal elec-
trical resistance of 120 Ω, 350 Ω and 1000 Ω.
The electrical resistance of a strain-gauge is mea-
sured using a Wheatstone Bridge circuit. A generic
Wheatstone Bridge, illustrated in Figure 2, consists
of a network formed by resistive arms and an excita-
tion voltage, V
EX
that is applied at the entrance to the
bridge.
CSEDU 2021 - 13th International Conference on Computer Supported Education
316
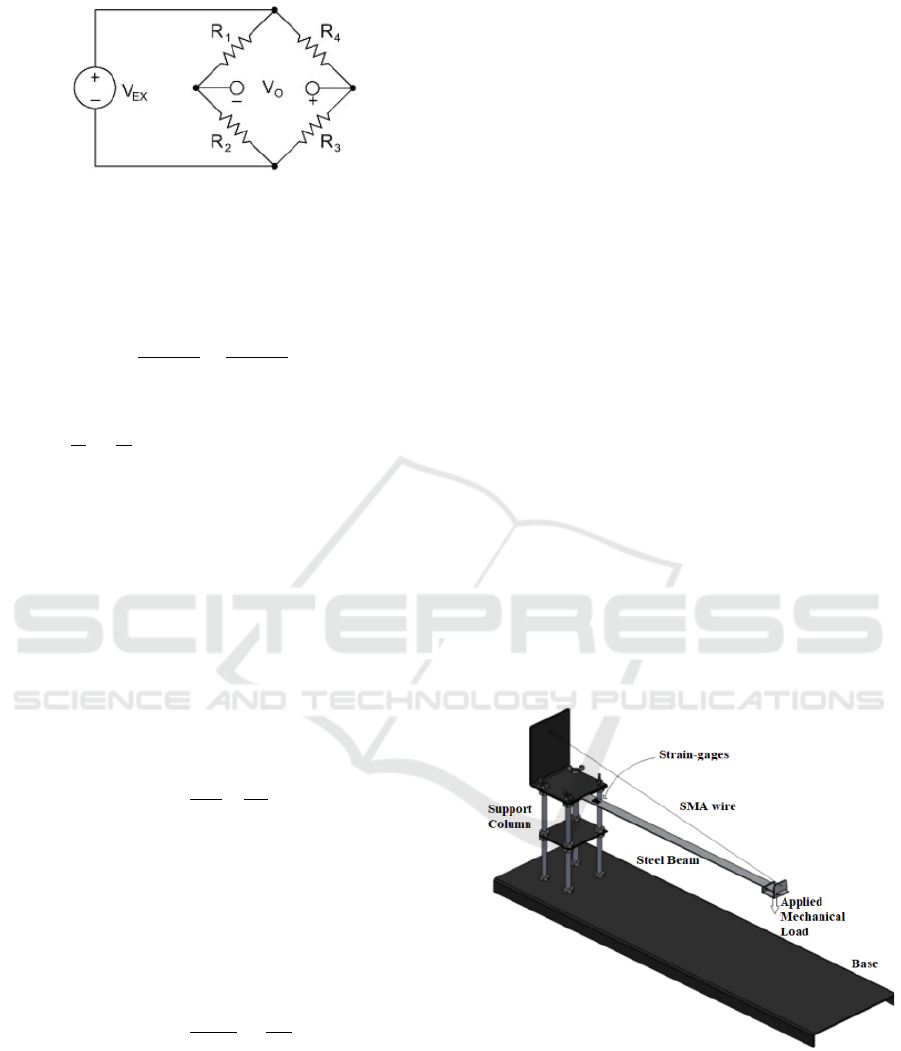
Figure 2: Wheatstone Bridge Circuit Diagram (National In-
struments, 2019).
Thus, the deformation ε of the device is proportional
to the output voltage of the circuit V
0
, as described by
Equation 1.
V
0
=
R
3
R
3
+ R
4
−
R
2
R
2
+ R
1
∗V
EX
(1)
In turn, the Wheatstone bridge is considered electron-
ically balanced, V
0
= 0, when it has the following re-
lations:
R
1
R
2
=
R
4
R
3
. Therefore, a variation in one of the
resistors (∆R) causes a change in the output voltage
value. For example, if replacing R4 with an active
strain gauge, any change in its resistance unbalances
the bridge and produces a nonzero output voltage,
which is a function of deformation (National Instru-
ments, 2019).
Depending on the application, it is possible to
have one, two, three, or four bridge elements whose
resistance varies depending on the measured physical
quantity. For the application presented in this work,
the resistance variation occurs in two opposing active
elements: two strain-gauge. Thus, the output voltage
at the bridge is given by:
V
0
=
V
EX
2
∆R
R
(2)
An essential parameter in the characterization of a
strain-gauge is the Gauge Factor (GF), which refers to
measuring the relative variation of the device’s elec-
trical resistance when it undergoes deformation. For
magnetic strain-gauges, this parameter is around 2.
The GF is calculated according to the relation pre-
sented in Equation 3.
GF =
∆R/R
∆L/L
=
∆R
R.ε
(3)
where: R is the electrical resistance, ∆R is the varia-
tion in resistance , L is the length of the strain-gauge,
∆L is the variation in length and ε is deformation.
3 EXPERIMENTAL PLATFORM
For the development of this work, an experimental
platform developed by (Lima et al., 2012) and opti-
mized by (Patriota et al., 2018) was used. This plat-
form has an SMA wire actuator fixed to the free end of
a beam so that in the initial condition, the beam is de-
formed by its own balance weight, thereby stretching
the actuator. An electric current is applied to activate
it, and when doing so, the SMA recovers the original
shape by heating by joule effect. Consequently, the
actuator applies sufficient force to the beam to return
it to the desired position.
For the proposed experiment, we used the plat-
form to analyze the electrical resistance behavior in
the SMA wire and the beam’s deformation by varying
the electric current in the actuator. Therefore, this sec-
tion will present the mechanical and electronic sys-
tems and HMI that make up the platform.
3.1 Mechanical System
Figure 3 illustrates the platform’s mechanical struc-
ture by the isometric view. It consists of a rectangular
iron base; a support column with a rectangular area; a
steel beam, with one end attached and the other free;
an SMA wire attached to the top of the support col-
umn and the free end of the beam; and a support for
possible application of external load weights.
Figure 3: Representation of the Mechanical System (Patri-
ota et al., 2018).
3.2 Eletronic System
The platform’s electronic system, adapted and imple-
mented for this work, consists of two strain-gauge
sensors, Wheatstone bridge and gain adjustment cir-
Experimental Platform for Obtaining Electrical Resistance of a Shape Memory Alloy Actuator
317
cuits, an SMA wire actuator, NI DAQ USB-6212
data acquisition system from National Instruments,
the current driver for actuating the SMA wire actu-
ator, and circuit for measuring the voltage in the ac-
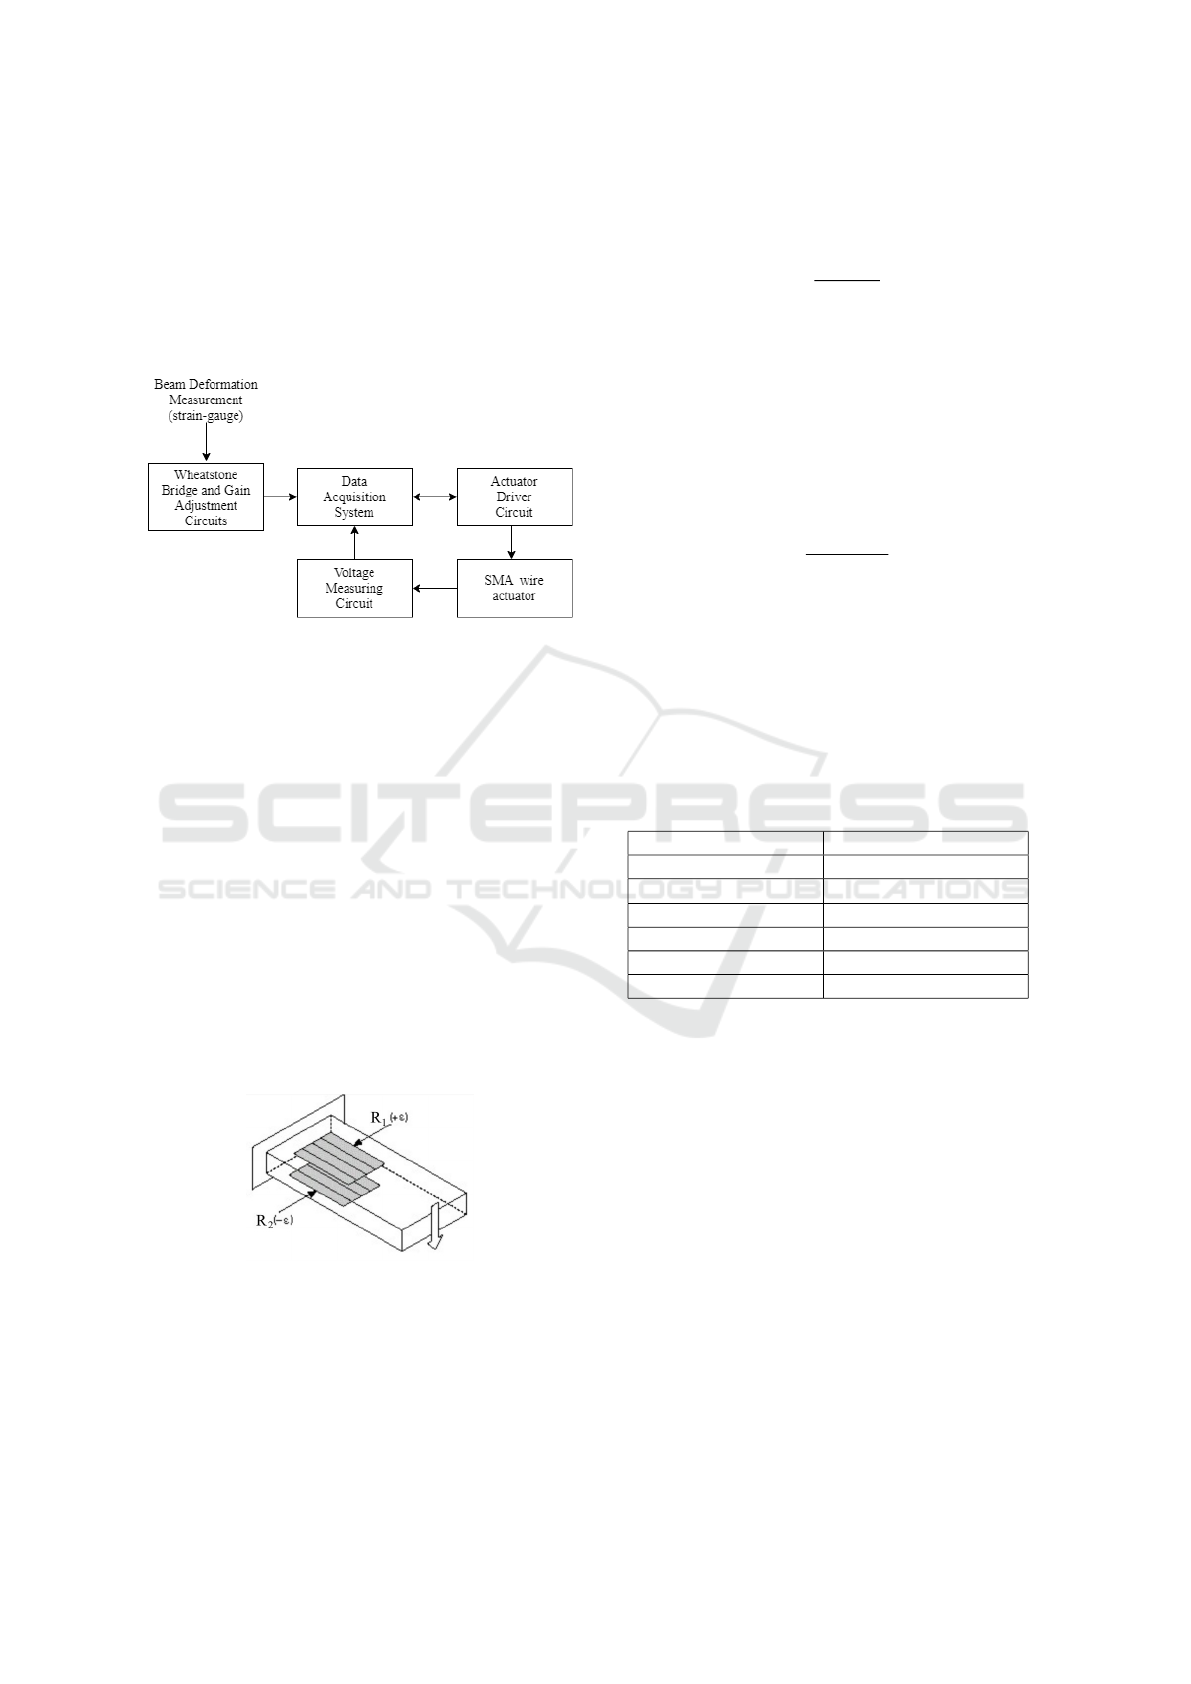
tuator. The block diagram of the electronic system is
shown in Figure 4, and each subsystem is described
as follows.
Figure 4: Electronic System Block Diagram.
3.2.1 Strain-Gauge and Wheatstone Bridge
At the fixed end of the beam, two strain-gauge were
fixed, one located at the top and the other at the bot-
tom, to measure the flexion deformation at that point.
The two strain-gauge were positioned at the same dis-
tance from the platform support column and under the
same axis to obtain a correct measurement. When one
strain-gauge is tensioned, the other is compressed fol-
lowing the same proportion so that the resistance vari-
ation of the two sensors has the same module, with
different signals, as shown in Figure 5.
The strain-gauge used are the model PA-06-125-
BA-350-LEN from Excel Sensors, of the collatable
type and recommended for steel surfaces. It has sim-
ple unidirectional resistance with a traditional shape
of 350 Ω and a gauge factor of 2.1.
Figure 5: Representation of the Deformation Measurement
Scheme Used. (National Instruments, 2019).
As the measurement of flexion deformation involves
the resistance variation of two opposing elements, a
Wheatstone bridge circuit was used in the half-bridge
configuration and the output voltage given by Equa-
tion 2. Performing the appropriate mathematical ma-
nipulations with Equations 3 and 2, Equation 4 was
obtained for the deformation.
ε =
2.V
0
V
EX
.GF
(4)
The variation in the resistance of the strain-gauge is
less than 1%. Therefore, as the bridge’s output volt-
age is directly proportional to this variation, it will
also be practically negligible. Thus, it is necessary to
apply a high gain (G) to amplify the value of V
0
and
enable the data acquisition board’s digital-analog con-
verter to carry out the signal acquisition. Therefore,
the acquired voltage is V
acquired
= G.V
0
. Rewriting
Equation 4 we get that:
ε =
2.V
acquired
V
EX
.GF.G
(5)
3.2.2 SMA Wire Actuator
The SMA wire used as an actuator is a NiTiNOL al-
loy of the type FLEXINOL TCF1140, manufactured
by Dynalloy, Inc. It has the two-way shape memory
effect and was thermomechanically trained by Patri-
ota (2018). According to the manufacturer manual, it
has the characteristics listed in Table 1.
Table 1: Features of SMA Wire Actuator.
Parameter Value
Diameter 0.2mm
Density 6,450 kg/m
3
Specific heat 837J/kg.K
Thermal conductivity 1,800W /(m.K)
Resistance 29Ω/m
Cooling time between 2.7s and 3.2 s
3.2.3 Data Acquisition System
We used the NI DAQ USB-6212 multifunctional de-
vice from National Instruments (see Figure 6) as the
data acquisition system (Instruments, 2009). The de-
vice performs the acquisition of the analog readings
and sends them to the LabVIEW software, in which
they will be processed and made available to the user.
It is also responsible for sending the activation com-
mands to the actuator driver.
3.2.4 Actuator Driver and Voltage Measurement
Circuits
The NI DAQ USB-6212 sends the SMA wire actua-
tor’s activation signal to the current driver input. The
driver receives a DC signal ranging from 250 mV a
5 V. The circuit is powered using a 12 V DC source,
CSEDU 2021 - 13th International Conference on Computer Supported Education
318

Figure 6: Image of the NI DAQ USB-6212 Data Acquisition
Device (National Instruments).
capable of supplying up to 1 A, sufficient current to
drive the actuator.
In order to measure the voltage on the SMA wire
actuator, was implemented a differential measure-
ment circuit. The circuit consists of two stages. The
first corresponds to the preamplifier with unit gain,
consisting of two voltage followers that isolate the in-
put voltage signals, thus increasing the circuit’s input
impedance. The second stage consists of a differential
amplifier designed to have a gain of 1/3.
3.3 Human Machine Interface
To allow the student to interact with the platform
system and visualize the process outputs numerically
and graphically, we developed a Human-Machine
Interface (HMI) using the LabVIEW software (an
acronym for Laboratory Virtual Instrument Engineer-
ing Workbench).
Figure 7 shows the front panel of the VI developed
in LabVIEW.
Figure 7: Representation of the HMI.
The developed software performs the acquisition of
the measurements corresponding to current and volt-
age in the SMA actuator and the acquired voltage
to calculate the beam deformation. These values are
mathematically treated to be displayed in the user in-
terface.
With the acquisition of the voltage value at the
output of the Wheatstone Bridge gain adjustment cir-
cuit, the deformation calculation is performed using
Equation 3. Furthermore, with the SMA’s voltage and
current values, the corresponding electrical resistance
value is calculated. According to the percentage of
DC voltage entered by the user, the SMA activation
signal is sent to an analog output of the DAQ NI USB-
6212. This sending is done using the DAQ Assistant
block, and the analog output is connected to the cur-
rent driver circuit.
The HMI also allows the student to select his class
and record a txt file with the measurements to analyze
later.
4 PROPOSED EXPERIMENT
In Engineering courses, the execution of experiments
in laboratories is an essential tool for student learning.
Specifically, for the Electrical Engineer training, it is
required to understand how the measurement systems
interact with the environment and provide informa-
tion, which can be treated and applied in solving the
most varied problems.
In this context, the course of Electronic Instru-
mentation Laboratory offered by the Electrical Engi-
neering Degree at UFCG, Brazil, addresses the con-
tent of great importance for the formation of the future
professional of Electrical Engineering, since it intro-
duces the basic techniques and the main methods to
perform measurements using sensors or transducers.
The course has activities in the laboratory, where stu-
dents perform practical experiments using experimen-
tal platforms and data acquisition systems. With that,
the student can analyze several types of conditioning
circuits and know the operation of different types of
sensors.
Thus, in this work, an experiment is proposed to
be applied to the Electronic Instrumentation Labora-
tory course to enable a study about the electrical be-
havior of SMA wire actuator and deformation mea-
surement using strain-gauge sensors. For this, the ex-
perimental platform presented in Section 3 is used.
Figure 8 shows a photograph of the mechanical and
electronic systems.
The proposed experiment consists of varying from
5% to 100% the actuator signal’s duty cycle value,
which is the percentage of the DC voltage signal ap-
Experimental Platform for Obtaining Electrical Resistance of a Shape Memory Alloy Actuator
319
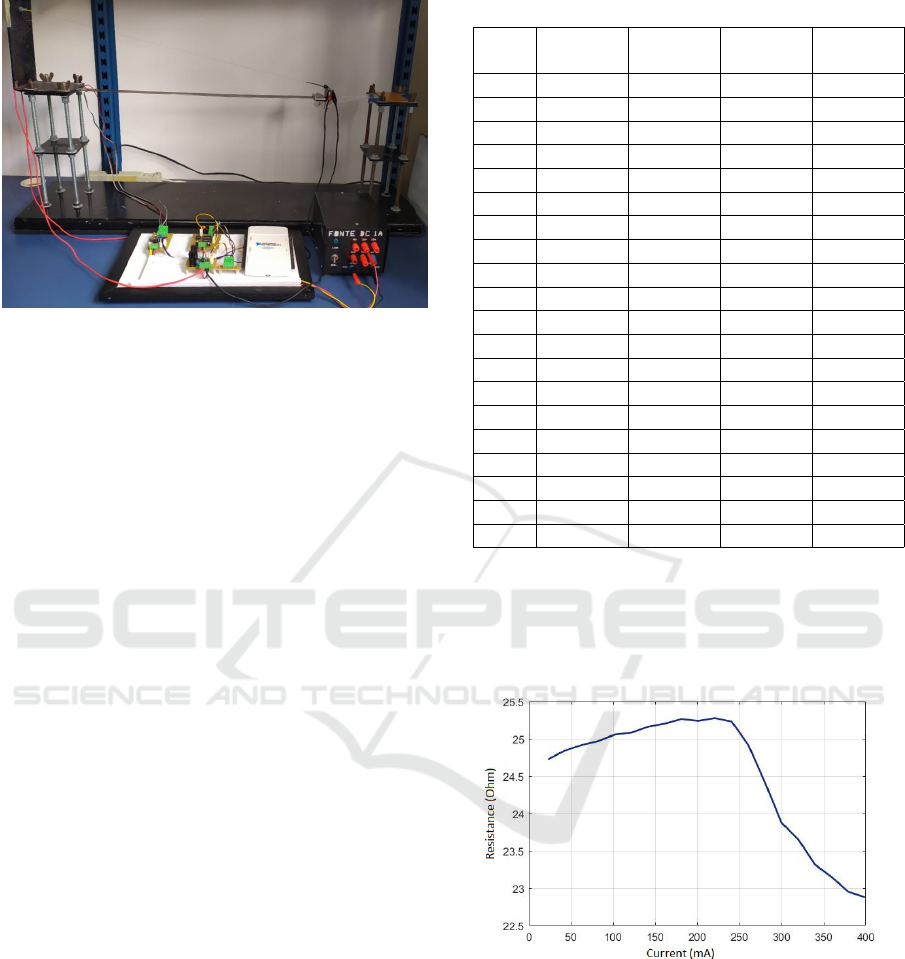
Figure 8: Experimental Platform Photography.
plied at the current driver input. The deformation,
current, voltage, and resistance values corresponding
to each measurement must be noted or saved in a txt
file using the ”Record Measurements” button present
on the HMI. However, it is necessary that before sav-
ing the data, the student must select his class.
When it reaches 100% of the actuator’s activation
signal, the experiment should be ended. With the data
collected, the student will be able to draw the Resis-
tance versus Current and Deformation versus Current
behavior curves and prepare a report with the results
and analyses achieved.
5 RESULTS AND DISCUSSIONS
Table 2 presents real measurement data using the de-
veloped system to exemplify the analyses that can be
performed with the proposed experiment. This table
is the values stored in the txt file for the twenty mea-
surements made during the experiment. The values
correspond to the measurements of beam deformation
(D), current (I), and voltage (V) measured in the SMA
and the resistance (R) calculated from the SMA.
The electrical resistance of an SMA sample in-
creases as the current increases until it reaches the
current value at which the phase transformation be-
gins. From that current value, the resistance starts to
decrease. Therefore, analyzing the last column of Ta-
ble 2, it can be seen that the resistance value changed
during the experiment, resulting in a variation of ap-
proximately 1.85 Ω. The resistance variation is di-
rectly related to the current applied to the alloy, so
an increase in resistance is observed as the current
increases, up to a current value of 240.63 mA. From
that value, the resistance starts to decrease with the in-
crease of the current. Thus, one can observe that the
phase transformation began when the current applied
Table 2: Experimental Data.
CT
(%)
D
(µm/m)
I (mA) V (V) R (Ω)
5 0.4064 23.0087 0.5689 24.7254
10 0.4099 42.7998 1.0631 24.8389
15 0.4264 62.5595 1.5586 24.9139
20 0.4488 82.3349 2.0558 24.9688
25 0.4653 102.1104 2.5584 25.0552
30 0.5194 121.9485 3.0586 25.0811
35 0.5548 141.6613 3.5643 25.1607
40 0.5830 161.4368 4.0686 25.2024
45 0.6125 181.2437 4.5791 25.2649
50 0.6831 201.0035 5.0735 25.2409
55 0.7149 220.8104 5.5814 25.2769
60 0.7561 240.6330 6.0715 25.2314
65 0.7773 260.4086 6.4891 24.9189
70 0.8021 280.2312 6.8421 24.4159
75 0.8480 299.9912 7.1618 23.8734
80 0.9834 319.7513 7.5629 23.6524
85 1.8831 339.5270 7.9162 23.3154
90 3.0784 359.2714 8.3166 23.1485
95 5.1204 379.0629 8.7003 22.9521
100 7.7866 398.9639 9.1261 22.8745
in the alloy is greater than 240 mA. Using the MAT-
LAB software, the resistance versus current curve was
constructed, which describer this behavior (see Fig-
ure 9).
Figure 9: Representation of Resistance versus Current Be-
havior.
To apply the experiment in the Electronic Instru-
mentation Laboratory course, the student may also
determine an approximate mathematical model that
best describes this behavior. The best approximation
found for the Resistance versus Current curve was a
tenth-degree polynomial for the results presented. As
described by Equation 6, in which f (x) corresponds
to resistance and x corresponds to current.
CSEDU 2021 - 13th International Conference on Computer Supported Education
320
f (x) = p1 ∗ x
10
+ p2 ∗ x
9
+ p3 ∗ x
8
+ p4 ∗ x
7
+ p5 ∗ x
6
+
p6 ∗ x
5
+ p7 ∗ x
4
+ p8 ∗ x
3
+ p9 ∗ x
2
+ p10 ∗ x + p11
(6)
where: p1 = 2.1572 ∗ 10
−22
; p2 = −4.0457 ∗ 10
−19
;
p3 = 3.1871 ∗ 10
−16
; p4 = −1.3718 ∗ 10
−13
; p5 =
3.5183 ∗ 10
−11
; p6 = −5.5046 ∗ 10
−09
; p7 = 5.1505 ∗
10
−07
; p8 = −2.6684 ∗ 10
−05
; p9 = 0.00059919; p10
= 0.004991; p11 = 24.504.
With this information, the polynomial approxima-
tion graph was plotted, shown in Figure 10.
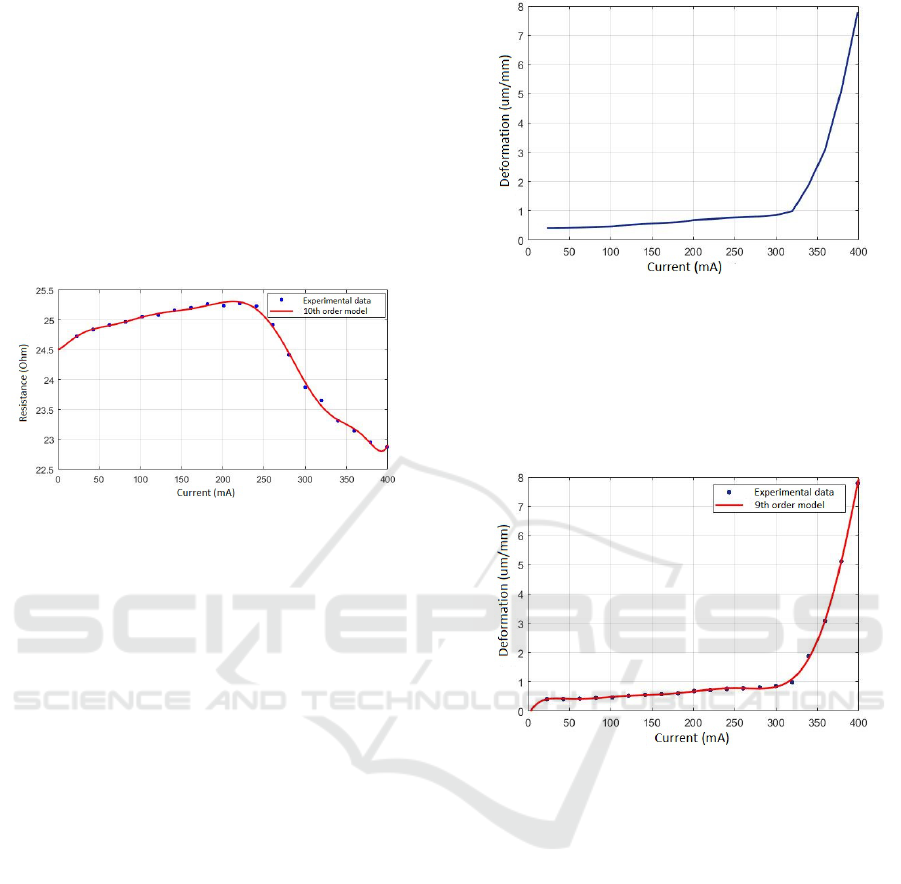
Figure 10: Representation of Resistance versus Current -
Approximate Model.
The analysis of the behavior of the electrical resis-
tance of an SMA is fundamental when we want to
use it as an actuator. This behavior can be considered
to study the performance criteria before implement-
ing the actuator. It is possible to determine the best
SMA operating region, analyzing which currents pro-
vide the phase transformation. Thus, one can choose
which type of SMA best attends to the needs of the
desired application.
Regarding the deformation measurement behavior
in the beam, we observed that when lower currents are
applied to the SMA actuator, not enough force was
applied to the beam to vary its position since the actu-
ator has not started to contract yet. Consequently, the
measurement of the strain-gauge in this range does
not show very significant variations. However, for
higher current values, above 300 mA, the alloy starts
to contract and has enough force to lift the beam from
the initial position. Thus, the deformation measure-
ment begins to increase according to the applied cur-
rent, as shown in Figure 11.
The best approximation of the deformation ver-
sus current behavior was a ninth degree polynomial,
which is described in Equation 7.
f (x) = p1∗x
9
+ p2∗x
8
+ p3∗x
7
+ p4∗x
6
+ p5∗x
5
+
p6 ∗ x
4
+ p7 ∗ x
3
+ p8 ∗ x
2
+ p9 ∗ x + p10 (7)
where: p1 = 6.1361∗10
−21
; p2 = −1.4801∗10
−17
; p3
= 1.4118 ∗ 10
−14
; p4 = −7.04 ∗ 10
−12
; p5 = 2.0258 ∗
Figure 11: Representation of Deformation versus Current
Behavior.
10
−09
; p6 = −3.4738 ∗ 10−07; p7 = 3.5114 ∗ 10
−05
;
p8 = −0.0019751; p9 = 0.055351; p10 = −0.1668.
With this information, the polynomial approxima-
tion graph was plotted, shown in Figure 12.
Figure 12: Representation of Deformation versus Current
Behavior - Approximate Model.
6 CONCLUSIONS
In this work, we present an experimental platform for
studying an SMA wire actuator. The platform allows
experiments to be executed to obtain the characteris-
tic of the SMA’s electrical resistance and deformation
of a beam. For this, we first described the concepts
and characteristics of the SMA and the strain-gauge
sensor. Then, we presented the main tools and proce-
dures performed to develop and use the experimental
platform. In this way, we explained the components
that make up the mechanical system, the electronic
system, and the HMI. After, the experiment proposal
was presented to be applied in the Electronic Instru-
mentation Laboratory course.
With the analysis of the results obtained experi-
mentally, we conclude that the platform satisfies the
Experimental Platform for Obtaining Electrical Resistance of a Shape Memory Alloy Actuator
321

requirements that it was intended to achieve. The
SMA resistance behavior analysis through the appli-
cation of current in the alloy is a study of great rele-
vance for using material as an actuator since it makes
it possible to determine the best operating region, ac-
cording to the phase transformation.
Besides, we found a relationship between the
SMA’s performance and the beam deformation, mea-
sured by strain-gauge sensors. We verified that when
low currents are applied to the SMA wire actuator,
not enough force is applied to the beam to vary its po-
sition. However, for higher current values, the alloy
starts to contract and consequently has enough force
to lift the beam from its initial position.
Thus, the proposed experiment can be used in the
Electronic Instrumentation Laboratory course to com-
plement the experiments carried out on sensors and
actuators.
We plan the use the experimental platform de-
veloped to investigate the phase transformation and
the SMA wire actuator hysteresis behavior during the
heating and cooling process. For this, we intend to es-
timate the SMA wire temperature from the electrical
parameters data resulting from the proposed experi-
ment.
ACKNOWLEDGEMENTS
The authors thank the support of the Coordenac¸
˜
ao
de Aperfeic¸oamento de Pessoal de N
´
ıvel Superior -
Brazil (CAPES), Electronic Instrumentation and Con-
trol Laboratory and Programa de P
´
os-Graduac¸
˜
ao em
Engenharia El
´
etrica (COPELE), UFCG.
REFERENCES
Elahinia, M. (2016). Shape Memory Alloy Actuators, vol-
ume 1. John Wiley & Sons, Ltd, Toledo, USA, 1st
edition.
Instruments, N. (2009). Specifications USB-6212. National
Instruments, Texas, USA.
Instruments, N. (2019). Measuring strain with strain gages.
http://www.ni.com/white-paper/3642/pt/.
Kumar, S., Shivashankar, P., and Gopalakrishnan, S. (2020).
A half a decade timeline of shape memory alloys in
modeling and applications. ISSS Journal of Micro and
Smart Systems, pages 1–32.
Lagoudas, D. C. (2008). Shape Memory Alloys -Modeling
and Engineering Applications. Springer, New York,
USA, 1st edition.
Lima, W. M., Ara
´
ujo, C. J. d., Valenzuela, W. A. V., and
Rocha Neto, J. S. d. (2012). Control of strain in a
flexible beam using ni-ti-cu shape memory alloy wire
actuators. Journal of the Brazilian Society of Mechan-
ical Sciences and Engineering, 34(SPE):413–422.
Patriota, A., Fernandes, E., Silva, J., and da Rocha Neto,
J. (2018). Deformation closed-loop control of a flex-
ible beam by means of a shape memory alloy. In
2018 IEEE International Instrumentation and Mea-
surement Technology Conference (I2MTC), pages 1–
6. IEEE.
CSEDU 2021 - 13th International Conference on Computer Supported Education
322
