
Lead Time Forecasting with Machine Learning Techniques for a
Pharmaceutical Supply Chain
Maiza Biazon de Oliveira
1 a
, Giorgio Zucchi
2,3 b
, Marco Lippi
4 c
, Douglas Farias Cordeiro
5 d
,
N
´
ubia Rosa da Silva
1,6 e
and Manuel Iori
4 f
1
Special Academic Engineering Unit, Department of Production Engineering, Federal University of Goi
´
as,
St. Dr. Lamartine Pinto de Avelar, 1120, 75704020, Catal
˜
ao, Goi
´
as, Brazil
2
Fondazione Marco Biagi, University of Modena and Reggio Emilia, Largo Marco Biagi 10, 41121 Modena, Italy
3
R&D Department, Coopservice S.Coop.p.A, Via Rochdale 5, 42122 Reggio Emilia, Italy
4
Dipartimento di Scienze e Metodi dell’Ingegneria, University of Modena and Reggio Emilia,
Via Amendola 2, Pad. Morselli, 42122 Reggio Emilia, Italy
5
Faculty of Information and Communication, Federal University of Goi
´
as, Campus Samambaia,
74690900, Goi
ˆ
ania, Goi
´
as, Brazil
6
Institute of Biotechnology, Federal University of Goi
´
as, St. Dr. Lamartine Pinto de Avelar,
1120, 75704020, Catal
˜
ao, Goi
´
as, Brazil
Keywords:
Lead Time Forecasting, Machine Learning, Pharmaceutical Supply Chain.
Abstract:
Purchasing lead time is the time elapsed between the moment in which an order for a good is sent to a supplier
and the moment in which the order is delivered to the company that requested it. Forecasting of purchasing
lead time is an essential task in the planning, management and control of industrial processes. It is of particular
importance in the context of pharmaceutical supply chain, where avoiding long waiting times is essential to
provide efficient healthcare services. The forecasting of lead times is, however, a very difficult task, due to
the complexity of the production processes and the significant heterogeneity in the data. In this paper, we use
machine learning regression algorithms to forecast purchasing lead times in a pharmaceutical supply chain,
using a real-world industrial database. We compare five algorithms, namely k-nearest neighbors, support
vector machines, random forests, linear regression and multilayer perceptrons. The support vector machines
approach obtained the best performance overall, with an average error lower than two days. The dataset used
in our experiments is made publicly available for future research.
1 INTRODUCTION
Long waiting times for service interventions are a
recurring feature in the health sector, especially for
public services. Clearly, timely treatments and drug
administrations are crucial factors for improving the
quality of healthcare services, and often also for
saving the lives of patients, mainly in emergen-
cies (Brown et al., 2016; Tetteh, 2019). The delay
for medical interventions, whether through medica-
tion, diagnosis or surgical procedures, can indeed ag-
a
https://orcid.org/0000-0002-8981-1314
b
https://orcid.org/0000-0002-5459-7290
c
https://orcid.org/0000-0002-9663-1071
d
https://orcid.org/0000-0002-5187-0036
e
https://orcid.org/0000-0003-1982-5144
f
https://orcid.org/0000-0003-2097-6572
gravate pathologies, given the possibility of deterio-
ration of health conditions over time. Longer wait-
ing times for medical intervention can increase read-
mission rates as well (Moscelli et al., 2016). Nowa-
days, this is even more crucial because of the recent
COVID-19 pandemic, which is causing an increase
in the number of pharmaceutical products urgently
required by the many patients affected by the dis-
ease (Harapan et al., 2020).
Among other factors, long waiting times for re-
ceiving medicines can be associated with delay in
the administrative packaging, logistic problems with
tracking and delivery (Haugh, 2014) and several other
factors that could be outside the control of patients
or healthcare professionals. Within this scenario, the
analysis and proposition of measures to reduce wait-
ing times for all possible related factors is important
in healthcare policy guidelines (Moscelli et al., 2016).
634
Biazon de Oliveira, M., Zucchi, G., Lippi, M., Cordeiro, D., Rosa da Silva, N. and Iori, M.
Lead Time Forecasting with Machine Learning Techniques for a Pharmaceutical Supply Chain.
DOI: 10.5220/0010434406340641
In Proceedings of the 23rd International Conference on Enterprise Information Systems (ICEIS 2021) - Volume 1, pages 634-641
ISBN: 978-989-758-509-8
Copyright
c
2021 by SCITEPRESS – Science and Technology Publications, Lda. All rights reserved

The availability of medicines in healthcare service
networks, pharmacies and hospitals is directly related
to the lead time of the supply chain (Tetteh, 2019).
Our work is motivated by the activity of a logistic
company, Coopservice group, that receives the phar-
maceutical products from the suppliers and then or-
ganizes the shipping, when needed, to the healthcare
facilities. To organize the service in the best possi-
ble way, it is crucial for the company to correctly
estimate the purchasing lead time, that is, the time
that is elapsed between the moment in which an or-
der for a good is sent to a supplier and the moment
in which the good is delivered to the company. Cor-
rectly forecasting this purchasing lead time (lead time
for short, in the following) in the supply chain of the
pharmaceutical sector is a crucial task, as it largely
affects the whole industrial process of the healthcare
services. In addition, proper estimation of lead time
is a critical parameter in the relationship between the
management process and the customer (Noori-Daryan
et al., 2019), being lead time one of the most impor-
tant performance indicators for the management of
manufacturing and service production processes (Kim
et al., 2014). Furthermore, accurate forecasting of
lead times can assist in optimizing the production pro-
cesses, by more accurately selecting the needed quan-
tities and thus shortening the overall production times
(Gyulai et al., 2018).
Besides, lead time prediction is a crucial aspect
to keep under control in the pharmaceutical supply
chain, because sometimes having the medicine avail-
able at the right time can save lives. Lead time fore-
casting could allow the pharmaceutical companies to
predict and to avoid possible out of stock, caused by
a supplier. Besides, based on the lead time, it is pos-
sible to evaluate the different suppliers and select the
best ones. In addition, with a good prediction it is
possible for the pharmaceutical companies to define
different level of security stock of the goods for each
month, making the procurement process leaner and
more cost effective.
However, lead time forecasting is an extremely
challenging task. In general, the estimation of lead
times from historical data has been a recurrent issue in
the literature since the 1960s, and even in recent years
some traditional systems simply obtain lead time by
computing average values based on historical data,
with the result of deficiencies in production planning
and control (Lingitz et al., 2018). The proposed ap-
proaches in this research field can be divided into con-
ventional methods and intelligent methods, with the
former not using artificial intelligence and the latter
exploiting data mining and machine learning. In both
cases, data used for experimental evaluation can be
real and/or simulated. In this research, we exploit in-
telligent methods, leaving conventional methods to an
analysis of the literature.
Recently, there have been significant advances in
this research field using artificial intelligence (Ioan-
nou and Dimitriou, 2012; Gyulai et al., 2018). This
process is mainly due to the growing availability of
large data collections in different fields of manufac-
turing, that can enable data-driven technologies such
as machine learning, data mining, knowledge discov-
ery in databases, and big data analytical tools (Fayyad
et al., 1996; Tsai et al., 2016; Frank et al., 2019;
Kabugo et al., 2020)). Nevertheless, most of the in-
telligent techniques used in recent research do not
make use of real data (
¨
Ozt
¨
urk et al., 2006), while us-
ing computer simulations to generate data and consid-
ering many simplifying assumptions for the internal
manufacturing process.
Given the limitations of the methods mentioned
so far, in this paper we aim to use intelligent meth-
ods to predict the delivery times of suppliers who
have to deliver the goods to a company that man-
ages the pharmaceutical supply-chain of hospitals. To
this aim, we compared five different machine learn-
ing regression approaches, namely: k-nearest neigh-
bors (KNN), support vector machines (SVM), ran-
dom forests (RF), linear regression (LR) and multi-
layer perceptrons (MLP).
The use of accurate lead time forecast can be
highly beneficial in the planning of both production
and logistic services in the pharmaceutical field. We
mention, to this regard, the work by (Gatica et al.,
2001), who studied stochastic aspects related to prod-
uct development and capacity planning in the phar-
maceutical sector, by proposing a multistage stochas-
tic programming approach, and that of (Kramer et al.,
2019), who proposed a metaheuristic algorithm for
the delivery of pharmaceutical products in the region
of Tuscany (operated by the Coopservice group). In
the former work, accurate prediction of the lead time
for purchasing the products could be used within the
what-if analysis, while in the latter work, accurate
predictions could be used to define the starting points
of the deliveries, as multiple depots are available, and
the possible use of temporary depots at the hospitals,
so as to reduce transportation costs and times.
The reminder of the paper is organized as follows.
In Section 2 we present the related works and com-
pare our work with the literature. In Section 3 we
briefly present the classic techniques that we used to
predict the lead time. In Section 4 we describe the
dataset used in the experiments, which are illustrated
in Section 5. Finally, Section 6 concludes.
Lead Time Forecasting with Machine Learning Techniques for a Pharmaceutical Supply Chain
635

2 RELATED WORKS
In an Industry 4.0 scenario, big data analytics can be
divided into five different categories: predictive, de-
scriptive, inquisitive, preventive and prescriptive an-
alytics. Predictive analytics aims to anticipate what
will happen in the future: descriptive analytics in-
stead provides information and explanations about
what has happened; inquisitive analytics tries to an-
swer why it has happened, and preventive analytics
provides insight to understand what is necessary to be
done. Finally, prescriptive analytics provides infor-
mation for decision-making (Sivarajah et al., 2017;
Cabrera-S
´
anchez and Villarejo-Ramos, 2020). Big
data analytics is very often associated with artificial
intelligence, data mining, and machine learning in-
struments (Dean, 2014), with the aim to develop sys-
tems that can automatically extract information and
discovery patterns in large data collections (Lu et al.,
2015; Kuo et al., 2018), so as to provide beneficial
insights to decision makers (Chamikara et al., 2020).
By mid-1980s, many studies on operating and lead
time estimation through mathematical formulations,
as well as statistical methods with analysis of variance
(ANOVA) were proposed (Chang, 1997; Tatsiopou-
los and Kingsman, 1983). Forecasting through math-
ematical modeling approaches has also been recently
proposed for a custom system disregarding the current
system workload (Vandaele et al., 2002). In a more
complex product development scenario, a heuristic
approach was proposed, by explicitly modeling net-
works of operating system activities (Jun et al., 2006).
Other research has proposed the use of queuing net-
works for lead time analysis and prediction (Ioannou
and Dimitriou, 2012; Berling and Farvid, 2014) with
the use of discrete event simulation through mathe-
matical expressions, assuming a continuous demand
and studying the variance of the lead time. Con-
versely, a case-based reasoning approach was pro-
posed in (Mourtzis et al., 2014) to predict the lead
time of complex engineered-to-order products. (Pfeif-
fer et al., 2016) made use of multivariate regression
statistical methods using simulated data to obtain the
production lead time of a flow-shop system.
Mathematical and statistical formulas were refor-
mulated and proposed for production lead time esti-
mates in chemical sector modular production plants
(Sievers et al., 2017). However, the main disadvan-
tage of all the methods cited so far is that they con-
sider that past trends could possibly be repeated in the
future (
¨
Ozt
¨
urk et al., 2006; Ioannou and Dimitriou,
2012). Moreover, there are few researches evaluating
the interactions of supply chain elements such as lead
times and forecasting procedures (Sievers et al., 2017;
Hosoda and Disney, 2018; Lingitz et al., 2018; Golt-
sos et al., 2019). Additionally, databases generated
by simulation often consider a perfect production sys-
tem, without introducing machine breakdowns, main-
tenance downtime and raw material delays (Lingitz
et al., 2018). When performing lead time analysis
and forecasting, it is important to consider external
factors too, such as relationships and interactions be-
tween different supply chains (Hosoda and Disney,
2018; Ponte et al., 2018; Goltsos et al., 2019; Noori-
Daryan et al., 2019). (Chung et al., 2018) showed
that lead time prediction is a key factor because the
lead time uncertainties can affect service level and or-
der lead time performance. Understanding these dy-
namics allows companies to reduce their exposure to
different types of delivery risk and to better manage
their supply chain.
Despite the large amount of works in this area,
we could not find comprehensive studies on machine
learning algorithms for lead time forecasting in the
field of pharmaceutical distributions. Related works
are limited to the use of Monte Carlo simulation to
predict the production lead time (Eberle et al., 2014),
and to the proposal of cyclic production plans com-
bined with outsourcing in the packaging of medicines
in the Netherlands (Strijbosch et al., 2002). With this
paper we aim at filling this research gap.
3 METHODOLOGY
As already stated in Section 1, we employ a machine
learning approach for purchasing lead time forecast-
ing of pharmaceutical services. We formulate the task
as a regression problem, where the aim is to predict
a single real number y ∈ R as a function of a set of
features x ∈ R
d
. Supervised machine learning ap-
proaches are able to learn a function f that computes
a value ˆy from a given input vector ˆx. Such a function
is learned from a dataset D, which consists of a col-
lection of N pairs (x
i
, y
i
) where each input example
x
i
is associated with the corresponding target y
i
, that
is the target of the forecasting system. In this work,
we compare several simple, classic regression algo-
rithms, largely used in statistics and machine learn-
ing applications, with the aim of finding the one that
performs the best on our real-world data set, without
resorting to more sophisticated approaches. We com-
pare two efficient linear methods, namely linear re-
gression and linear support vector machines, against
three simple non-linear ones, namely random forests,
k-nearest neighbors, and multi-layer perceptron. We
leave the use of more advanced machine learning ap-
proaches for future research.
ICEIS 2021 - 23rd International Conference on Enterprise Information Systems
636

3.1 Linear Regression
Linear regression (LR) is a widely employed paramet-
ric regression technique (Montgomery et al., 2012),
where function f is computed as a linear combination
of input features: f (x) = β
T
x + β
0
. The vector of pa-
rameters β is typically learned by minimizing the sum
of squared errors on the training set. Clearly, this ap-
proach achieves good results when a linear function
results to be a reasonable approximation of the de-
pendency relation holding between input and output
variables, while suffering when such dependency is
strongly non-linear.
3.2 Linear Support Vector Machines
Support vector machines (SVM) are a classic machine
learning approach that can be used both for classifica-
tion and for regression. In the regression setting, the
goal is to find a function f for which the forecasting
error with respect to target y is at most equal to a pre-
defined tolerance threshold ε for the elements in the
training set (Drucker et al., 1997). In its linear formu-
lation, which is the one we employ in this paper, the
function to be learned is still a linear combination of
the features. The optimal (or close to optimal) param-
eters are found by heuristically solving a constrained
quadratic optimization problem (Albers et al., 2011).
3.3 Random Forests
A random forest (RF) is an ensemble classifier that
consists in a collection of n different decision trees
(Breiman et al., 1984). A decision tree is an inter-
pretable classifier that inductively learns classification
rules by testing the informativeness of the attributes
(features) with respect to the category (in case of clas-
sification) or the target value (in case of regression) to
be predicted. Several different decision trees can be
obtained either considering different sets of features,
or by subsampling different sets of training examples.
In the regression setting, the output prediction of the
RF is computed as the average of the predictions of
individual trees.
3.4 k-Nearest Neighbors
Based on the concept of distance (or similarity) be-
tween examples, k-nearest neighbors (KNN) is not
properly a learning algorithm. Given a test exam-
ple x, the KNN algorithm looks for the k examples
in the training set that are the most similar to x, i.e.,
the nearest ones according to a given metric, such as
the Euclidean distance, which we use in our experi-
mental evaluation. Once the k nearest neighbors are
found, the algorithm computes the prediction as an
average, or voting procedure, among them. In a re-
gression setting, the predicted target value ˆy is simply
computed as the weighted average of the targets y
j
of
all k neighbors.
3.5 Multi-Layer Perceptron
A multi-layer perceptron (MLP) is a very simple ar-
tificial neural network that can learn non-linear func-
tions between input and output variables (Rumelhart
and McClelland, 1987). An MLP consists in a stack
of layers, each consisting of a certain number m of
neurons. The first layer consists of input variables.
In the second layer, named hidden layer, the output
of each neuron is computed as a non-linear combina-
tion of input variables, whose weights are learned dur-
ing a training phase. Finally, the last layer computes
the output of the network as a non-linear combina-
tion of the output of the hidden neurons, again with
adjustable, learnable weights.
4 DATASET
A crucial ingredient of any machine learning applica-
tion is the preparation of the dataset used for training
and evaluation (Ristoski and Paulheim, 2016). The
database used in this research was made available
by an integrated service company, the Coopservice
Group. Founded in 1992, the Coopservice Group pro-
vides specialised services to private companies and
public entities. The Group operates worldwide, with
its headquarters in Italy, and counts around 20,000
employees. It offers a variety of facility services, es-
pecially the ones that are not part of the core busi-
nesses of the clients, including: industrial, commer-
cial and healthcare cleaning; management and main-
tenance of buildings and systems; management of en-
ergy supplies; security and surveillance; transport and
handling of goods; industrial and commercial mov-
ing; collection and transport of special waste. With
18 logistic warehouses and a storage area of over
150,000 squared meters, Coopservice Group is the
leader in healthcare and pharmaceutical logistics in
Italy, and a key provider of management and distri-
bution services for pharmaceuticals, medical-surgical
devices and non-medical consumables. The key as-
pects for the services are relying on a large workforce,
working at client-sites, maintaining consistent quality
and monitoring performance.
Forecasting lead times is a crucial task for
Lead Time Forecasting with Machine Learning Techniques for a Pharmaceutical Supply Chain
637
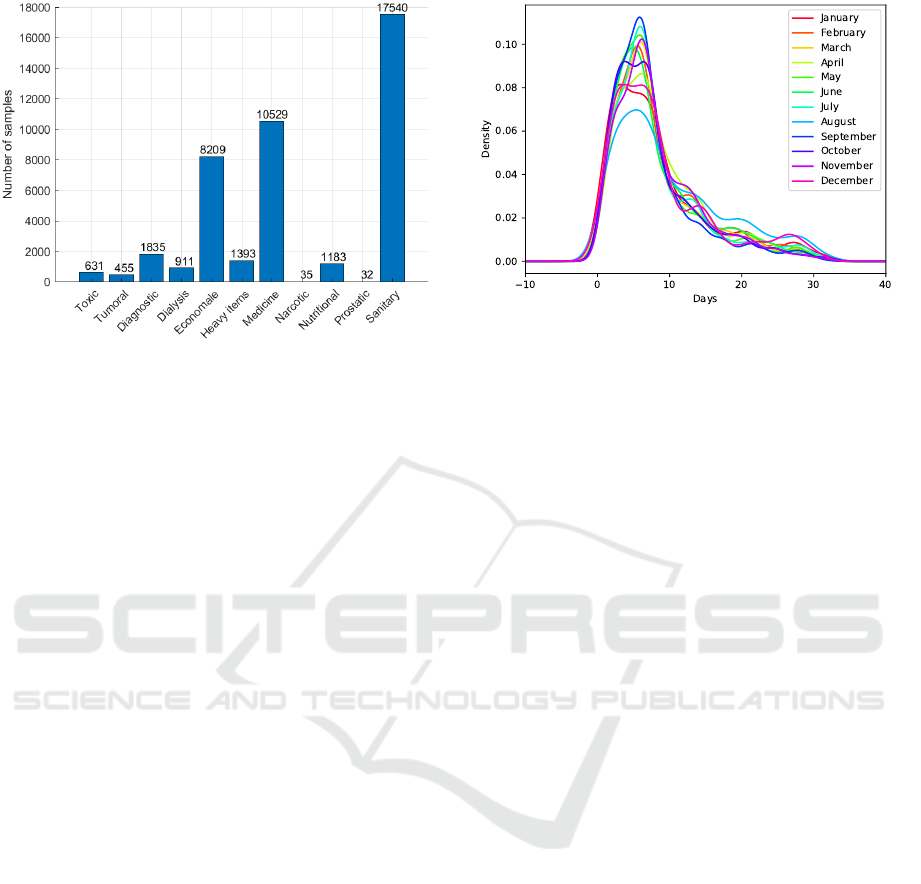
Figure 1: Distribution of the number of samples in the
dataset, for each different category.
Coopservice, because with an accurate prediction it is
possible to optimize and manage the scheduling of the
truck deliveries, as well as predict the unloading pro-
cess schedule for the inbound area. Thanks to this, it
is possible to better organize the shifts of the employ-
ees in the warehouse. In addition, lead time prediction
allows the company to have a better knowledge of the
supplier and to evaluate its performance. In order to
do this, a supplier rating system can be created, con-
sidering the historical data and the prediction. Finally,
with an accurate forecasting of lead times, the man-
agement of safety stock in the warehouse can be safer,
avoiding negative events like overstock and stockout.
In the pharmaceutical database provided by
Coopservice, the total number of samples was 42,753
collected during 2018.
All pharmaceutical products in the database are
associated with some specific categories, namely: tu-
moral, diagnostic, medicine, nutritional, prostatic,
sanitary, dialysis, heavy items, toxic, narcotic, and
economale (that are all the non-medical items like
pens, papers...). All these categories were used in our
study, although most of the data belong to economale,
medicine, or sanitary categories, as shown in Figure 1.
For each sample in the database, eight indepen-
dent variables were considered as the input vector x
for our machine learning systems used to forecast lead
times:
• day of the month of the customer order (1 to 31);
• weekday of the customer order (1 to 5, from Mon-
day to Friday);
• month (1 to 12) of the customer order;
• supplier code identifier;
• product name identifier;
• pharmaceutical product type category;
Figure 2: Lead time distribution, as a function of the month.
• ordered quantity (pills);
• distance between supplier and the pharmacy ware-
house (km).
A standard pre-processing phase was applied to the
database, including explorative data visualization,
cleaning and removal of duplicates and corrupted
data, outlier detection, manipulation of missing val-
ues (Ristoski and Paulheim, 2016). In particular, we
used boxplots to identify outliers and extreme values
(Hu et al., 2018; Sagaert et al., 2019) to remove cor-
rupted data. Figure 2 shows the distribution of the
lead time for each month. It can be noticed that the
trend is quite similar for all the months, with a peak
between 3 and 7 days, and very few values exceed-
ing 32 days. After a detailed analysis of the cases
with such a large lead time, we noticed they were
due to insertion errors in the original database, and
hence we discarded them. Overall, around 5% of data
were removed following the whole pre-processing
and cleaning procedure. The resulting dataset is avail-
able for research at https://github.com/regor-unimore/
Pharmaceutical-Lead-Time-Forecasting.git.
5 EXPERIMENTAL RESULTS
To compare the machine learning systems employed
in our analysis, we performed two different experi-
ments, splitting the whole corpus by category, as well
as by month.
Initially, in order to select the best hyper-
parameters of each algorithm, we employed a stan-
dard 10-fold cross-validation procedure, where the
whole dataset is partitioned into 10 different groups,
named folds. In turn, each fold is considered as test
set, whereas the remaining folds were split into 2/3
for the training set, and 1/3 for the validation set.
The training set is the set of examples used during
ICEIS 2021 - 23rd International Conference on Enterprise Information Systems
638

the learning phase to find the optimal model parame-
ters, whereas the validation set is the set of examples
that is employed to evaluate the performance of the
learned model. In this way, we selected the following
hyper-parameters for our machine learning systems:
100 estimators (i.e., number of trees) for the RF, lin-
ear kernel and a regularization term C = 1 for SVM,
a value of k=13 for the number of neighbors in KNN,
and a single hidden layer with 3 neurons for MLP.
Then, we performed two distinct experiments. As
a first experiment, we partitioned the dataset by cat-
egory, and we split each portion into 2/3 to be used
for training, and 1/3 to be used for test. As a sec-
ond experiment, we partitioned the dataset by month,
and again we split the data of each month into 2/3 for
training, and 1/3 for test. In both experiments, as a
standard performance metric, we considered the mean
squared error (MSE) as the average of the squared dif-
ference between true and predicted lead time: MSE =
∑
n
i=1
(y
i
− ˆy
i
)
2
where y
i
is the true lead time, and ˆy
i
is
the forecast value.
The two experiments have different goals. In the
first case, one full year of data for each category is
used both for training and for test, thus we can eval-
uate the performance of a forecasting approach when
a long period of data is available, for each single cat-
egory. Conversely, in the second experiment, we take
into account all the categories, by partitioning the data
by month: in this way, we can evaluate whether data
from different categories can help in forecasting the
lead times of each product.
As for the first experiment, in Table 1 we report
the performance achieved by all the competitors on
each distinct category. The results show that LR is
the best performing method. A very similar perfor-
mance is also obtained by the SVM approach, that
achieves the lowest error in two categories (Tumors
and Medicine). Narcotics results to be the most diffi-
cult category to forecast, which is not surprising, as it
contains very few examples. For that category, KNN
is the best-performing algorithm.
In our second setting, the samples of all the cate-
gories are used within the training and test set of each
month. As shown in Table 2, in this case SVM is
clearly the best performing algorithm, achieving the
lowest MSE in every month, with an average error
equal to 1.89 days, which is largely better than the
second best approach, which is RF, that achieves an
MSE equal to 3.07 days only. Overall, the results
of both settings suggest that the use of non-linear ap-
proaches does not significantly lower the forecasting
error.
Table 1: Mean squared error obtained per each different cat-
egory (best results in bold).
KNN LR RF MLP SVM
Tumors 3.37 2.23 2.39 3.87 1.94
Diagnosis 4.98 2.37 3.40 7.41 2.51
General 4.59 2.22 3.48 8.12 2.30
Medicine 4.10 2.22 2.71 5.51 2.02
Nutritional 2.90 2.21 2.28 4.60 2.28
Prostatic 3.11 1.75 3.07 3.15 3.38
Sanitary 3.11 2.22 2.49 6.98 2.30
Dialysis 3.23 1.50 2.49 2.34 1.83
Heavy Goods 2.66 1.79 2.40 5.40 1.86
Toxic 3.73 1.70 2.68 2.03 1.73
Narcotics 3.72 5.16 5.44 4.29 4.81
Average 3.59 2.31 2.99 4.88 2.45
Table 2: Mean squared error obtained per each different
month (best results in bold).
KNN LR RF MLP SVM
January 3.43 5.13 2.62 5.60 1.86
February 2.77 4.20 2.05 5.46 1.58
March 3.88 2.83 6.14 6.94 1.80
April 3.96 9.51 2.94 8.03 1.87
May 3.57 5.74 2.54 7.69 1.55
June 3.79 5.91 2.71 7.01 1.58
July 3.84 2.69 3.00 8.75 2.09
August 4.01 2.43 3.15 13.47 2.02
September 3.49 5.47 2.55 6.44 1.55
October 3.87 2.36 2.95 7.36 1.76
November 3.91 2.72 2.95 6.95 2.21
December 4.09 7.01 3.25 10.33 2.86
Average 3.72 4.67 3.07 7.84 1.89
6 CONCLUSIONS
This paper presented a methodology for lead time
forecasting in the pharmaceutical supply chain with
machine learning techniques. In particular, we com-
pared support vector machines, random forests, multi-
layer perceptron, linear regression, and k-nearest
neighbors on a very large collection of examples pro-
vided by a large company with headquarters in Italy.
Our experimental results are very encouraging, show-
ing how the purchasing lead time can be forecast with
high accuracy, especially for linear support vector re-
gression. In particular, the use of simple non-linear
approaches does not seem to yield significant im-
provements in the forecasting.
The research described in this paper aims to fill
a gap in the scientific literature regarding lead time
forecasting for the purchase of pharmaceutical prod-
ucts. An accurate forecast of such lead time can
be crucial for decision making, optimization, and
planning in the overall pharmaceutical supply chain.
Waiting times for drugs and medicines could in fact be
reduced, and hospitals and pharmacies could choose
Lead Time Forecasting with Machine Learning Techniques for a Pharmaceutical Supply Chain
639

the most convenient supplier at every moment on the
basis of accurate predictions. This can be very rele-
vant when treating patients with urgent needs, as well
is fast-changing medical conditions, as the ones we
are currently facing in the COVID-19 pandemic.
Future research will incorporate forecasting of in-
ternal supply chain lead times of real service pro-
cesses. In this way, the forecast of lead time for pur-
chasing products will be coupled with the forecast of
the entire supply chain lead time, providing decision
makers with a larger instrument of analysis. In addi-
tion, more sophisticated approaches to lead time fore-
casting could be exploited, with simulation of non-
linear systems to investigate how machine faults and
maintenance procedures can influence lead time.
ACKNOWLEDGMENT
The research described in this paper was carried
out with funding from the Brazilian State Funding
Agency of Goi
´
as (FAPEG), Brazilian National Coun-
cil of State Funding Agencies (CONFAP-ITALY) and
Higher Education Personnel Improvement Coordina-
tion (CAPES).
REFERENCES
Albers, C. J., Critchley, F., and Gower, J. C. (2011).
Quadratic minimisation problems in statistics. Jour-
nal of Multivariate Analysis, 102(3):698–713.
Berling, P. and Farvid, M. (2014). Lead-time investiga-
tion and estimation in divergent supply chains. Inter-
national Journal of Production Economics, 157:177–
189.
Breiman, L., Friedman, J., Stone, C. J., and Olshen, R. A.
(1984). Classification and regression trees. CRC
press.
Brown, M. T., Bussell, J., Dutta, S., Davis, K., Strong, S.,
and Mathew, S. (2016). Medication adherence: truth
and consequences. The American journal of the med-
ical sciences, 351(4):387–399.
Cabrera-S
´
anchez, J.-P. and Villarejo-Ramos,
´
A. F. (2020).
Acceptance and use of big data techniques in services
companies. Journal of Retailing and Consumer Ser-
vices, 52(C):101888.
Chamikara, M., Bertok, P., Liu, D., Camtepe, S., and Khalil,
I. (2020). Efficient privacy preservation of big data for
accurate data mining. Information Sciences, 527:420–
443.
Chang, F.-C. (1997). Heuristics for dynamic job shop
scheduling with real-time updated queueing time esti-
mates. International Journal of Production Research,
35(3):651–665.
Chung, W., Talluri, S., and Kov
´
acs, G. (2018). Investigat-
ing the effects of lead-time uncertainties and safety
stocks on logistical performance in a border-crossing
jit supply chain. Computers & Industrial Engineering,
118:440–450.
Dean, J. (2014). Big data, data mining, and machine learn-
ing: value creation for business leaders and practi-
tioners. John Wiley & Sons.
Drucker, H., Burges, C. J., Kaufman, L., Smola, A. J.,
and Vapnik, V. (1997). Support vector regression ma-
chines. In Mozer, M. C., Jordan, M. I., and Petsche,
T., editors, Advances in neural information processing
systems 9, pages 155–161. MIT Press.
Eberle, L. G., Sugiyama, H., and Schmidt, R. (2014). Im-
proving lead time of pharmaceutical production pro-
cesses using monte carlo simulation. Computers &
Chemical Engineering, 68:255–263.
Fayyad, U., Piatetsky-Shapiro, G., and Smyth, P.
(1996). From data mining to knowledge discovery in
databases. AI magazine, 17(3):37.
Frank, A. G., Dalenogare, L. S., and Ayala, N. F. (2019).
Industry 4.0 technologies: Implementation patterns in
manufacturing companies. International Journal of
Production Economics, 210:15–26.
Gatica, G., Shah, N., and Papageorgiou, L. G. (2001). Ca-
pacity planning under clinical trials uncertainty for the
pharmaceutical industry. In Gani, R. and Jørgensen,
S. B., editors, European Symposium on Computer
Aided Process Engineering - 11, volume 9 of Com-
puter Aided Chemical Engineering, pages 865 – 870.
Elsevier.
Goltsos, T. E., Ponte, B., Wang, S., Liu, Y., Naim, M. M.,
and Syntetos, A. A. (2019). The boomerang returns?
accounting for the impact of uncertainties on the dy-
namics of remanufacturing systems. International
Journal of Production Research, 57(23):7361–7394.
Gyulai, D., Pfeiffer, A., Nick, G., Gallina, V., Sihn, W., and
Monostori, L. (2018). Lead time prediction in a flow-
shop environment with analytical and machine learn-
ing approaches. IFAC-PapersOnLine, 51(11):1029–
1034.
Harapan, H., Itoh, N., Yufika, A., Winardi, W., Keam, S.,
Te, H., Megawati, D., Hayati, Z., Wagner, A. L.,
and Mudatsir, M. (2020). Coronavirus disease 2019
(covid-19): A literature review. Journal of Infection
and Public Health, 13(5):667 – 673.
Haugh, K. H. (2014). Medication adherence in older adults:
The pillbox half full. Nursing Clinics of North Amer-
ica, 49(2):183–199.
Hosoda, T. and Disney, S. M. (2018). A unified theory of
the dynamics of closed-loop supply chains. European
Journal of Operational Research, 269(1):313–326.
Hu, X., Pedrycz, W., and Wang, X. (2018). Fuzzy classifiers
with information granules in feature space and logic-
based computing. Pattern Recognition, 80:156–167.
Ioannou, G. and Dimitriou, S. (2012). Lead time estima-
tion in mrp/erp for make-to-order manufacturing sys-
tems. International Journal of Production Economics,
139(2):551–563.
Jun, H.-B., Park, J.-Y., and Suh, H.-W. (2006). Lead time
estimation method for complex product development
process. Concurrent Engineering, 14(4):313–328.
ICEIS 2021 - 23rd International Conference on Enterprise Information Systems
640

Kabugo, J. C., J
¨
ams
¨
a-Jounela, S.-L., Schiemann, R., and
Binder, C. (2020). Industry 4.0 based process data an-
alytics platform: A waste-to-energy plant case study.
International Journal of Electrical Power & Energy
Systems, 115:105508.
Kim, S. H., Kim, J. W., and Lee, Y. H. (2014). Simulation-
based optimal production planning model using dy-
namic lead time estimation. The International Jour-
nal of Advanced Manufacturing Technology, 75(9-
12):1381–1391.
Kramer, R., Cordeau, J.-F., and Iori, M. (2019). Rich vehi-
cle routing with auxiliary depots and anticipated deliv-
eries: An application to pharmaceutical distribution.
Transportation Research Part E: Logistics and Trans-
portation Review, 129:162–174.
Kuo, C.-F. J., Lin, C.-H., and Lee, M.-H. (2018). Ana-
lyze the energy consumption characteristics and af-
fecting factors of taiwan’s convenience stores-using
the big data mining approach. Energy and Buildings,
168:120–136.
Lingitz, L., Gallina, V., Ansari, F., Gyulai, D., Pfeiffer, A.,
and Monostori, L. (2018). Lead time prediction using
machine learning algorithms: A case study by a semi-
conductor manufacturer. Procedia CIRP, 72:1051–
1056.
Lu, W., Chen, X., Peng, Y., and Shen, L. (2015). Bench-
marking construction waste management performance
using big data. Resources, Conservation and Recy-
cling, 105(Part A):49–58.
Montgomery, D. C., Peck, E. A., and Vining, G. G. (2012).
Introduction to linear regression analysis, volume 821
of Wiley Series in Probability and Statistics. John Wi-
ley & Sons.
Moscelli, G., Siciliani, L., and Tonei, V. (2016). Do waiting
times affect health outcomes? evidence from coronary
bypass. Social Science & Medicine, 161:151–159.
Mourtzis, D., Doukas, M., Fragou, K., Efthymiou, K., and
Matzorou, V. (2014). Knowledge-based estimation of
manufacturing lead time for complex engineered-to-
order products. Procedia CIRP, 17:499–504.
Noori-Daryan, M., Taleizadeh, A. A., and Jolai, F.
(2019). Analyzing pricing, promised delivery lead
time, supplier-selection, and ordering decisions of a
multi-national supply chain under uncertain environ-
ment. International Journal of Production Economics,
209:236–248.
¨
Ozt
¨
urk, A., Kayalıgil, S., and
¨
Ozdemirel, N. E. (2006).
Manufacturing lead time estimation using data min-
ing. European Journal of Operational Research,
173(2):683–700.
Pfeiffer, A., Gyulai, D., K
´
ad
´
ar, B., and Monostori, L.
(2016). Manufacturing lead time estimation with
the combination of simulation and statistical learning
methods. Procedia CIRP, 41:75–80.
Ponte, B., Costas, J., Puche, J., Pino, R., and de la
Fuente, D. (2018). The value of lead time reduction
and stabilization: A comparison between traditional
and collaborative supply chains. Transportation Re-
search Part E: Logistics and Transportation Review,
111:165–185.
Ristoski, P. and Paulheim, H. (2016). Semantic web in data
mining and knowledge discovery: A comprehensive
survey. Journal of Web Semantics, 36:1–22.
Rumelhart, D. E. and McClelland, J. L. (1987). Learning
Internal Representations by Error Propagation, pages
318–362. MIT Press.
Sagaert, Y. R., Kourentzes, N., De Vuyst, S., Aghezzaf, E.-
H., and Desmet, B. (2019). Incorporating macroe-
conomic leading indicators in tactical capacity plan-
ning. International Journal of Production Economics,
209:12–19.
Sievers, S., Seifert, T., Franzen, M., Schembecker, G., and
Bramsiepe, C. (2017). Lead time estimation for modu-
lar production plants. Chemical Engineering Research
and Design, 128:96–106.
Sivarajah, U., Kamal, M. M., Irani, Z., and Weerakkody, V.
(2017). Critical analysis of big data challenges and
analytical methods. Journal of Business Research,
70:263–286.
Strijbosch, L., Heuts, R., and Luijten, M. (2002). Cyclical
packaging planning at a pharmaceutical company. In-
ternational Journal of Operations & Production Man-
agement, 22(5):549–564.
Tatsiopoulos, I. and Kingsman, B. (1983). Lead time man-
agement. European Journal of Operational Research,
14(4):351–358.
Tetteh, E. K. (2019). Reducing avoidable medication-
related harm: What will it take? Research in Social
and Administrative Pharmacy, 15(7):827–840.
Tsai, C.-F., Lin, W.-C., and Ke, S.-W. (2016). Big data
mining with parallel computing: A comparison of dis-
tributed and mapreduce methodologies. Journal of
Systems and Software, 122:83–92.
Vandaele, N., Boeck, L. D., and Callewier, D. (2002). An
open queueing network for lead time analysis. IIE
transactions, 34(1):1–9.
Lead Time Forecasting with Machine Learning Techniques for a Pharmaceutical Supply Chain
641
