
A New Dataset for Smartphone Gesture-based Authentication
Elliu Huang
a
, Fabio Di Troia
b
, Mark Stamp
c
and Preethi Sundaravaradhan
d
Department of Computer Science, San Jose State University, San Jose, California, U.S.A.
Keywords:
Gesture, Authentication, Accelerometer, Support Vector Machine, Principal Component Analysis.
Abstract:
In this paper, we consider the problem of authentication on a smartphone, based on gestures. Specifically,
the gestures consist of users holding a smartphone while writing their initials in the air. Accelerometer data
from 80 subjects was collected and we provide a preliminary analysis of this data using machine learning
techniques. The machine learning techniques considered include principal component analysis (PCA) and
support vector machines (SVM). The results presented here are intended to provide a baseline for additional
research based on our dataset.
1 INTRODUCTION
Authentication is an integral part of the security of
any digital system. Several methods of authentication
are available, with passwords being the most com-
mon. Another popular form of authentication relies
on biometric features of users. As with any authen-
tication technique, a useful biometric must enable us
to distinguish between users and, to be practical, such
features must be easy to collect in a reliable manner.
Biometric authentication can be divided into two
categories based on whether the users are identified
by their physical features or their behavioral pat-
terns (Ganesh et al., 2017). A new type of behavioral
biometric authentication system inspired by handwrit-
ten signatures has recently been considered (Yang
et al., 2015). This system involves signing gestures
in the air, similar to drawing signatures with a pen.
One such system is OpenSesame, which is claims
to achieve a high-level of security and robustness,
with a mean false positive rate of 15% and a false
negative rate of 8% (Yang et al., 2015). OpenSeame
evaluates hand gesture actions, but does not take into
account a “shoulder surfing” scenario, that is, the case
where an intruder observes a user’s hand movements
and then imitates the movements in an attempt to gain
access to the system. This scenario is analogous to
forging a signature on paper.
Several machine learning techniques have been
a
https://orcid.org/0000-0001-7515-7369
b
https://orcid.org/0000-0003-2355-7146
c
https://orcid.org/0000-0002-3803-8368
d
https://orcid.org/0000-0002-0966-0852
used to recognize gesture-based signatures in the form
of accelerometer sensor data. Among the most pop-
ular machine learning techniques for this purpose are
hidden Markov models (HMM) (Bailador et al., 2011;
Rabiner, 1989), support vector machines (SVM), re-
current neural networks (RNN), and dynamic time
warping (DTW) (Mitra and Acharya, 2007; Yang
et al., 2015).
In this research, we explore the effectiveness and
robustness of gesture-based authentication, based on
a new and substantial dataset that we have collected.
Specifically, we consider the accuracy that can be
achieved using accelerometer data based on in-air
handwriting, and we also consider the effectiveness
of shoulder surfing attacks on such a system. We
measure effectiveness in terms of the accuracy of user
identification and intruder detection.
To analyze our accelerometer data, we consider
machine learning strategies. We focus on SVMs
and we also experiment with PCA for dimensional-
ity reduction. Research in gesture-based authentica-
tion systems often focuses on detecting the shape and
stroke of the pattern (Huang et al., 2017). In this pa-
per, we consider statistical features, without explicitly
identifying the shape of the signature.
The remainder of this paper is organized as fol-
lows. Section 2 provides relevant background on a
variety of topics, including related authentication sys-
tems, machine learning techniques, and data collec-
tion. In Section 3, we discuss our data collection pro-
cess, and we provide details on our experiments and
results. Section 4 gives our conclusions along with
suggestions for future work.
Huang, E., Di Troia, F., Stamp, M. and Sundaravaradhan, P.
A New Dataset for Smartphone Gesture-based Authentication.
DOI: 10.5220/0010425807710780
In Proceedings of the 7th International Conference on Information Systems Security and Privacy (ICISSP 2021), pages 771-780
ISBN: 978-989-758-491-6
Copyright
c
2021 by SCITEPRESS – Science and Technology Publications, Lda. All rights reserved
771

2 BACKGROUND
In this section, we first introduce the problem un-
der consideration and briefly discuss relevant previous
work. Then we mention the metrics used to measure
the success of our experiments and we also briefly in-
troduce the machine learning techniques that we em-
ploy. Data collection and feature extraction are a ma-
jor emphasis of this work, so we discuss these issues
in more detail.
2.1 Motivation
A machine can authenticate a user by means of
something the user knows (typically, a password), or
something the user possesses (e.g., an RFID tag), or
by some characteristic of the user (e.g., a biomet-
ric feature such as a fingerprint). These are popu-
larly summarized in the security domain as “some-
thing you know, something you have, or something
you are” (Anderson, 2001). This research is fo-
cused on a biometric authentication technique based
on smartphone movements, as measured by a built-in
accelerometer.
There are two broad categories of biometrics—
physical based and behavioral based. Physical based
biometrics verify a user based on an innate charac-
teristic, such as an iris scan, fingerprint, hand geom-
etry, or facial recognition. Such authentication in-
volves scanning the biometric feature of the user and
attempting to matching the result to a stored version
that is assumed to belong to the specified user.
Behavioral biometrics, which are also known as
physiological biometrics, verify a user based on some
specific behavior (Huang et al., 2017). Features used
in such an authentication technique depend on knowl-
edge of a user’s behavior. For example, an image of
a handwritten signature can be captured and image-
based pattern recognition can then be used for au-
thentication (Bailador et al., 2011). Another example
of a behavior based biometric is keystroke dynam-
ics (Liu et al., 2009a), where, for example, a time-
series analysis can be applied to timing data that is
recorded while typing. Gait recognition is yet another
behavioral based biometric–such systems leverage the
speed and motion pattern of users, based on video or
audio signals (Huang et al., 2018; Liu et al., 2017).
There are a wide variety of attacks on authenti-
cation systems in general. For example, in the case
of password based authentication, an attacker might
steal a password file containing hashed passwords and
conduct a forward search attack (Stamp, 2011). In the
case of biometric authentication, attacks typically in-
volve copying the biometric features (Guse, 2011a).
A gesture-based authentication scheme might offer
some resistance to such attacks, in part due to the fact
that the search space for relevant patterns is poten-
tially very large (Bailador et al., 2011). In addition to
knowing the pattern itself, the attacker might need to
know something about the angle, speed, and relative
area in which the pattern is drawn (Guse, 2011a).
The authentication technique considered in this
paper, which is based on gestures captured using an
accelerometer sensor, can be categorized as a behav-
ioral biometric. A similar type of biometric system is
considered, for example, in (Huang et al., 2017). Un-
der our approach, 3-d accelerations are captured when
the user waves a phone in a manner analogous to writ-
ing their own initials. The resulting sensor data is a
sequence of (x,y,z) triples that correspond to accel-
eration in the respective planes. In our experiments,
we process these sequences to obtain features that are
used by machine learning algorithms for classifica-
tion. Our goal is to determine how accurately we can
distinguish between users, as well as to determine the
susceptibility of such an authentication technique to
shoulder surfing attacks.
Our gesture-based authentication scheme requires
an accelerometer. Fortunately, virtually all modern
smart devices have a built-in accelerometer, which
makes such sensors nearly ubiquitous. We note in
passing that authentication based on accelerometer
data is computationally cheaper than facial recogni-
tion and many other comparable types of physical bio-
metrics (Huang et al., 2017). Thus, the authentication
technique considered here is eminently practical, and
may be of particular interest in the case of resource-
constrained smart devices.
2.2 Related Work
The two main methods by which gesture-based au-
thentication has been approached are via motion ges-
tures and touchscreen (Clark and Lindqvist, 2014).
Approaches using motion gestures generally use ac-
celerometer and gyroscope data, and prior research
in this domain have applied DTW (Liu et al., 2009b)
and SVMs (Lu et al., 2018) . Accelerometer and
gyroscope data have also been collected via mobile
devices in (Guse, 2011b), which applies DTW and
HMMs to authenticate users . A more sophisticated
method involves a sensor known as the Leap Mo-
tion controller to collect 3-d motion data and applies
similarity thresholds to authenticate users (Imura and
Hosobe, 2018).
Touchscreen-based gesture authentication meth-
ods typically analyze touch dynamics, i.e., various in-
puts recorded from a touchscreen interface, such as
ForSE 2021 - 5th International Workshop on FORmal methods for Security Engineering
772

finger size and pressure. One study analyzed finger
behavior and position data, authenticating users using
SVMs (Alariki and Manaf, 2014). Another study em-
ployed neural networks, specifically particle swarm
optimization (PSO), to find patterns in touch dynam-
ics (Meng et al., 2013).
An important component of authentication is
forgery, and prior research into gesture authentication
forgery can be divided into naive and visual forgery.
In naive forgery, attackers randomly guess the pattern
because they do not know their target user’s signa-
ture, similar to randomly guessing passwords. Visual
forgery, also known as shoulder surfing, describes the
situation in which attackers imitate another user’s ges-
tures after seeing the user’s signature. A variety of
techniques have been applied to combat both naive
and visual forgery, such as DTW for the former and
HMMs for the latter (Guse, 2011b).
2.3 Metrics
In this section, we discuss the metrics we use to mea-
sure the quality of our authentication experiments.
Generically, two types of errors can occur in authen-
tication systems. The rate at which an intruder is er-
roneously recognized as an authentic user is the false
acceptance rate (FAR) or, colloquially, the fraud rate.
On the other hand, an authentic user may be incor-
rectly rejected as an intruder—the rate at which this
type of mis-authentication occurs is the false reject
rate (FRR) or, informally, the insult rate.
A confusion matrix can be used to summarize the
following exhaustive and mutually exclusive cases:
True Positive. (TP), where a legitimate user is cor-
rectly authenticated as such.
False Positive. (FP), where an intruder is mis-
authenticated as a legitimate user.
True Negative. (TN), where an intruder is unable to
authenticated as a legitimate user.
False Negative. (FN), where a legitimate user is un-
able to authenticate as themselves.
Note that TP and TN represent correct classifications,
while FP and FN are incorrect classifications and
hence the accuracy is given by
accuracy =
TP + TN
TP + TN + FP + FN
An example of a confusion matrix is illustrated in
Figure 1. From such a matrix, the FAR and the FRR
are easily computed as
FAR = FPR =
FP
FP + TP
and
FRR = FNR = 1 − TPR =
TP
TP + FN
where FPR is the false positive rate, and TPR is the
true positive rate.
TP FP
FN TN
Intruder
User A
User A
Intruder
Predicted Label
Actual Label
Figure 1: Confusion matrix.
For a given biometric authentication system, we must
set a threshold to distinguish between an authentica-
tion success and a failure. This threshold will deter-
mine the FAR and FRR. There is an inherent trade-off
between the FAR and FRR—changing the threshold
to decrease one will necessarily increase the other.
The equal error rate (EER) is the rate at which the
FAR and FRR are balanced, and can serve as a useful
measure for comparing the effectiveness of different
biometric systems. A lower equal error rate implies
that the system has higher accuracy (Stamp, 2011).
Given a scatterplot of scores, a receiver operating
characteristic (ROC) curve provides a graphical illus-
tration of the FPR verses the TPR as the threshold
varies through all possible values. The area under the
ROC curve (AUC) ranges between 0 and 1, and can be
interpreted as the probability that a randomly selected
positive instance scores higher than a randomly se-
lected negative instance (Bradley, 1997). If the AUC
is x < 0.5, we can simply reverse the sense of the clas-
sifier to obtain an AUC of 1 − x > 0.5.
The EER is easily determined from an ROC curve
by simply finding the point on the curve where
FPR + TPR = 1.
In the example given in Figure 2, the shaded region
representing the AUC, while the point where the main
diagonal crosses the ROC curve gives the EER.
2.4 Machine Learning Techniques
A biometric system typically computes a score for a
given characteristic by extracting features and then
A New Dataset for Smartphone Gesture-based Authentication
773
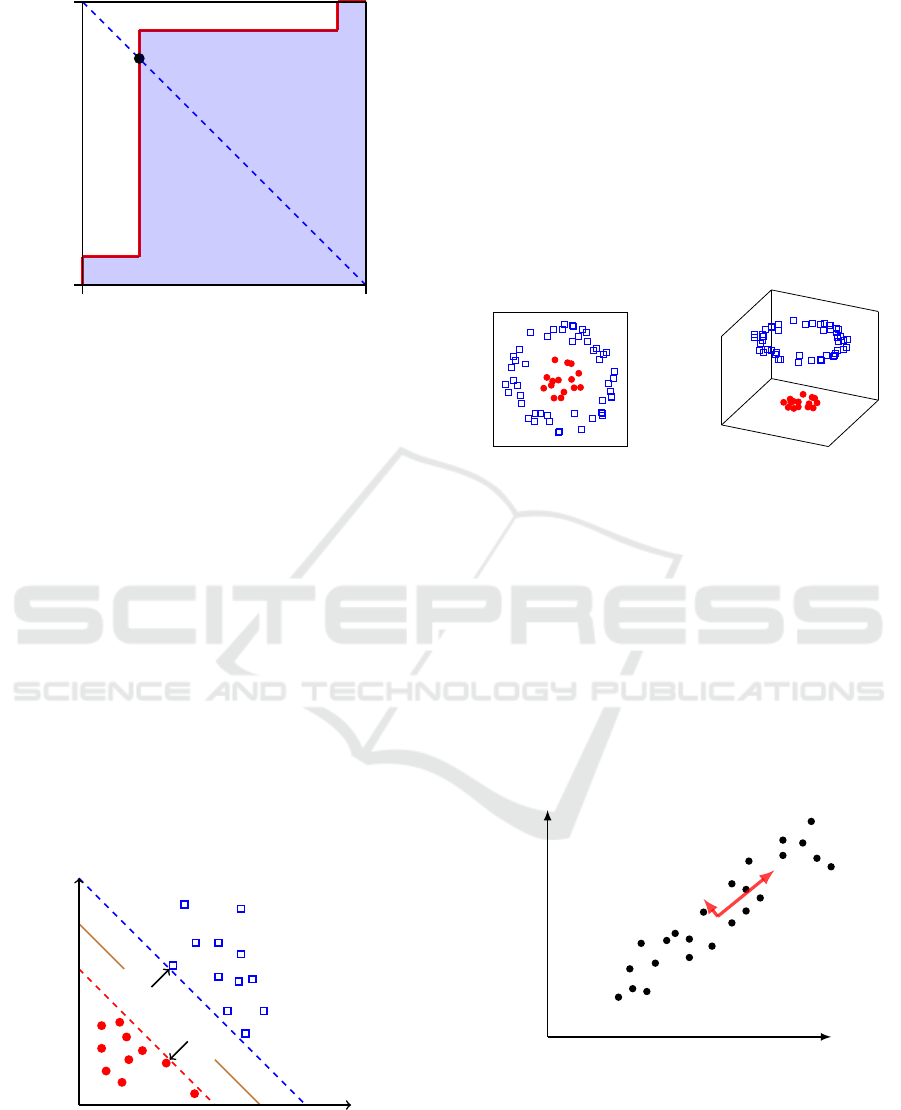
EER
FPR
TPR
0
0
1
1
Figure 2: ROC curve and EER.
employs pattern matching or machine learning tech-
niques to determine the classification. In our gesture-
based authentication experiments, we employ ma-
chine learning algorithms based on features derived
from accelerometer data. We employ SVMs as a di-
rect approach and also consider the effect of PCA for
dimensionality reduction. Next, we briefly discuss
these two machine learning techniques.
2.4.1 Support Vector Machines
Support vector machines (SVMs) are a class of super-
vised machine learning algorithms that can be used
for both regression and classification (Suriya Prakash
et al., 2012). With an SVM, we attempt to separate
labeled data points by finding an optimal hyperplane,
in the sense of maximizing the “margin” or separa-
tion between classes. Samples are then classified, de-
pending on which side of the hyperplane they reside.
Figure 3 gives an illustrative example of such a hyper-
plane.
support vectors
Figure 3: SVM separating hyperplane (Stamp, 2017).
An SVM can also yield a non-linear decision bound-
ary by using the so-called kernel trick (Stamp, 2017).
This technique projects input features into a higher-
dimensional “feature space” where the data is more
likely to be linearly separable. An example illustrat-
ing the effect of the kernel trick is given in Figure 4,
where the input space data (left-hand side) is not lin-
early separable, but after mapping to a higher dimen-
sion (right-hand side), we can easily separate the data
with a hyperplane. The real “trick” to the kernel trick
is that we pay almost no computational penalty for
working in this higher dimensional space. A vari-
ety of non-linear kernel functions are commonly used.
For a given problem, the SVM kernel and its associ-
ated parameters are generally selected by experimen-
tation (Polamuri, 2017).
φ
=⇒
Figure 4: The kernel trick (Stamp, 2017).
2.4.2 Principal Component Analysis
Principal component analysis (PCA) is a linear alge-
braic technique that provides a powerful tool for di-
mensionality reduction. Here, we provide a very brief
introduction to the topic; for more details, Shlens’ tu-
torial is highly recommended (Shlens, 2005).
Geometrically, PCA aligns a basis with the (or-
thogonal) directions having the largest variances.
These directions are defined to be the principal com-
ponents. A simple illustration of such a change of
basis appears in Figure 5.
Figure 5: A better basis.
Intuitively, larger variances correspond to more infor-
mative data—if the variance is small, the training data
is clumped tightly around the mean and we have lim-
ited ability to distinguish between samples. In con-
trast, if the variance is large, there is a much better
chance of separating the samples based on the charac-
teristic (or characteristics) under consideration. Con-
ForSE 2021 - 5th International Workshop on FORmal methods for Security Engineering
774
sequently, once we have aligned the basis with the
variances, we can ignore those directions that corre-
spond to small variances without losing significant in-
formation. In fact, small variances often contribute
only noise, in which cases we can actually improve
our results by neglecting those directions that corre-
spond to small variances. We can often achieve a dra-
matic dimensionality reduction using PCA.
2.5 Data Collection and Feature
Extraction
An accelerometer is a type of sensor that can capture
data related to phone movement, and is present in all
modern smartphones. The measurements provided by
an accelerometer are in terms of acceleration relative
to a freefall along the x, y and z axes. The unit of
measurement is in terms of gravitational acceleration,
which on earth is given by g = 9.8m/second
2
. For ex-
ample, if the smartphone is placed flat on the ground,
the accelerometer will read 0 along the x and y axis
and 1 along the z axis (Fitbit, Inc, 2019).
When the device is moved, the acceleration along
the three axes is measured as a sequence of tri-axial
data points that can be represented as
(x
t
,y
t
,z
t
)
where x, y, and z represents the acceleration along
these axes and t denotes the time. Smartphone ac-
celerometers allow the sampling time to be user de-
fined. In our research, we fix the sampling rate
at 50ms, which means that we obtain 20 triples per
second. Thus, in our experiments, if a gesture lasts
for 2 seconds, the accelerometer records 40 data
points represented as
(x
0
,y
0
,z
0
),(x
1
,y
1
,z
1
),(x
2
,y
2
,z
2
),..., (x
39
,y
39
,z
39
)
.
We measure a user’s signature, which is of the form
sig=
(x
t
0
,y
t
0
,z
t
0
),(x
t
1
,y
t
1
,z
t
1
),. .., (x
t
L
,y
t
L
,z
t
L
)
(1)
A signature that requires x seconds to draw results in
a length parameter in (1) of L = b40xc − 1.
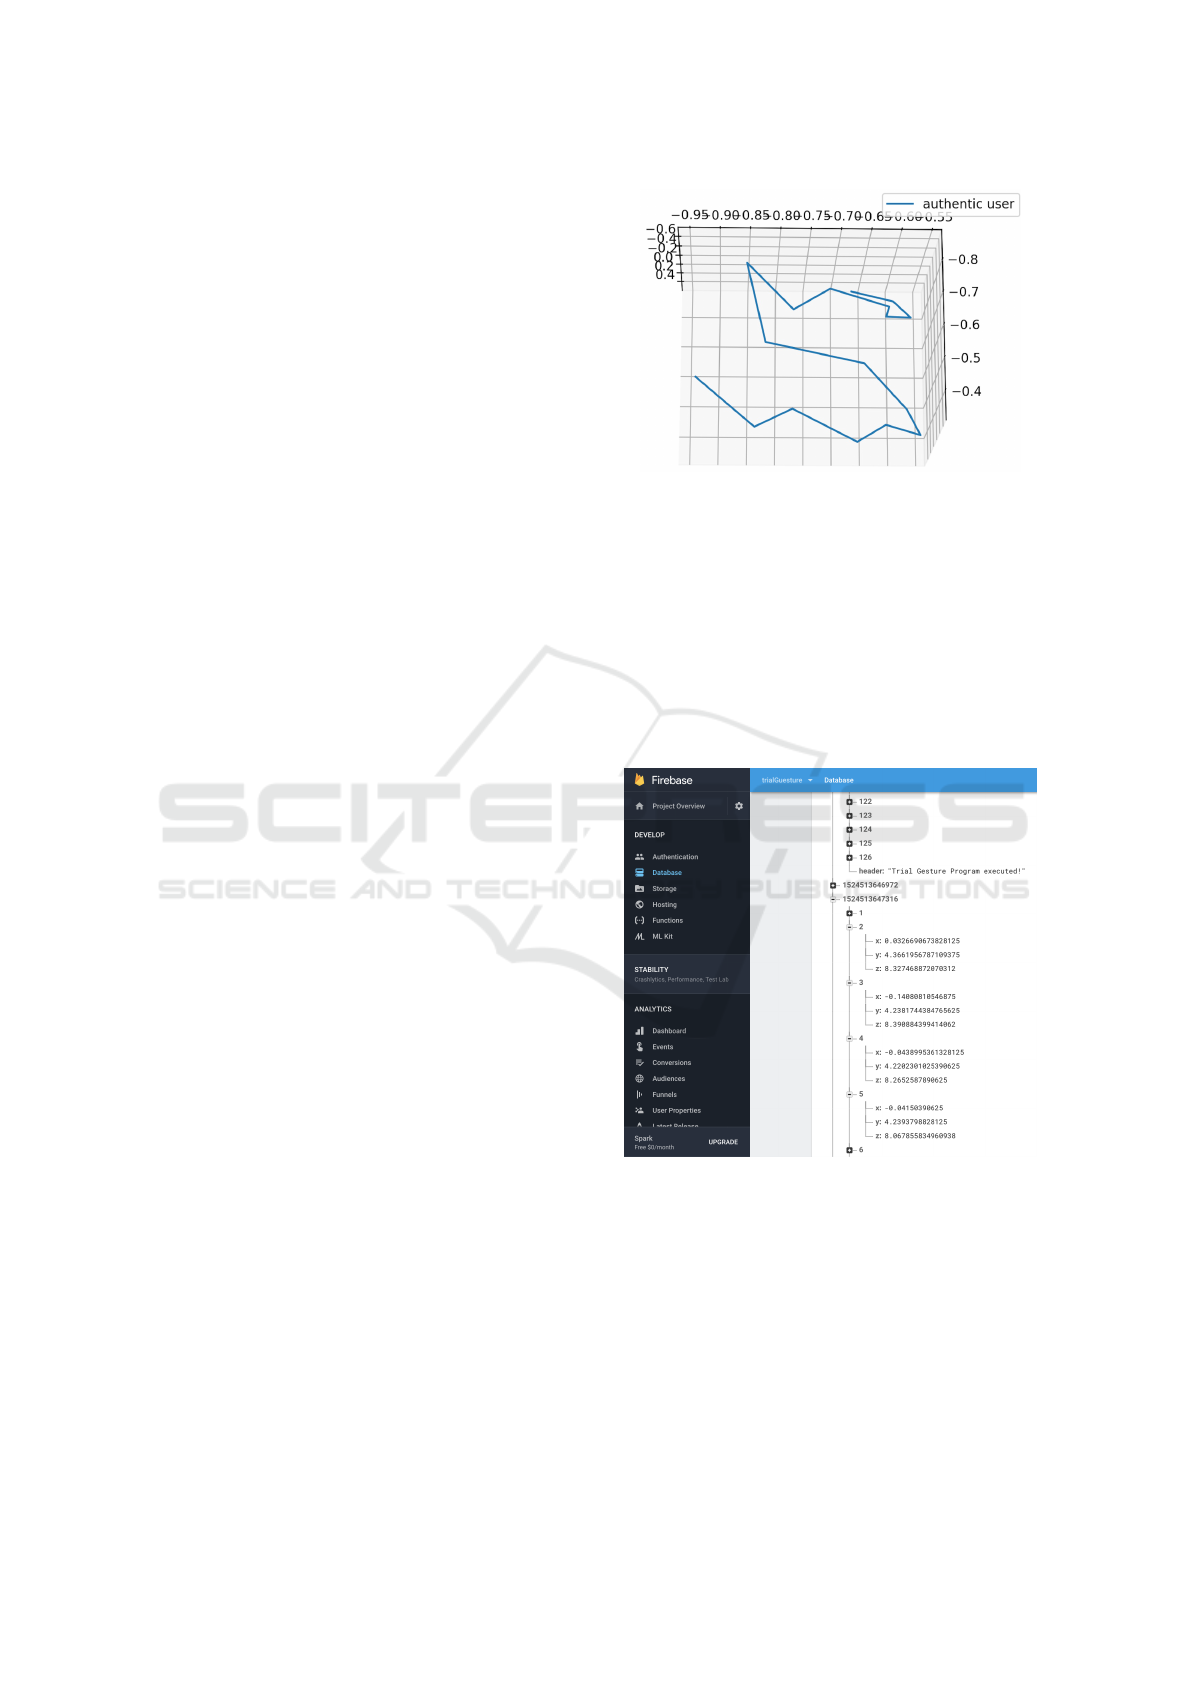
We can connect the datapoints of a signature of
the form (1) to yield an object in 3-dimensional space
that provides a representation of the signature. For
example, Figure 6 shows the result of such a recon-
struction when the letter “S” was drawn in the air—
for an appropriate rotation, we can clearly see a crude
representation of this letter.
2.6 Data Collection
We perform data collection on both Android and Ap-
ple iOS platforms. This was done to enabled us to
Figure 6: Reconstructed “S” from accelerometer data.
maximize the number of users in our research. For
the Android platform, we created a custom applica-
tion that automatically uploads data to a cloud-based
database, Google Firebase (Google, 2019).
A sample of data collected on an Android phone is
shown in Figure 7. The data is stored in JSON format.
Here, the timestamp at which the signature collection
started forms the root of the JSON tree and every tri-
axial data point (recorded at 50ms intervals) form the
children of this tree.
Figure 7: Screenshot of collected data from Android phone.
For the iOS platform, the appropriately-named appli-
cation Accelerometer was used (DreamArc, 2019).
A screenshot of this application is shown in Figure 8.
Note that in this case, the signature data is plotted as
a curve, based on the time series. Here, acceleration
along each axis is represented as a separate curve—
the x-axis data is the green curve, y-axis is the red
curve, and the z-axis acceleration is the blue curve.
Data equivalent to that collected from Android de-
vices is easily derived from these curves.
A New Dataset for Smartphone Gesture-based Authentication
775
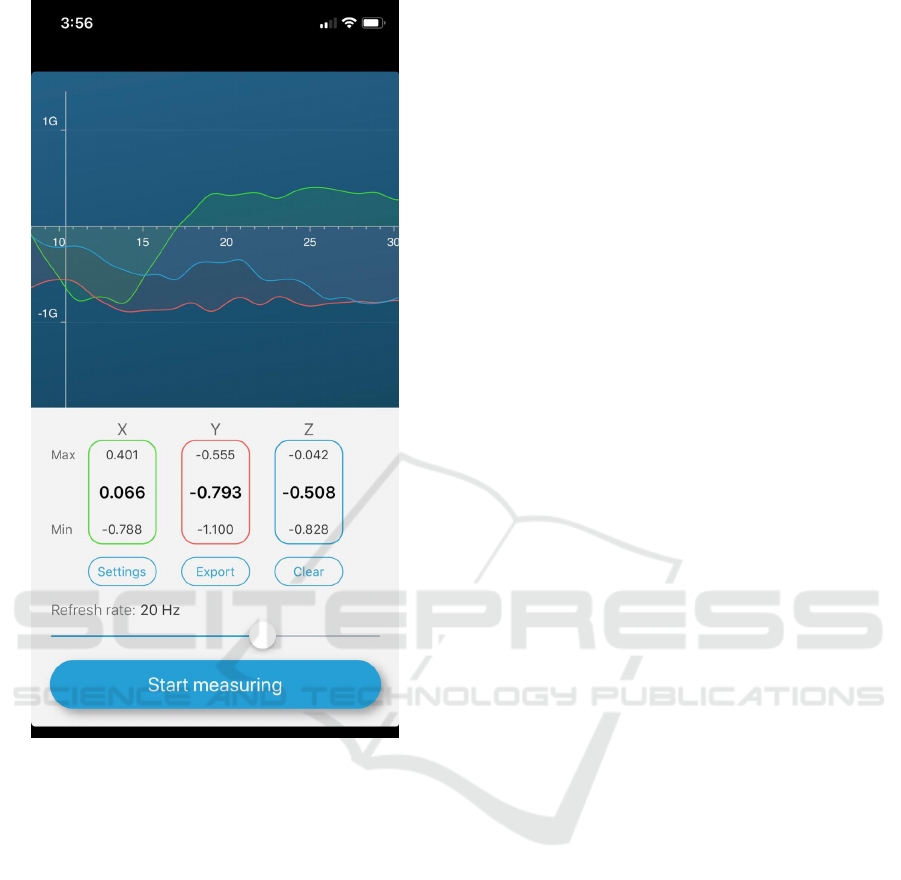
Figure 8: Data collection in iOS.
Regardless of the platform, the user performs the fol-
lowing steps.
• Click the “start measuring” button on the app,
which begins the recording of accelerometer data.
• Move the smartphone in the air to draw a signa-
ture.
• Click the “stop measuring” button.
These steps serve to record the data and load it into
our database in the cloud. Again, this data is stored in
JSON format, as illustrated in Figure 7.
We have collected data from N = 80 users—we
denote these users as
user
0
,user
1
,. .., user
79
.
We consider two types of signatures, namely, an “un-
restricted” signature and a “common” signature, as
described below. We treat user
0
as a special case—
this user selects a specific signature and generates 20
samples of this signature, which serve s the common
signature.
Consider user
i
, where i > 0. As with user
0
, this
user selects a signature and generates 20 samples of
the selected signature. We refer to this user-selected
signature as this user’s unrestricted signature. Next,
user
i
observes the signature of user
0
and attempts to
mimic this signature. Since this “signature” will be
common to all users, we refer to this as the com-
mon signature. As with the unrestricted signature, we
again collect data for 20 iterations of the common sig-
nature from each user. This common signature can
be used, for example, to analyze the effectiveness of
shoulder surfing attacks.
In our experiments, users typically selected their
unrestricted signature to be their initials. Data collec-
tion generally required about 2 seconds of accelerom-
eter recording time per signature and the entire col-
lection process required about 15 minutes per user.
To summarize, we collect 20 samples of one spe-
cific signature from user
0
, which we denote as the
common signature. Then for each user
i
, where i > 0,
we collect the following data.
Unrestricted Signature. This is a pattern chosen by
the user, and it serves as a signature for the user.
This same signature is repeated 20 times and thus
we have 20 samples of each user’s unrestricted
signature.
Common Signature. The user observes the signa-
ture of user
0
and attempts to accurately “forge”
this signature. This is repeated 20 times, so that
we have 20 samples of the common signature
from each user.
Our dataset is freely available for use by other re-
searchers (Sundaravaradhan, 2019). The results pre-
sented in Section 3 are intended to serve as an initial
benchmark for future research involving this dataset.
2.6.1 Feature Extraction
The raw accelerometer data points will serve as fea-
tures in some of our experiments. In addition, we ex-
tract the following derived features from every signa-
ture, including both the unrestricted and the common
signatures.
Mean. The mean values of the data for each of the
three axes is calculated. This gives us three mean
values, which we denote as µ = (µ
x
,µ
y
,µ
z
), where
the subscript denotes the coordinate.
Median. The median values of the data for each
of the three axes is calculated. We denote the
medians in the x, y, and z coordinates as m =
(m
x
,m
y
,m
z
).
Magnitude. The magnitude of a signature is defined
as the average of the root mean square of the tri-
ForSE 2021 - 5th International Workshop on FORmal methods for Security Engineering
776
axial data (Bishal Singha et al., 2017). The mag-
nitude M is calculated as
M =
L
∑
k=1
q
x
2
k
+ y
2
k
+ z
2
k
.
L
where L is the length of the signature.
Velocity. The velocity v is calculated as a vector
consisting of the differences in consecutive data
points along each of the three axes. The velocity
vector is computed as
v =
(v
x,0
,v
y,0
,v
z,0
),(v
x,1
,v
y,1
,v
z,1
),. ..,
(v
x,L−1
,v
y,L−1
,v
z,L−1
)
where, using the notation in (1), we have
v
x,i
= x
t
i
− x
t
i−1
, v
y,i
= y
t
i
− y
t
i−1
, v
z,i
= z
t
i
− z
t
i−1
.
3 EXPERIMENTS AND RESULTS
We present the results from three classes of experi-
ments. For our first class of experiments, we con-
sider the problem of distinguishing users, based on
their unrestricted signatures, that is, we consider the
multiclass classification problem. This experiment
can be viewed as representing an identification prob-
lem, where we must select the user from among a
set of possible users—in the most challenging case,
we must distinguish between all users. This is an in-
herently difficult multiclass problem that will enable
us to compare the effectiveness of various machine
learning techniques under the most challenging cir-
cumstances. For the second class of experiments, we
attempt to distinguish a specific user in a one-versus-
all mode. This experiment represents a more realistic
authentication mode, where we either authenticate a
specified user, or not. As our final class of experi-
ments, we consider the common signature data. This
case can be viewed as simulating a shoulder surfing
attack, where an attacker attempts to mimic a specific
signature that they have observed.
For each of these classes of experiments, we test
various features and machine learning techniques.
Specifically, the machine learning techniques con-
sidered are those discussed in Section 2.4, namely,
SVMs and PCA.
3.1 SVM Experiments
We performed preliminary experiments with various
kernels and values of the parameters. We found that
the best results were obtained using a Gaussian ra-
dial basis function (RBF) kernel. For the hyperpa-
rameters, we found that the combination of γ = 0.003
and C = 100.0 yielded the best results. Hence, for all
experiments reported in this section, we use an RBF
kernel with γ = 0.003 and C = 100.0.
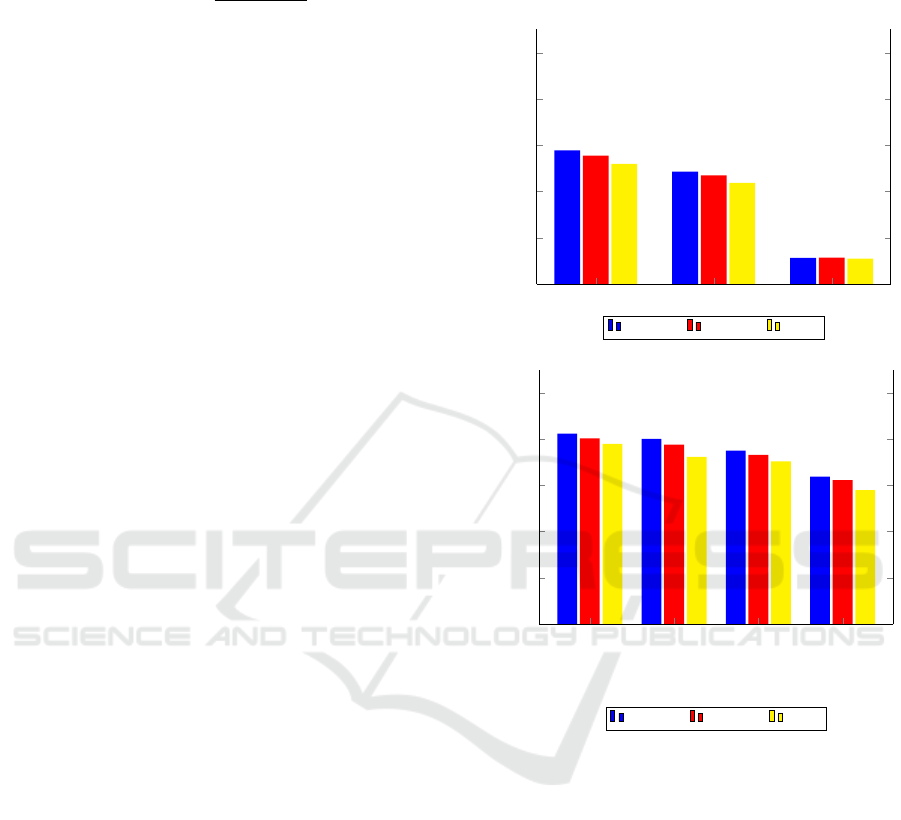
µ m
M
0.0
0.2
0.4
0.6
0.8
1.0
0.5778
0.4867
0.1133
0.5551
0.4703
0.1146
0.5196
0.4380
0.1108
Accuracy
20-fold 10-fold 5-fold
(a) Comparison of features and folds
µ, m, and M
µ and M
µ and m
m and M
0.0
0.2
0.4
0.6
0.8
1.0
0.8228
0.8000
0.7494
0.6380
0.8032
0.7759
0.7310
0.6222
0.7785
0.7228
0.7038
0.5791
Accuracy
20-fold 10-fold 5-fold
(b) Combinations of features and folds
Figure 9: SVM results.
First, we consider the problem of distinguishing a par-
ticular users’ signature from all other users. In this
case, we experiment with each of the three individ-
ual features, mean, median, and magnitude, and all
combinations of two of these features, as well as all
three features. In each case, we perform k-fold cross-
validation for k = 5, k = 10, and k = 20. The accu-
racy results for these experiments are summarized in
Figure 9 (a). From the results in Figure 9 (a), we see
that the mean is the strongest of the three features con-
sidered, and the magnitude is weakest, and we note
that none of the individual features performs particu-
larly well.
Next, we consider all combinations of these three
features and, again, we experiment with different
numbers of folds. These results are summarized in
A New Dataset for Smartphone Gesture-based Authentication
777
1 4 8 12 16 20 24 28 32 36 40 44 48 52 56 60 64 68 72 76 80
0.0
0.2
0.4
0.6
0.8
1.0
User
Accuracy
(a) All samples
1 4 8 12 16 20 24 28 32 36 40 44 48 52 56 60 64 68 72 76 80
0.0
0.2
0.4
0.6
0.8
1.0
User
Accuracy
(b) Omit last 3 samples
Figure 10: Individual users (all samples with 0.95 training ratio).
Figure 9 (b). We see that although the magnitude M is
very weak as a feature by itself, it does contribute use-
ful information when used in combination with other
features. The combination of all three features yields
the strongest result, with an overall accuracy of more
than 82% in the best case.
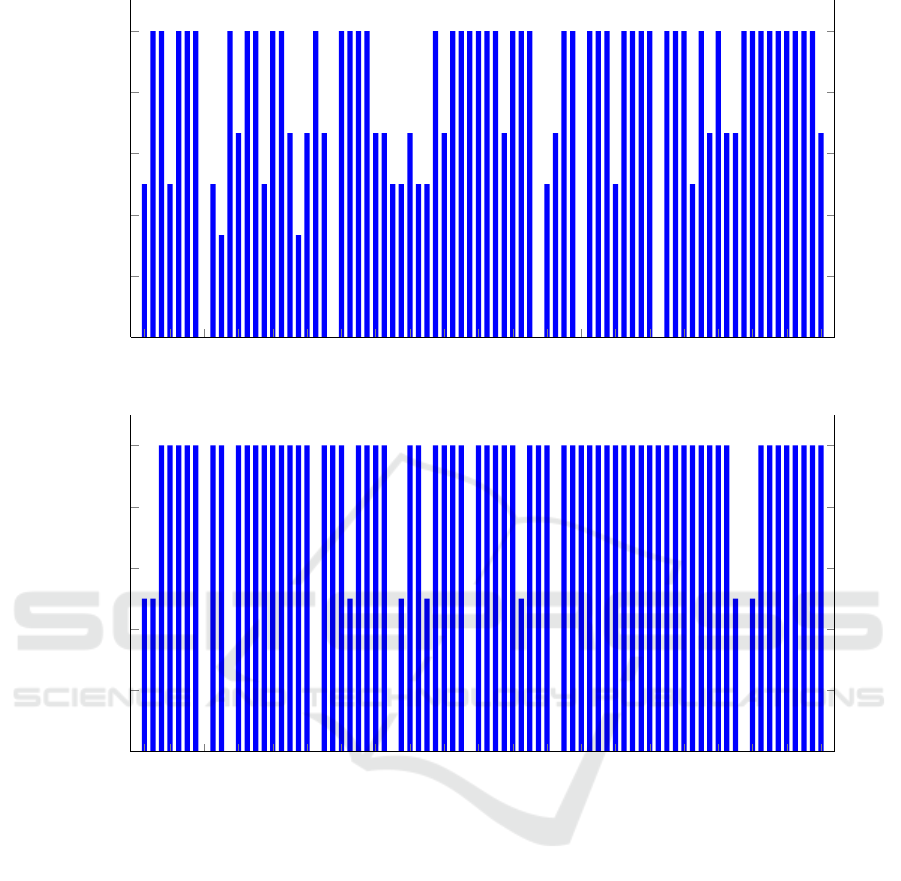
In Figure 10, we give results for each individual
user. Specifically, in these experiments, we attempt to
distinguish each user’s signature from all other users,
based on the combination of all three features consid-
ered above, namely, the mean µ, the median m, and
the magnitude M. Note that we obtain an ideal accu-
racy of 1.0 for 48 of the 80 users.
The ability to distinguish between users signatures
is an essential aspect of authentication. The results in
Figure 10 (a) indicate that the FRR or insult rate is
sufficiently low so that the this signature data could
form the basis for a viable authentication scheme.
During the data collection process, it was ob-
served that users tended to take less care in the last
few signatures. Hence, we repeat the individual user
experiment summarized in Figure 10 (a), but omitting
the last three signatures for each user. The results of
these experiments appear in Figure 10 (b). Comparing
Figures 10 (a) and 10 (b), we see that in the latter case,
the number of users with ideal separation is 62, which
is an increase of 14 over the former case. This result
suggest that “user fatigue” did indeed set in during
data collection, with users taking less care with their
last few signatures. Omitting more than the last 3 sig-
natures did not improve on these results, which indi-
cates that only the last few signatures are suspect.
ForSE 2021 - 5th International Workshop on FORmal methods for Security Engineering
778
3.2 PCA-SVM Experiments
As another set of experiments, we first project the 3-
d accelerometer vectors into two dimensions, based
on the two dominant eigenvectors obtained via PCA.
The idea here is to convert a 3-d “image”, such as
that in Figure 6, into a flat 2-dimensional image. By
using PCA to do the flattening, the flattened image
may have the characteristics of a letter drawn on a
flat surface, effectively removing the third dimension
with no loss of information. Intuitively, this should
serve to make classification somewhat easier, as we
have largely removed noise (specifically, the rotation
in 3-d space) from the problem.
Once we have converted all samples to 2-
dimensional flat “images”, we use an SVM for classi-
fication. For the SVMs, we use a 20-80 test-validation
split. We refer to these as PCA-SVM experiments.
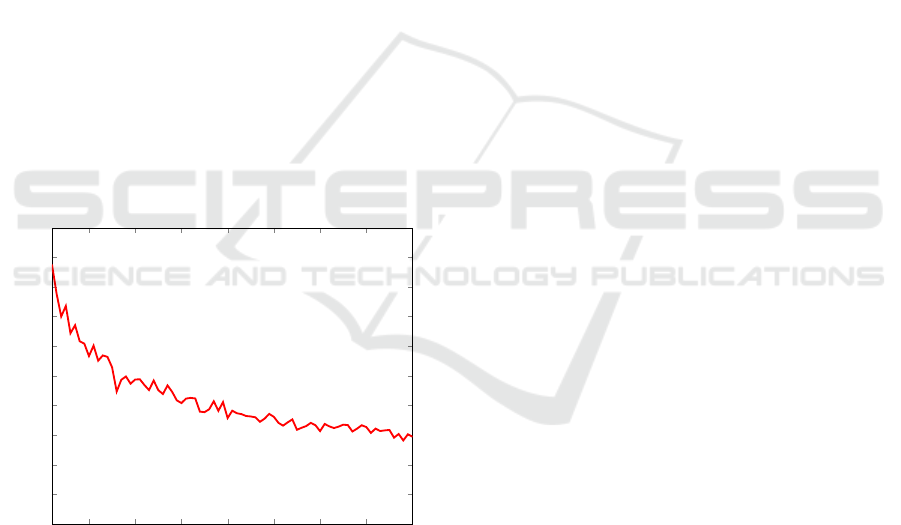
For the one-to-all experiments, we obtain a pre-
cision of 0.8725 and a recall of 0.8792, which gives
us an F1 score of 0.8758. For the multiclass identi-
fication problem we must distinguish between multi-
ple users’ signatures. We consider each of the cases
where the number of users varies over the range
of n = 2,3,4,. .., 80. These results are summarized
in Figure 11. Note that the n = 2 case can be viewed
as representative of the authentication problem.
2 10 20 30 40
50 60
70 80
0.10
0.20
0.30
0.40
0.50
0.60
0.70
0.80
0.90
1.00
Users
F1 score
Figure 11: F1 scores for PCA-SVM experiments.
The results in Figure 11 indicate that this PCA-SVM
technique is not be particularly strong in an identifica-
tion mode, where we must distinguish between a large
number of users. This is not surprising, given the in-
herent difficult of the problem, and the fact that our
technique is relatively crude, while the data itself is a
very brief signature (i.e., only initials). However, the
F1-score is nearly 90% for the n = 2 case, which in-
dicates that this technique has considerable potential
as an authentication mode.
4 CONCLUSION AND FUTURE
WORK
In this paper, we introduced a new dataset consist-
ing of biometric accelerometer data collected from 80
subjects. We performed a preliminary analysis of the
data using SVMs and PCA. These results indicate
that such accelerometer data has potential for use as a
practical, lightweight authentication system. Our re-
sults also lay the groundwork for future research in-
volving this dataset.
For future work, additional feature engineering
will surely be important. Here, we only considered
the raw accelerometer data and the most elementary
derived features. With respect to machine learning
and deep learning techniques, we believe that convo-
lutional neural networks (CNN) would be a viable ap-
proach to the problem—the accelerometer data has a
natural interpretation in terms of a 3-d image, and pre-
vious work has employed CNNs to authenticate users
based on sensor data (Singh et al., 2017).
REFERENCES
Alariki, A. A. and Manaf, A. A. (2014). Touch gesture
authentication framework for touch screen mobile de-
vices. Journal of Theoretical and Applied Information
Technology, 62(2):493–498.
Anderson, R. J. (2001). Security Engineering: A Guide to
Building Dependable Distributed Systems. John Wi-
ley & Sons, Inc., New York, NY, USA, 1st edi-
tion.
Bailador, G., Sanchez-Avila, C., Guerra-Casanova, J., and
de Santos Sierra, A. (2011). Analysis of pattern
recognition techniques for in-air signature biomet-
rics. Pattern Recognition, 44(10):2468 – 2478. Semi-
Supervised Learning for Visual Content Analysis and
Understanding.
Bishal Singha, T., Nath, R. K., and Narsimhadhan, A. V.
(2017). Person recognition using smartphones’ ac-
celerometer data. https://arxiv.org/abs/1711.04689.
Bradley, A. P. (1997). The use of the area under the
ROC curve in the evaluation of machine learning al-
gorithms. Pattern Recognition, 30(7):1145–1159.
Clark, G. D. and Lindqvist, J. (2014). Engineering gesture-
based authentication systems. https://arxiv.org/pdf/
1408.6010.pdf.
DreamArc (2019). Accelerometer. https://itunes.apple.com/
us/app/accelerometer/id499629589.
Fitbit, Inc (2019). Accelerometer Sensor Guide. https://dev.
fitbit.com/build/guides/sensors/accelerometer.
Ganesh, S. M., Vijayakumar, P., and Deborah, L. J. (2017).
A Secure Gesture Based Authentication Scheme to
A New Dataset for Smartphone Gesture-based Authentication
779

Unlock the Smartphones. In 2017 Second Interna-
tional Conference on Recent Trends and Challenges in
Computational Models (ICRTCCM), pages 153–158.
Google (2019). Firebase. https://firebase.google.com.
Guse, D. (2011a). Gesture-based User Authentication on
Mobile Devices using Accelerometer and Gyroscope.
Master’s thesis, Berlin Institue of Technology.
Guse, D. (2011b). Gesture-based user authentication on
mobile devices using accelerometer and gyroscope.
Master thesis, Technische Universit
¨
at Berlin.
Huang, C., Yang, Z., Chen, H., and Zhang, Q. (2017). Sign-
ing in the Air w/o Constraints: Robust Gesture-Based
Authentication for Wrist Wearables. In GLOBECOM
2017 - 2017 IEEE Global Communications Confer-
ence, pages 1–6.
Huang, J., Troia, F. D., and Stamp, M. (2018). Acoustic gait
analysis using support vector machines. In 4th Inter-
national Conference on Information Systems Security
and Privacy, ICISSP 2018, pages 545–552.
Imura, S. and Hosobe, H. (2018). A hand gesture-based
method for biometric authentication. http://www.
hosobe.org/wp-content/uploads/hcii2018.pdf.
Liu, C., Clark, G. D., and Lindqvist, J. (2017). Guessing
Attacks on User-Generated Gesture Passwords. Proc.
ACM Interact. Mob. Wearable Ubiquitous Technol.,
1(1):3:1–3:24.
Liu, J., Zhong, L., Wickramasuriya, J., and Vasudevan, V.
(2009a). uWave: Accelerometer-based personalized
gesture recognition and its applications. Pervasive and
Mobile Computing, 5(6):657 – 675. PerCom 2009.
Liu, J., Zhong, L., Wickramasuriya, J., and Vasudevan, V.
(2009b). uWave: Accelerometer-based personalized
gesture recognition and its applications. Pervasive and
Mobile Computing, 5:657–675.
Lu, D., Xu, K., and Huang, D. (2018). A data driven in-
air-handwriting biometric authentication system. In
IEEE International Joint Conference on Biometrics,
IJCB 2017, pages 531–537.
Meng, Y., Wong, D. S., Schlegel, R., and Kwok, L.-f.
(2013). Touch gestures based biometric authenti-
cation scheme for touchscreen mobile phones. In
Kutyłowski, M. and Yung, M., editors, Information
Security and Cryptology, pages 331–350.
Mitra, S. and Acharya, T. (2007). Gesture Recognition:
A Survey. IEEE Transactions on Systems, Man,
and Cybernetics, Part C (Applications and Reviews),
37(3):311–324.
Polamuri, S. (2017). SVM classifier implemen-
tation in Python with scikit-learn. http:
//dataaspirant.com/2017/01/25/svm-classifier-
implemenation-python-scikit-learn/.
Rabiner, L. R. (1989). A tutorial on hidden Markov models
and selected applications in speech recognition. Pro-
ceedings of the IEEE, 77(2):257–286.
Shlens, J. (2005). A tutorial on principal component analy-
sis. http://www.cs.cmu.edu/
∼
elaw/papers/pca.pdf.
Singh, M. S., Pondenkandath, V., Zhou, B., Lukowicz, P.,
and Liwickit, M. (2017). Transforming sensor data
to the image domain for deep learning - An appli-
cation to footstep detection. In 2017 International
Joint Conference on Neural Networks (IJCNN), pages
2665–2672.
Stamp, M. (2011). Information Security: Principles and
Practice. Wiley, 2nd edition.
Stamp, M. (2017). Introduction to Machine Learning with
Applications in Information Security. Chapman and
Hall/CRC, Boca Raton.
Sundaravaradhan, P. (2019). Gesture dataset. gestureData.
zip.
Suriya Prakash, J., Annamalai Vignesh, K., Ashok, C., and
Adithyan, R. (2012). Multi class support vector ma-
chines classifier for machine vision application. In
2012 International Conference on Machine Vision and
Image Processing, MVIP 2012, pages 197–199.
Yang, J., Li, Y., and Xie, M. (2015). MotionAuth: Motion-
based authentication for wrist worn smart devices.
In 2015 IEEE International Conference on Pervasive
Computing and Communication Workshops (PerCom
Workshops), pages 550–555.
Yang, L., Guo, Y., Ding, X., Han, J., Liu, Y., Wang, C.,
and Hu, C. (2015). Unlocking Smart Phone through
Handwaving Biometrics. IEEE Transactions on Mo-
bile Computing, 14(5):1044–1055.
ForSE 2021 - 5th International Workshop on FORmal methods for Security Engineering
780
