
Comprehensive Transcriptional Analysis Reveals Gene-specific
Transcriptional Variations in a Seed Plant, Arabidopsis thaliana
Kohei Negishi
1
and Kengo Morohashi
1,2
1
Department of Applied Biological Science, Faculty of Science and Technology, Tokyo University of Science,
2641 Yamazaki, Noda, Chiba 278-8510, Japan
2
Department of Biochemistry and Molecular Biology, Michigan State University, Lansing, MI 48823. U.S.A.
Keywords: Systems Biology, Genomics, Gene Expression, Stochastic Variation.
Abstract: The multicellular biological organism comprises a number of cells connected, while each cell independently
works. It seems to have a system to orchestrate a number of cells, like a parallel multi-agent intelligent system.
In such a biological system, gene expression of even identical genes within homogeneous cell populations is
varied due to a stochastic fluctuation of the transcriptional process. This gene expression variation (GEV) is
observed in development, cell differentiation, and environmental responses. Although the GEV has been
generally reported, a gene-specific GEV remains unclear. Using publicly available genome-wide gene
expression data from a model plant, Arabidopsis thaliana, we successfully identified two groups of genes
whose GEVs demonstrated consistently high and low. Analysis of 632 experimental conditions derived from
more than 1,300 microarrays revealed that 65 and 296 genes had high and low GEVs, respectively. We named
genes with the high GEV DOTABATA (DTBT), which means “romping about” in Japanese, and genes with
the low GEV PISHIPASHI (PSPS), which means “over-discipline” in Japanese. Gene function enrichment
analysis resulted that DTBT genes significantly enriched stress response genes. Our results suggest a gene-
specific GEV, and the regulation of GEV would be involved in biological processes.
1 INTRODUCTION
The multicellular organism comprises a number of
cells connected, while each cell independently works.
The connection is often dynamic and appropriately
responds to environmental stimuli. In particular, a
plant adapts to environments where it grows. Since a
plant does not have a central nervous system, plant
cells should be autonomously organized by one
another. This phenomenon inspires us to a parallel
multi-agent intelligent system.
Gene expression is a fundamental process for
various biological events such as development,
homeostasis, and response to environmental stresses
in biological organisms. The amount of gene
expression products shows a variation due to a
consequence of stochastic fluctuations occurred
during a process of gene expression (Elowitz et al.,
2002), which is called gene expression variation
(GEV).
The GEV produces a phenotypic variation that
benefits or hampers for fitness; therefore, living
organisms seem to utilize the GEV for an adaptation
(Fraser and Kaern, 2009; Raj and van Oudenaarden,
2008). The GEV is considered as a passive stochastic
fluctuation, and the degree of the GEV is uniformly
based on Gaussian distribution. However, regulation
of gene expression is orchestrated by a gene
regulatory network, which often plays a role as noise
reduction or amplification (Chalancon et al., 2012).
Since such modulation of the GEV by the gene
regulatory network requires high energy cost (Lestas
et al., 2010), a decisive role for the positive
contribution of the GEV is postulated.
The GEV is widely observed from prokaryotes
and eukaryotes and from unicellular to multicellular
organisms. Recent studies have shown the plant's
phenotypic variations, such as epidermal cell division
timing in the sepal and phyllotactic patterning (Araújo
et al., 2017; Besnard et al., 2014; Meyer et al., 2017).
If the GEV gives a stochastic fluctuation to the entire
system, the GEVs of entire genes would be equally
distributed. However, the degree of GEV of each gene
remains unclear.
We hypothesize that plants have a system to
manage the GEV in each gene with different degrees.
Negishi, K. and Morohashi, K.
Comprehensive Transcriptional Analysis Reveals Gene-specific Transcriptional Variations in a Seed Plant, Arabidopsis thaliana.
DOI: 10.5220/0010423905850590
In Proceedings of the 13th International Conference on Agents and Artificial Intelligence (ICAART 2021) - Volume 1, pages 585-590
ISBN: 978-989-758-484-8
Copyright
c
2021 by SCITEPRESS – Science and Technology Publications, Lda. All rights reserved
585
To identify the genes with different degrees of the
GEV, we applied a statistical approach. Arabidopsis
thaliana is an excellent model plant that provides
tremendous amounts of data, particularly omics data.
More than 1,000 accessions that are adapted to their
environments all over the world are available. A.
thaliana is a valuable resource to integrate
information from the molecular level to a worldwide
scale. By using such publicly available expression
data, we successfully identified the genes with high
and low GEVs. Moreover, we found that variances of
the gene expression correlated with the gene functions
and some ranges of temperature shift within a day and
a year.
2 MATERIALS AND METHODS
2.1 Screening of PISHIPASHI and
DOTABATA Genes and Gene
Functional Enrichment Analysis
The Arabidopsis Information Resource 10
transcriptome (TAIR10) annotation was used in this
analysis. Genome-wide gene expression data of
Arabidopsis thaliana was retrieved from ATTED
(http://atted.jp/download.shtml). The data contain
22,591 genes and 631 experimental conditions and
include the following accessions: Bay-0, C24, Col-0,
Cvi-0, Est, Kin-0, Ler-2, Nd-1, Shahdara, and Van-0.
Out of 631 conditions, 582 conditions involved
greater equal than two replicates (maximum four
replicates). We used genes which expression levels
were higher than an average of entire genes, resulting
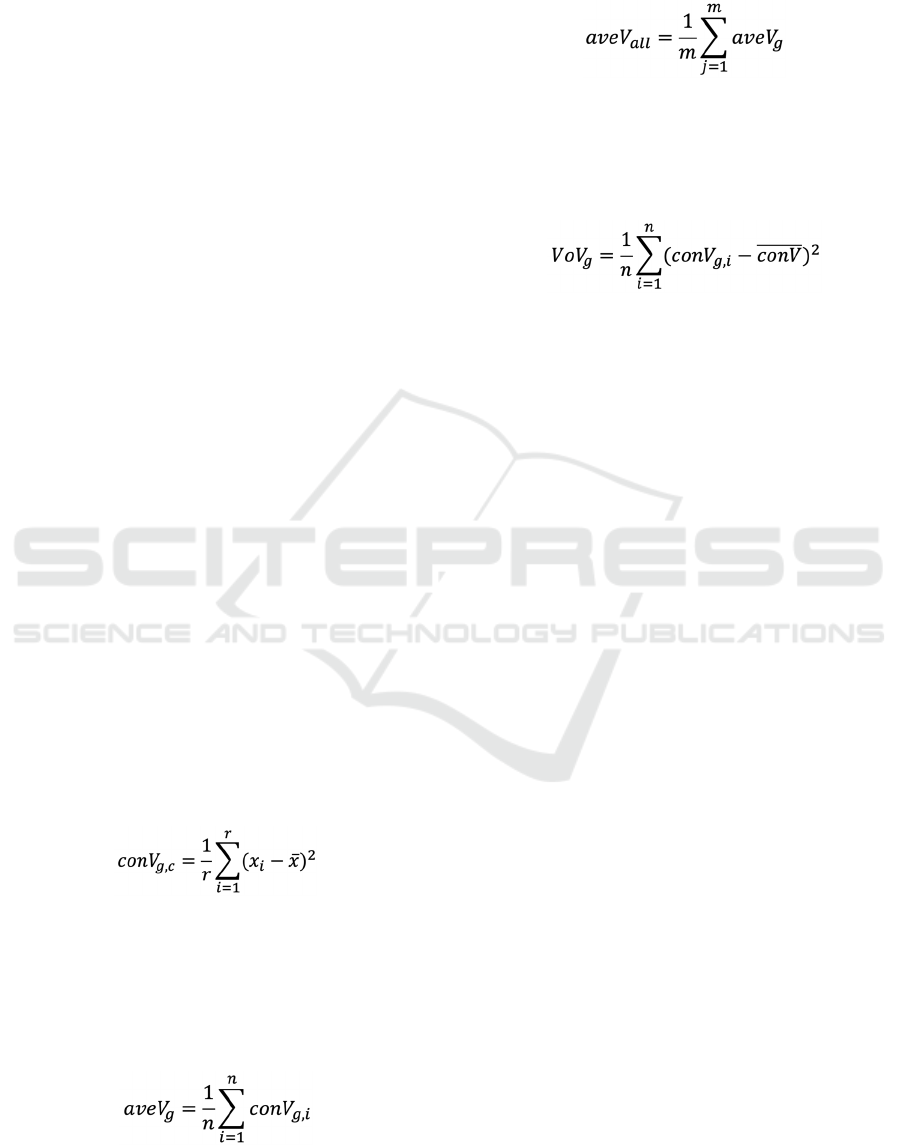
in 2,008 genes. Firstly, a variance of a gene 𝑔 in a
condition 𝑐 , referred to 𝑐𝑜𝑛𝑉
,
, was calculated as
followed.
where 𝑥 is the normalized expression value of the
gene 𝑖 , and 𝑟 is the number of replicates in each
condition 𝑐. In this study, the number of the genes and
the conditions were 2,008 and 582, respectively.
Average value of variances in each gene, referred to
𝑎𝑣𝑒𝑉, was calculated as followed,
Then, an average of entire variances was calculated as
followed.
where 𝑚 is the number of genes. By comparing 𝑎𝑣𝑒𝑉
with 𝑎𝑣𝑒𝑉
, we figured out how the gene expression
was fluctuated. 𝑉𝑜𝑉
, which is the variance of 𝑐𝑜𝑛𝑉
,
was calculated as
To identify DTBT and PSPS genes, the following
criteria were applied. In the case of DTBT, 𝑎𝑣𝑒𝑉
was lower than 𝑎𝑣𝑒𝑉
, and 𝑉𝑜𝑉
was higher than
one third of 𝑉𝑜𝑉.
Gene functional enrichment analysis was
performed by using Cytoscape with BiNGO plugin.
TAIR10 Arabidopsis thalaiana gene annotation was
used.
2.2 RNA Extraction and Quantitative
Reverse-transcription PCR
(qRT-PCR)
A. thaliana accessions (Col-0, Est, Kin, Cvi, and Van)
used in this study were obtained from Arabidopsis
Biological Resource Center (Ohio State University,
Columbus, OH, USA). Seeds were sterilized in a
solution of 50% commercial bleach (Kao, Singapore)
containing 6% sodium hypochlorite for 6 min,
followed by three washes with distilled water.
Sterilized 0.1% agarose solution was added to the
sterilized seeds, which were laid out on sterile filter
paper or 50% Murashige and Skoog (MS) plant salt
mixture (Wako Pure Chemical Industries, Osaka,
Japan) with 1% sucrose (Wako Pure Chemical
Industries) and 6% gellan gum (pH 5.9)(Wako Pure
Chemical Industries). The extracted RNA was
digested with DNase I (Sigma-Aldrich, St. Louis,
Missouri) and reverse transcribed using ReverTra
Ace® qPCR RT Kit (TOYOBO, Osaka, Japan). The
synthesized cDNA was amplified by qRT-PCR using
the THUNDERBIRD® SYBR® qPCR Mix
(TOYOBO, Osaka, Japan). Transcripts were
quantified using the
ΔΔ
Ct method.
SDMIS 2021 - Special Session on Super Distributed and Multi-agent Intelligent Systems
586
3 RESULTS
3.1 DOTABATA (DTBT) and
PISHIPASHI (PSPS) Genes
Constantly Show High and Low
GEVs, Respectively
The dataset we used in this analysis consists of more
than 1,388 publicly available microarray data derived
from 632 conditions. Out of them, 582 conditions,
each of which consists of replicates, were selected. A
gene expression variation (GEV) in experimental
replicates is supposed to come from biological and
technical variations. Since the data were collected
from diverse environmental conditions, the effect of
technical variations was expected to be much less
than those of biological variations (McCarthy et al.,
2012). Therefore, GEVs in this analysis are most
likely to be derived from the biological variations but
not technical ones. A low expression gene tends to
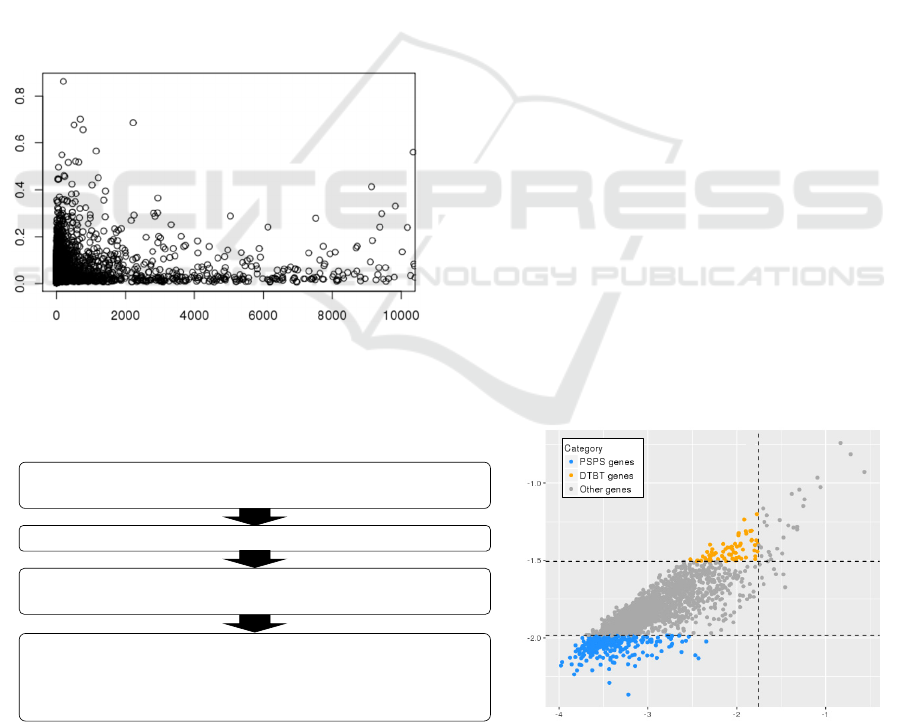
Figure 1: Scatter plot of gene expression and variance.
Average of express level was calculated the average of a
gene in all conditions. Average variance was calculated
variance of a gene in all conditions.
show high variation; therefore, before calculating the
variances, we assessed a relationship between
expression level and GEV to investigate whether low
expression genes show high variances. Indeed, the
plot of expression levels and variances of genes
suggests that genes with low expression levels show
high variances (Fig. 1). Therefore, to eliminate the
variances due to expression level per se, we selected
the genes with a higher level of expression than the
average of overall genes, resulting in 2,008 genes for
further analyses.
As a workflow shown in Fig 2A, we calculated the
variance of each gene from a single condition,
referred to conV. The conV is likely to show a
stochastic variation of gene expression from
biological replicates. Then, we calculated the average
variance of the gene, referred to aveV. The aveV
demonstrates how the gene expression was varied
compared to entire genes. Finally, we calculated the
variances of conVs, referred to VoV. The VoV shows
how the GEV was constant. When the VoV is low, the
GEV is likely to be constant, regardless the degree of
conV. Fig 2B shows a scatter plot of logarithm aveV
and VoV. Those two factors tend to show a positive
correlation. We attempted to find the genes with
constant conV, instead of just high conV, caused by a
particular condition such as environmental stimuli. To
search the genes with constant conV, we set criteria
combined of aveV and VoV as followed. As the first
criterion, we tried to eliminate variations derived
from specific conditions, we selected the genes with
lower VoV than average VoV of entire genes (Fig 2B).
We divided those genes into two gene groups with
high and low constant variances based on average of
conVs (Fig 2B). As a result, we identified 65 and 279
genes with constantly high and low GEVs,
Figure 2: A) A workflow for identifying genes with high or low GEVs. B) Scatter plot of aveV and VoV. Dashed lines marked
as 2, 3, and 4 indicate VoV= 0.017, aveV/3=0.010, and aveV=0.031. The dashed line 3 (aveV/3) was an average of variances’
cutoff value for screening PSPS genes (aveV/3 = 0.010), and the dashed line 4 (aveV) was for screening DTBT genes. Blue
and orange dots indicate PSPS and DTBT genes, respectively.
Normalized expression data of 582 conditions that contains replicates from
1,388 microarrays
Calculated average expression level of entire genes
2,008 genes with higher expression level than average of entire gene
expression
• Calculated variances, V
i,n; i=1 to 2,008; n=1 to 582
, of a gene in each condition
(conV
g,n
)
• Calculated averages of aveV
i
of a gene (aveV
g
)
• Calculated variances of variances, VoV
i; i=1 to 2,008
of a gene (VoV
g
)
log
10
(aveV)
2
4
3
log
10
(VoV)
AB
Comprehensive Transcriptional Analysis Reveals Gene-specific Transcriptional Variations in a Seed Plant, Arabidopsis thaliana
587
respectively (Fig 2B). We named the high variation
genes as DOTABATA(DTBT) after romping about in
Japanese and the low variation genes as
PISHIPASHI(PSPS) after over-discipline.
3.2 No Significant Difference in the
Gene Structures of DTBT and
PSPS Genes
We looked into a difference between DTBT and PSPS
besides variances, and we concluded that gene
structures in the genome do not contribute GEVs.
Loci of both DTBT and PSPS genes are evenly
located throughout the A. thaliana genome, and we
did not find any significant difference as to location
in the genome. To see whether or not GEV might be
affected the length of the genic region, we compared
the gene length of DTBT, PSPS, and other genes
based on TAIR10 gene model. As a result, the gene
length did not show significant correlations with
variances (Fig 3).
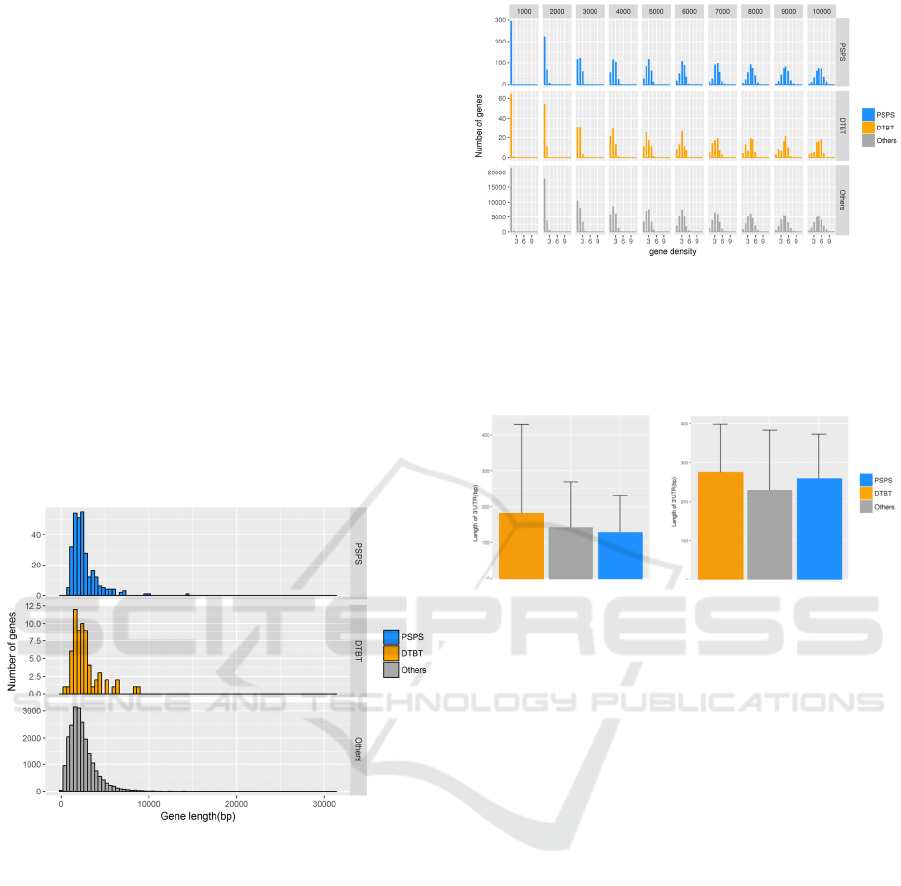
Figure 3: Distribution of gene length of PSPS, DTBT and
other genes. PSPS, DTBT and other genes are shown in
blue, orange and grey, respectively. Regarding the gene
length, there are no significant differences among classified
gene sets.
Since gene expression is often affected by a position
in the genome, we measured a gene density of around
where DTBT, PSPS, and other genes are located. The
results show no significant difference (Fig 4). Also,
when we compared the length of untranslated regions
(5’UTR and 3’UTR) among DTBT, PSPS, and other
genes, we did not find any significant difference (Fig
5). Taken together, the genome structure around
DTBT and PSPS genes is unlikely to contribute to the
characteristics of DTBT and PSPS genes.
Figure 4: Distribution of gene density within certain
window sizes. Window sizes are ranged between 1,000 bp
and 10,000 bp shown above of histograms. PSPS, DTBT
and other genes are shown in blue, orange and grey,
respectively. Regarding the gene density, there are no
significant differences among classified gene sets.
Figure 5: Average length of untranslated regions of DTBT,
PSPS and other genes. A) 5’UTR and B) 3’UTR. Error bar
shows standard deviation (n = 65 in DTBT; n = 279 in
PSPS; n = 21,919 in others). There is no significant
difference in any combinations.
3.3 GO Enrichment Analysis
Demonstrates Stress Response and
Housekeeping Genes in DTBT and
PSPS Clusters, Respectively
To assess gene functions of DTBT and PSPS genes,
we performed GO analysis, for which we calculated
enrichments of gene functions in DTBT and PSPS
genes. As a result, stress response genes were
statistically enriched in DTBT genes, whereas
housekeeping genes were enriched in PSPS genes
(P<0.001). In DTBT, the most enriched gene function
was a stress response. Other highly enriched gene
functions were also involved in response to abiotic
stress, such as temperature. On the other hand, PSPS
gene group enriched functions as a cellular metabolic
process such as proton transport, which functions to
maintain metabolic state in a cell (Fig 6).
SDMIS 2021 - Special Session on Super Distributed and Multi-agent Intelligent Systems
588
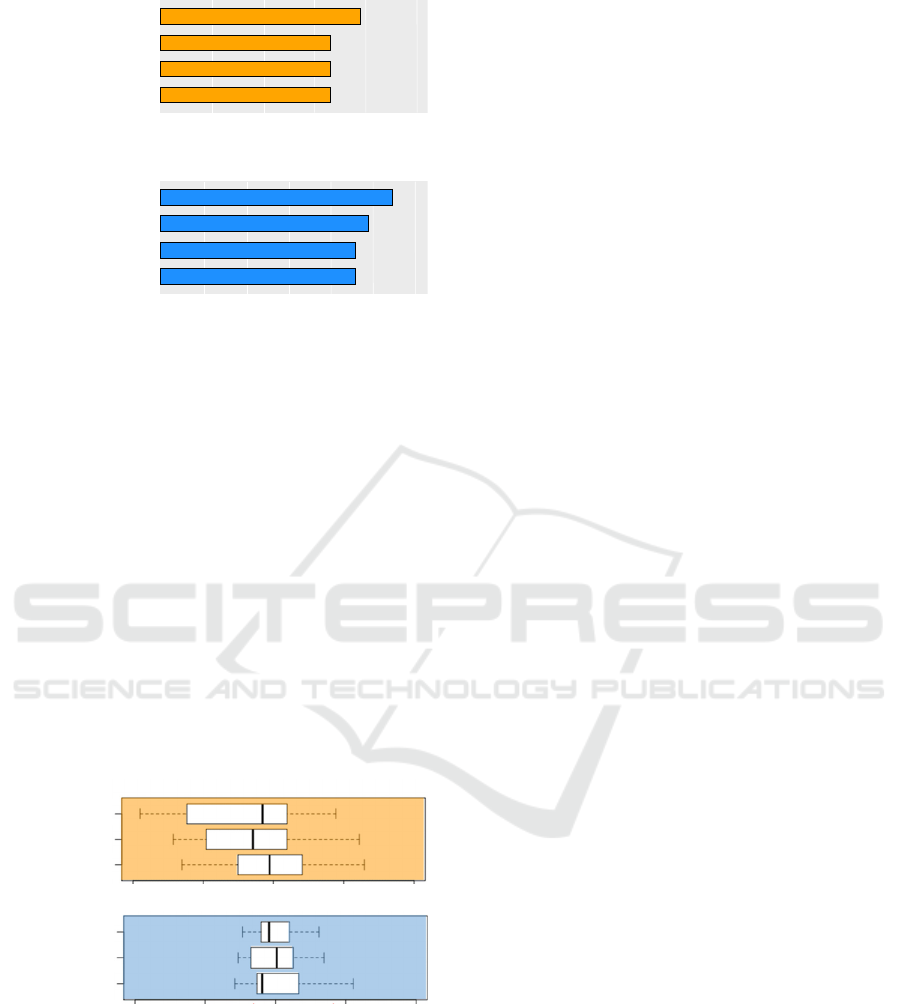
Figure 6: Gene functional enrichment analysis for DTBT
and PSPS genes. Bar charts show –log_10(corrected P-
value) of enriched gene functions of A) DTBT and B) PSPS
genes.
The result that DTBT genes enriched stress genes
brought us to wonder if our analysis might not work
since we attempted to exclude specific responses,
mainly from stress. We experimentally validated
DTBT and PSPS gene expressions. Six seedlings
were grown on a plate under a mild condition,
followed by RNA extraction from an individual plant
and measurement of the representative of DTBT and
PSPS gene expression. Figure 7 clearly show that the
DTBT genes were varied even in a homogenous
condition, whereas the GEVs of the PSPS genes were
constant, suggesting that while DTBT genes enriched
stress-related genes, expression of DTBT genes are
constantly varied without certain stimuli.
Figure 7: Experimental validation by quantifying gene
expression level of DTBT and PSPS genes. Box plots show
distribution of relative gene expression levels. RNA was
extracted from a single individual seedling. Six seedlings
were grown in same conditions. Relative gene expression
was normalized based on average expression as 1.0. (N=6).
4 DISCUSSION
This report successfully found the gene-specific GEV
even under a homogenous condition. We considered
the GEV as variations of transcript level in a genome-
wide manner. Living organisms need to gain fitness
in their surrounding environments. In particular,
unicellular organisms often appear phenotypic
variations. Since phenotype originated from how
genes involved in the phenotype are expressed,
phenotypic variations are partly related to the extent
of the number of transcripts derived from those genes.
Therefore, even though thermodynamic fluctuations
cause GEV, living organisms might utilize such
stochastic fluctuations in their fitness and eventually
their adaptation to their surrounding environments.
This hypothesis is not applied to only unicellular
organisms. In particular, a plant must adapt to its
environment, which is required more than animals
that can move. We hypothesized that plants have a
system to manage fluctuations of gene expression.
One can argue that the variances we calculated
were derived mainly from technical noises. However,
it is unlikely to be the case for the following reasons.
We chose substantial experimental conditions (582
conditions). These data set were derived from
unbiased research groups, and experimental
conditions were also unbiased. Therefore, differences
of values among replicates are likely to be from
biological ones, not technical ones. Gene expression
and variances are indeed relatively correlated,
particularly in the case of low gene expression.
Therefore, we used genes which expression levels
were higher than the average of entire genes.
Nevertheless, we observed that aveV and VoV were
positively correlated, suggesting a need for further
work to eliminate the effects of expression-variance
relationships.
If a gene responds to some stimulus, its expression
should be changed. Thus, when we compared gene
expression levels between unstimulated and
stimulated conditions, we see the difference,
suggesting the variances higher than non-responding
genes. Since we considered a constant GEV, we
ignored those genes. To do it, we calculated the
variance of variances. The conV from a single
condition indicates to what extent the gene expression
fluctuated. The variance of the conV, VoV, shows how
the fluctuations of gene expression are constant. The
high VoV might indicate stimulus-responding genes
since the gene expression variation differed in
experimental conditions. We tried to find the genes
that expression variation is constant; we defined a cut-
off VoV as the average VoV from entire genes. Even
A
B
Oxidative phosphorylation
Energy coupled proton transport, down
electrochemical gradient
ATP synthesis coupled proton transport
-log
10
(adjusted P-value)
2468 120
-log
10
(corrected P-value)
10
Cellular metabolic process
Response to temperature stimulus
Response to stress
123450
-log
10
(corrected P-value)
Response to stimulus
Response to abiotic stimulus
AT1G76490
AT5G16110
AT1G68490
DTBT genes
0.8 0.9 1.0 1.1 1.2
AT5G11770
AT4G26410
AT2G26590
PSPS genes
0.80.91.01.11.2
Relative gene expression
Comprehensive Transcriptional Analysis Reveals Gene-specific Transcriptional Variations in a Seed Plant, Arabidopsis thaliana
589

the genes show stable GEVs; they can be classified
based on a degree of variations. One is constantly
high variation, and the other is constantly low. DTBT
gene is former; PSPS is the latter.
5 CONCLUSIONS
In conclusion, our computational analysis using
publicly available large data sets explored that the
GEVs were observed in a gene-specific manner. This
study suggests that plants would manage a stochastic
fluctuation for their adaptations. In future work, we
plan to elucidate a mechanism of DTBT and PSPS
gene regulations. These findings would contribute to
the biological field, such as a phenotypic variation,
and the artificial intelligence field, such as a super
distributed and multi-agent intelligent system.
ACKNOWLEDGEMENTS
We thank S. Yasui (Tokyo University of Science) for
providing useful suggestions. We also thank S.
Okamoto for providing invaluable assistance in
conducting the experiments.
REFERENCES
Araújo, I.S., Pietsch, J.M., Keizer, E.M., Greese, B.,
Balkunde, R., Fleck, C., and Hülskamp, M. (2017).
Stochastic gene expression in Arabidopsis thaliana. Nat
Comms 8, 2132.
Besnard, F., Refahi, Y., Morin, V., Marteaux, B., Brunoud,
G., Chambrier, P., Rozier, F., Mirabet, V., Legrand, J.,
Lainé, S., et al. (2014). Cytokinin signaling inhibitory
fields provide robustness to phyllotaxis. Nature 505,
417–421.
Chalancon, G., Ravarani, C.N.J., Balaji, S., Martinez-Arias,
A., Aravind, L., and Babu, M.M. (2012). Interplay
between gene expression noise and regulatory network
architecture. Trends Genet 28, 221–232.
Elowitz, M.B., Levine, A.J., Siggia, E.D., and Swain, P.S.
(2002). Stochastic gene expression in a single cell.
Science 297, 1183–1186.
Fraser, D., and Kaern, M. (2009). A chance at survival: gene
expression noise and phenotypic diversification
strategies. Molecular Microbiology 71, 1333–1340.
Hijmans, R.J., Cameron, S.E., Parra, J.L., Jones, P.G., and
Jarvis, A. (2005). Very high resolution interpolated
climate surfaces for global land areas. Int. J. Climatol.
25, 1965–1978.
Lestas, I., Vinnicombe, G., and Paulsson, J. (2010).
Fundamental limits on the suppression of molecular
fluctuations. Nature 467, 174–178.
McCarthy, D.J., Chen, Y., and Smyth, G.K. (2012).
Differential expression analysis of multifactor RNA-
Seq experiments with respect to biological variation.
Nucleic Acids Res 40, 4288–4297.
Meyer, H.M., Teles, J., Formosa-Jordan, P., Refahi, Y.,
San-Bento, R., Ingram, G., Jönsson, H., Locke, J.C.W.,
and Roeder, A.H.K. (2017). Fluctuations of the
transcription factor ATML1 generate the pattern of
giant cells in the Arabidopsis sepal. eLife 6, e19131.
Raj, A., and van Oudenaarden, A. (2008). Nature, Nurture,
or Chance: Stochastic Gene Expression and Its
Consequences. Cell 135, 216–226.
SDMIS 2021 - Special Session on Super Distributed and Multi-agent Intelligent Systems
590
