
HOUDAL: A Data Lake Implemented for Public Housing
Etienne Scholly
1,2
, C
´
ecile Favre
1
, Eric Ferey
2
and Sabine Loudcher
1
1
Universit
´
e de Lyon, Lyon 2, UR ERIC, France
2
BIAL-X, France
Keywords:
Data Lake, Metadata System, Implementation, Enterprise Use Case.
Abstract:
Like all areas of economic activity, public housing is impacted by the rise of big data. While Business In-
telligence and Data Science analyses are more or less mastered by social landlords, combining them inside a
shared environment is still a challenge. Moreover, processing big data, such as geographical open data that
sometimes exceed the capacity of traditional tools, raises a second issue. To face these problems, we propose
to use a data lake, a system in which data of any type can be stored and from which various analyses can be
performed. In this paper, we present a real use case on public housing that fueled our motivation to introduce
a data lake. We also propose a data lake framework that is versatile enough to meet the challenges induced by
the use case. Finally, we present HOUDAL, an implementation of a data lake based on our framework, which
is operational and used by a social landlord.
1 INTRODUCTION
In the public housing sector, the use of data al-
lows social landlords to improve the management of
dwellings, as well as to better understand tenants.
Many use cases have already been dealt with in this
context (Scholly, 2019). Through Business Intelli-
gence (BI), data are organized within a data ware-
house, and then provide decision-makers (company
managers, management controllers, etc.) with dash-
boards enabling them to manage their activity. BI
analyses consist of “looking back” to manage one’s
business (Watson and Wixom, 2007). Data Science
methods applied to public housing can be used for de-
scriptive analyses, such as identifying groups of ten-
ants or dwellings, but also for predictive analyses,
for example, to predict non-payment or vacancy of
a dwelling. These analyses allow a better understand-
ing of one’s activity by “looking forward” (Mortenson
et al., 2015).
However, during the past ten years, the big data
revolution have changed the way economic sectors
extract knowledge from data (Gandomi and Haider,
2015; Assunc¸
˜
ao et al., 2015), and public housing is no
exception. New, often unstructured, data are emerg-
ing and can be exploited. This is particularly the case
with telephone calls (tenant complaints), or social net-
works. Open data are also increasingly in fashion,
especially geographical data, from which it is pos-
sible to obtain information on schools, services, or
the employment rate by geographic sector, for exam-
ple (Gandomi and Haider, 2015; Chen et al., 2014).
All this raises new challenges to be addressed.
The use of Data Science methods on a company’s
data is called Business Analytics (BA) (Chen et al.,
2012). Although Data Science methods used have
been around for a long time, the democratization of
BA is quite recent, so its definition remains relatively
unclear. Some authors believe that BA is an evolu-
tion of BI and tends to replace it (Mortenson et al.,
2015), while others consider that BI and BA comple-
ment each other and form a whole called Business In-
telligence & Analytics (BI&A) (Chen et al., 2012).
It is the latter position that we prefer. But instead
of using the term Business Intelligence & Analytics,
we prefer to introduce the notion of Data Intelligence,
which we define as “carrying out analyses, both sim-
ple and advanced, on all types of data, whether big
data or not”.
Authors have proposed architectures to combine
BI and BA in the general context of big data. (Baars
and Ereth, 2016) propose the concept of analytical
atoms, which they see as small, ready-to-use, au-
tonomous data warehouses. The interest of this notion
lies in the combination of analytical atoms, to form
what they call “virtual data warehouses”. (Gr
¨
oger,
2018) offers a fairly general data analysis platform,
based on the Lambda architecture, in which both
Scholly, E., Favre, C., Ferey, E. and Loudcher, S.
HOUDAL: A Data Lake Implemented for Public Housing.
DOI: 10.5220/0010418200390050
In Proceedings of the 23rd International Conference on Enterprise Information Systems (ICEIS 2021) - Volume 1, pages 39-50
ISBN: 978-989-758-509-8
Copyright
c
2021 by SCITEPRESS – Science and Technology Publications, Lda. All rights reserved
39

batch and stream data can be processed in their re-
spective layers. We believe these proposals make
sense from the perspective of combining BI and BA.
The authors propose architectures to capture data in
various formats, with the possibility of processing
them through different analyses.
These proposals have similarities with the notion
of data lake, where a data lake is a system in which it
is possible to store data of any type, without a prede-
fined schema, and from which various analyses can be
performed (Sawadogo et al., 2019b). In the absence
of a schema, the use of metadata is essential in order
to exploit the data lake. Without an efficient metadata
system, a data lake becomes unusable, and is called a
data swamp (Miloslavskaya and Tolstoy, 2016). The
notion of data lake is still relatively new and much
work is in progress, both on the theoretical definition
of metadata and on the concrete implementation of a
data lake. In addition, the metadata system greatly
influences the data lake’s framework, which is also a
matter of debate.
In our case, we rely on a real business use case that
highlights the problems inherent to achieving Data In-
telligence without the right tools. A project aiming to
marry BI and BA within the same scope was carried
out, but by using traditional tools. A number of lim-
itations have been reached, especially regarding the
storage of various data and the analyses of these data
by different methods. This allows us to show that the
use of a data lake could efficiently address these is-
sues.
In this paper, we propose to use our metadata sys-
tem named MEDAL (Sawadogo et al., 2019b), but re-
worked, in order to best meet the requirements of our
use case on public housing. With this metadata sys-
tem, we also propose a framework for data lakes that
we consider to be versatile and well suited for Data
Intelligence. By using this framework, users can inte-
grate all types of data and run various kinds of anal-
yses without giving the data lake a predefined shape.
Moreover, we introduce HOUDAL (public HOUsing
DAta Lake), a data lake implementation based on our
framework and adapted to our use case. This imple-
mentation allows users to create and manage metadata
in the data lake and to interact with data stored in the
lake.
This paper is organized as follows. Section 2
presents the state of the art on data lakes. Section 3
explains our use case about public housing. Section 4
presents our data lake framework. Section 5 details
HOUDAL, the implementation of our proposal. Fi-
nally, Section 6 concludes the document by present-
ing the perspectives of evolution and future work.
2 STATE OF THE ART
The term data lake was initially proposed by (Dixon,
2010). It defined a vast repository of raw and hetero-
geneous data structures fed by external data sources,
and from which various analytical operations can be
performed. After Dixon’s proposal, the term data lake
was quickly associated with specialized technologies
for massive data processing such as Apache Hadoop,
with low storage cost and better ability to handle large
volumes of data. However, this view is less and less in
vogue in the literature as most research teams have fo-
cused on Dixon’s definition (Miloslavskaya and Tol-
stoy, 2016; Gandomi and Haider, 2015).
Several other proposals have been made to define
a data lake (Miloslavskaya and Tolstoy, 2016). Two
main characteristics stand out: the variety of data and
the absence of a schema. This indicates that a data
lake can integrate all types of data and that it works
via a schema-on-read approach (i.e. data are stored
without a predefined schema). This second property
contrast with the schema-on-write approach of data
warehouses, where data are transformed before inser-
tion to match the schema defined upstream.
The most consensual and complete definition is
proposed by (Madera and Laurent, 2016). However,
we amended this definition by discussing some ele-
ments (Sawadogo et al., 2019b). From our perspec-
tive, a data lake is “an evolutionary system (in terms
of scaling) of storage and analysis of data of all types,
in their native format, used mainly by data specialists
(statisticians, data scientists, data analysts) for knowl-
edge extraction. Characteristics of a data lake include:
1) a metadata catalog that ensures data quality; 2) a
data governance policy and tools; 3) openness to all
types of users; 4) integration of all types of data; 5)
logical and physical organization; 6) scalability”.
Besides the definition of the data lake concept, a
lot of work has been carried out on the framework of
a data lake (Maccioni and Torlone, 2017; Hai et al.,
2016). Since the definition of the concept is not yet
totally consensual, and proposals of frameworks have
emerged in parallel to the concept, there are several
visions (Hellerstein et al., 2017; Halevy et al., 2016).
It should be noted that the framework of a data lake is
intimately conditioned by its metadata system.
Among framework proposals, some consider the
data lake only as an economical storage space for
massive data (Miloslavskaya and Tolstoy, 2016). In
this vision, the architectures are essentially based on
technologies such as Apache Hadoop, Azure Blob
Storage, or Amazon S3. We prefer to set aside this
view as is does not match our definition of a data lake.
A first framework, introduced in particular by (In-
ICEIS 2021 - 23rd International Conference on Enterprise Information Systems
40

mon, 2016), proposes an organization in data ponds.
The idea is to partition data in 3 ponds according to
their format: structured, semi-structured and unstruc-
tured. There exists variations, with for example a raw
data pond, an archived data pond, or a division of
the unstructured data pond by sub-formats (text data
pond, audio data pond, etc.) (Sawadogo et al., 2019a).
Other frameworks prefer to divide the data lake
into zones (Ravat and Zhao, 2019). The zones re-
fer to the “refinement level” of data: raw data (i.e.,
as ingested in the lake, data remain in the raw data
zone, while reworked data are placed in the processed
data zone, and ready-to-use data are in the access data
zone). Other authors refer to these zones as bronze,
silver, and gold, respectively (Heintz and Lee, 2019).
Finally, authors and we propose a framework
based on data semantics (Diamantini et al., 2018;
Sawadogo et al., 2019b). Here, the idea is to group
data according to their meaning. The authors and we
introduce the term object, designating a homogeneous
set of information. An object can group several ver-
sions and representations of the same set of data, to
track whether data have been updated or transformed
by an user. Moreover, by crossing data from differ-
ent objects, it generates a new object, with different
semantics.
While these frameworks are relevant and address
the issues identified by their authors, they impose a
predefined shape to the data lake (e.g., by organizing
data according to their structure, refinement or seman-
tics). We believe this is contrary to the schema-on-
read approach of data lakes.
Let’s consider the following example. A com-
pany having a lot of textual documents is interested in
extracting structured descriptors (e.g., bag of words
or term-frequency vector) for computing documents
similarity. To this end, both textual documents and
descriptors are stored in a data lake. Let us distinguish
between the three cases listed above. If the company
organizes its data lake through:
• Data structure, and thus creates data ponds within
the lake: textual documents are in the unstructured
data pond, while descriptors are in the structured
data pond;
• Data refinement, and thus creates zones within the
lake: textual documents are in the raw data zone,
while descriptors are in another zone (for exam-
ple, process data or access data);
• Data semantics, and thus creates data objects
within the lake: the descriptors remain in the same
object, meaning that textual documents and their
descriptors are in the same object.
We observe from the example, that depending on the
framework chosen for the data lake, data are put in
different areas inside the data lake. As a result, the
lake’s usage will be different according to the frame-
work chosen. We believe the proposals are too spe-
cific and thus we propose a more general framework
that avoids giving a predefined shape to the data lake.
This will be detailed in Section 4.
3 PUBLIC HOUSING USE CASE
The use case, anchored in the business issue of pub-
lic housing, was initially carried out in a Data Intelli-
gence consulting company without using a data lake.
Named Projet Etat Des Lieux (EDL) (i.e., “inventory
of fixtures project” in English), the goal is to study a
social landlord’s data in order to provide two predic-
tions regarding the departure of tenants.
The first study seeks to predict whether the equip-
ment of a dwelling might be degraded when a ten-
ant leaves, and thus planning an exit visit or not. In-
deed, it is frequent that an agent of the landlord trav-
els to carry out the exit visit, but if the dwelling is
in good condition, no compensation will be requested
from the outgoing tenant. If this is the case, the visit
is “useless” and the landlord loses money, since an
agent’s travel is not cost-free. The objective of this
prediction is thus to identify in advance the dwellings
that present a high probability of having degraded
equipment for which the landlord could ask the outgo-
ing tenant for an indemnity, thus making the agent’s
visit useful and profitable.
A second similar study was conducted, to predict
whether any repairs to the dwelling will be required
at the tenant’s departure before it can be rented again.
The objective of this prediction is to reduce dwelling’s
vacancy period and be able to anticipate the works by
ordering them before the tenant’s departure. Indeed,
if the observation is made on departure of the tenant
that works need to be done, the housing cannot be
re-rented immediately. It is necessary thus to count
the duration of the order of the works and the time of
these works. If the works are ordered in advance, they
can begin as soon as the tenant leaves, which reduces
the period of vacancy of the dwelling and thus reduce
the losses of the landlord.
In parallel to these predictive analyses, data are
inserted into a reporting tool, in which a small data
warehouse is modeled through a star model, in or-
der to conduct BI analyses. Once the forecasting is
done, the results are also inserted into the dashboard,
to combine them with the star model and return it to
the landlord. With this dashboard, the landlord can
easily use the results of the two predictions and thus
HOUDAL: A Data Lake Implemented for Public Housing
41

better visualize the dwellings presenting risks in terms
of damaged equipment or works to be planned when
the tenant leaves.
Since this project did not use a data lake from the
beginning, many problems appeared when trying to
do Data Intelligence. We distinguish 4 main problems
that cannot be easily handled by traditional systems
such as data warehouses or notebooks.
Multiple Data Formats. Data used to complete
this project are essentially structured data in CSV
format. The social landlord sent these files, which
are extracted from its information system through
queries. Nevertheless, the studies carried out through
this project have generated new data in a wide variety
of formats (e.g., files in .RData and .pkl format for
R and Python analyses ; .png images generated with
predictive models ; PowerBI reports in .pbix ; and
project tracking documents in .ppt and .docx, among
others). Storing data in a variety of formats is always
a challenge. This results in data being scattered in
different environments, which can quickly complicate
things for data specialists. With a data lake, this prob-
lem no longer exists because all data are in one place.
Multiple Types of Analysis. This project involved
several data specialists: data scientists for building
predictive models and BI consultants for designing
the reporting dashboard. These two types of profiles
do not work with the same tools and methods. Having
to integrate the forecasting result into the star model
in the BI reporting tool was a complicated task. Be-
sides, for BA analyses alone, the project was carried
out in several environments and technologies (e.g.,
the data cleansing was done in R, the first predictions
in a Jupyter notebook and the second predictions in
Python). Combined with the fact that data is scattered,
this complicates things even more since analyses are
saved in different places and performed in different
programming languages. By using a data lake, it is
much simpler to track which processes use and gen-
erate which data.
Data Lineage. The social landlord sent data from
queries performed on their internal data warehouse,
so the provided data were sometimes redundant,
and/or not complete. As a result, there were several
versions of a file, with some versions being used by
some scripts and not others. With both data and anal-
ysis scattered around, it is not easy to know what data
are being used, by whom, what, and how. Since we
also have very little information about potential re-
dundancies between data and treatments, the informa-
tion is limited to file names or comments in the code.
This would not be a problem when using a data lake,
since data lineage is recorded within metadata.
Skills Transfer. Finally, the three problems men-
tioned above make it difficult, without the help of the
data specialists who actively took part in the project,
to understand the progress of the project, to know
what data have been exploited, by what, for what pur-
pose, and so on. In our case, it took several explana-
tory meetings with the different actors of the project
in order to have a clear and precise vision of what was
done in the project, whether in a detailed way (file by
file) or in a more general way (goals).
If the project were conducted within a data lake,
merely exploring the metadata would have avoided
these time-consuming and ultimately not useful meet-
ings. The use of a data lake makes it possible to han-
dle these issues, which are difficult to manage with
conventional tools. Because of this, we consider rele-
vant the use of a data lake for this type of Data Intel-
ligence projects.
4 FRAMEWORK FOR DATA
LAKES
In this Section, we now detail our approach to the es-
tablishment of the data lake, by presenting the meta-
data system and the framework of the data lake.
4.1 Metadata System
The metadata system is the keystone of a data lake,
and guarantees its proper functioning. In the ab-
sence of an effective metadata system, the data lake
becomes unusable and is then referred to as a data
swamp. Several proposals have been made for the
metadata system of a data lake. As discussed in Sec-
tion 2, the metadata system greatly influences the
framework of the data lake. Thus, the choice of the
metadata system is crucial, and the use case we are
dealing with will also influence this decision.
As mentioned in Section 3, our use case mostly
concerns structured data, which are then reworked
through various data wrangling operations. How-
ever, reworked data often end up being stored in not
very common formats, such as .RData or .pkl files.
These unconventional formats are considered as un-
structured data by most tools, because the files can
only be exploited by the right tools (in this case, R
for .RData files and Python for .pkl files). We there-
fore consider that an approach based on data structure,
with the implementation of data ponds, is not relevant
in our case, since the variety of data formats may cre-
ate ambiguities.
As far as the zones are concerned, source data
in their original format (.csv) would fill the raw data
zone, and the final dashboard would be in the access
ICEIS 2021 - 23rd International Conference on Enterprise Information Systems
42

data zone. These two zones would be sparingly filled
compared to the process data zone, which would con-
tain most of the data, with multiple formats. Thus,
we believe that distinguishing data according only to
their degree of refinement is not the best idea in our
use case. Ultimately, this leaves us with the option of
using a framework based on data semantics.
We conducted a study on metadata systems, iden-
tifying 6 key functionalities that the metadata sys-
tem of a data lake must be able to manage in or-
der to overcome the problems associated with big
data (Sawadogo et al., 2019b). This study showed that
apart from our metadata system, namely MEDAL, no
other system offers the 6 key functionalities, the most
complete systems implementing only 5 of the func-
tionalities. Moreover, MEDAL is a metadata system
based on data semantics, which best suits our con-
straints. Thus, we consider that MEDAL is the most
relevant metadata system to use for our data lake.
MEDAL is based on the concept of object, which
designates a set of homogeneous information, as well
as a metadata typology in three categories: intra-
object, inter-object and global metadata. Intra-object
metadata refer to metadata associated with a given ob-
ject, while inter-object metadata are about relation-
ships between objects, and global metadata add more
context to all the data lake’s metadata (Sawadogo
et al., 2019b).
For our data lake, however, we have reworked
MEDAL. The main change lies in the introduction
of three main concepts, that generalizes some of
MEDAL’s. The first concept is data entity, that gen-
eralizes versions and representations of an object in
the sense of MEDAL. A data entity can represent a
spreadsheet file, an image, a database table, and so
on.
The second concept is grouping, which is a set of
groups, and data entities can be gathered into groups.
For example, we can reproduce the object notion of
MEDAL, by creating a grouping “semantic object”,
each group of this grouping being an object in the
sense of MEDAL. Note that it is possible to have
several groupings, thus enabling, among other things,
to gather data entities according to their structure or
zone if such groupings are needed. Thanks to this, it
becomes possible to reproduce classic frameworks as
presented in Section 2.
Lastly, the third concept is process, which general-
izes the MEDAL’s notions of transformation, update
and parenthood relationship. It refers to any trans-
formation applied to a set of data entities and that
generates a new set of data entities. With processes,
data lineage can be tracked, allowing the data process-
ing chain to be monitored. A process can represent a
script or a manual operation made by an user.
Let’s illustrate with an example. A CSV file is
stored in the data lake, thus creating a data entity in
the metadata system. This file is then processed by a
data cleansing script: a second file with cleaned data
is generated, and also stored in the data lake. Thus,
a second data entity is also created, as well as a pro-
cess representing the script. The two data entities are
connected by this process. Besides, if a grouping on
zones is created, then the first data entity is in the “raw
data zone” group, while the second one belongs to the
“processed data zone” group.
For further reading, a complete presentation of
this evolution of MEDAL, named goldMEDAL, was
the subject of additional work (Scholly et al., 2021).
4.2 Framework
A data lake, in its simplest form, is composed of two
main parts: the data storage area, which can store any
type of data, and the metadata system, that describes
data stored in the lake and help users navigate inside
the data lake. However, to ease the user experience,
we believe that it is relevant add two other layers, con-
cerning respectively data ingestion and data analysis.
As discussed before, a data lake can store any type
of data, in its raw format. But to do so, an efficient
metadata system is mandatory. However, if users have
to enter all metadata manually, even the most efficient
metadata system can become very tedious to use. This
is where the data ingestion layer comes into play: its
goal is to facilitate metadata creation by automatically
generating as much metadata as possible, allowing
users to quickly validate or invalidate metadata and
move on.
Data stored in the lake are not only meant to be
stored, but also analyzed. All types of data analysis
can be considered, but since our final goal is to com-
bine BI and BA within Data Intelligence, we focus
on the presence of BI and BA analysis. Among these
analyses, we are particularly interested in the creation
of “advanced indicators” through BA methods (for
example with machine learning), which then enrich
BI analyses, whether at the data warehouse level or
directly in dashboards. To illustrate the notion of ad-
vanced indicator, our use case is a perfect example:
once predictions are made, they are recorded in the
BI dashboard, and cross-referenced with data in the
star model. This gives us an example of BA analyses
that enrich BI analyses. It is important to note that
since the data lake can contain reworked data, it can
also contain a data warehouse and/or dashboards.
Our proposal of a data lake’s framework combines
data ingestion, storage, analysis, and the metadata
HOUDAL: A Data Lake Implemented for Public Housing
43

system. Firstly, data are extracted from sources, and
go through the ingestion layer. There, metadata are
created and stored in the metadata system, while data
are saved in the storage area. Then, users can browse
metadata to find useful data, and run either BI or BA
analyses on them thanks to the data analysis layer. In
the end, if an analysis generates new data, it is possi-
ble to store it back into the data lake: in this case, data
go through the ingestion layer, in order to create meta-
data, and so on. This is referred to as “back-feeding”
the data lake.
The schema-on-read property of a data lake im-
plies that the data schema is specified at the query.
That is why data lakes operate in Extract - Load -
Transform (ELT) mode, which is opposed to the Ex-
tract - Transform - Load (ETL) mode typical of data
warehouses, where data are transformed before being
loaded. In the data lake, data are not transformed be-
fore it is stored, but only at query time.
In our case, to best describe our framework, we
prefer to say that the data lake works in EDLT(L):
• Extract: data are extracted from sources;
• Describe: to-be-inserted data are described by
metadata;
• Load: data are stored in the data lake, without any
modification;
• Transform: when queried by the user, data are
modified as required;
• (Re)Load: if the user wishes to save the result of
his analysis, he can “back-feed” the lake and save
the transformed data, along with the input of ade-
quate metadata.
By adding the Describe step, we emphasize the im-
portance of metadata, and that it must be generated
before storing the data in the data lake. Saving data in
the data lake without capturing the associated meta-
data is a significant risk of losing track of them and
quickly turning the lake into an unusable swamp. Fur-
thermore, with the (Re)Load step, we insist on the
fact that the data lake must be the central piece of
the whole data analysis chain. Of course, data are
first extracted from sources outside the lake; however,
when the user reworks data from the lake, whether
through BI or BA analyses, the results may have to be
stored in the lake. Thus, for these reworked data, the
framework “restarts” at the Describe step. Figure 1
summarizes this approach in a schematic way.
To illustrate the framework, we refer to the use
case. First, data sent by the landlord are ingested into
the data lake. Data scientists then process data, and
back-feed the data lake with these reworked data, as
well as the transformation scripts. In the end, the two
predictions are made, and then exploited in a BI dash-
board. With all this, we have a perfect example of
the creation and exploitation of advanced indicators,
as presented before.
Placing the data lake as the central piece of the
knowledge extraction from data chain gives us several
advantages. Firstly, it is one of the fundamental prop-
erties of the lake, i.e. the ability to store of all types of
data in their native format, that benefits us. Indeed, we
store in the lake both raw data sent by the landlord, re-
worked data, predictive models, dashboards, but also
project tracking documents. This centralized storage
of all data also means data are not scattered and envi-
ronments are not multiplied. This was a major issue
for our use case without the data lake, and it is quite a
common problem, whether in BI or BA projects: the
data as well as the processes can be stored locally on a
computer, or on the company server, or on a cloud, or
to be retrieved directly on a client’s virtual computer,
and so on.
An additional advantage is that metadata must be
entered directly when data are inserted into the data
lake. Indeed, whether for BI or BA projects, there
are several ways to generate post-project documenta-
tion. For example, in BI, DataGalaxy
1
provides an
ergonomic data catalog to manage data governance.
On the other hand, having to maintain this documen-
tation after the project has been set up is an expen-
sive, error-prone task, in addition to being tedious,
and therefore rarely done properly. With the data lake,
data governance is done upstream : we can define this
as “on-write data governance”, and there is little need
to maintain this information afterwards.
5 HOUDAL DATA LAKE
After explaining in detail the framework of our data
lake, we now present how we implemented HOUDAL
to address the issues of our use case, and to validate
the efficiency of our framework.
5.1 Selection of Technologies
Although the concept of a data lake is still relatively
recent, and there is no consensus yet on the architec-
ture that a data lake should have, there are already
several tools and technologies available to implement
this type of solution. We therefore conducted a study
to identify which tools could be used to meet the re-
quirements of our use case and remain the most faith-
ful to our vision of the data lake and its framework.
1
https://datagalaxy.com
ICEIS 2021 - 23rd International Conference on Enterprise Information Systems
44
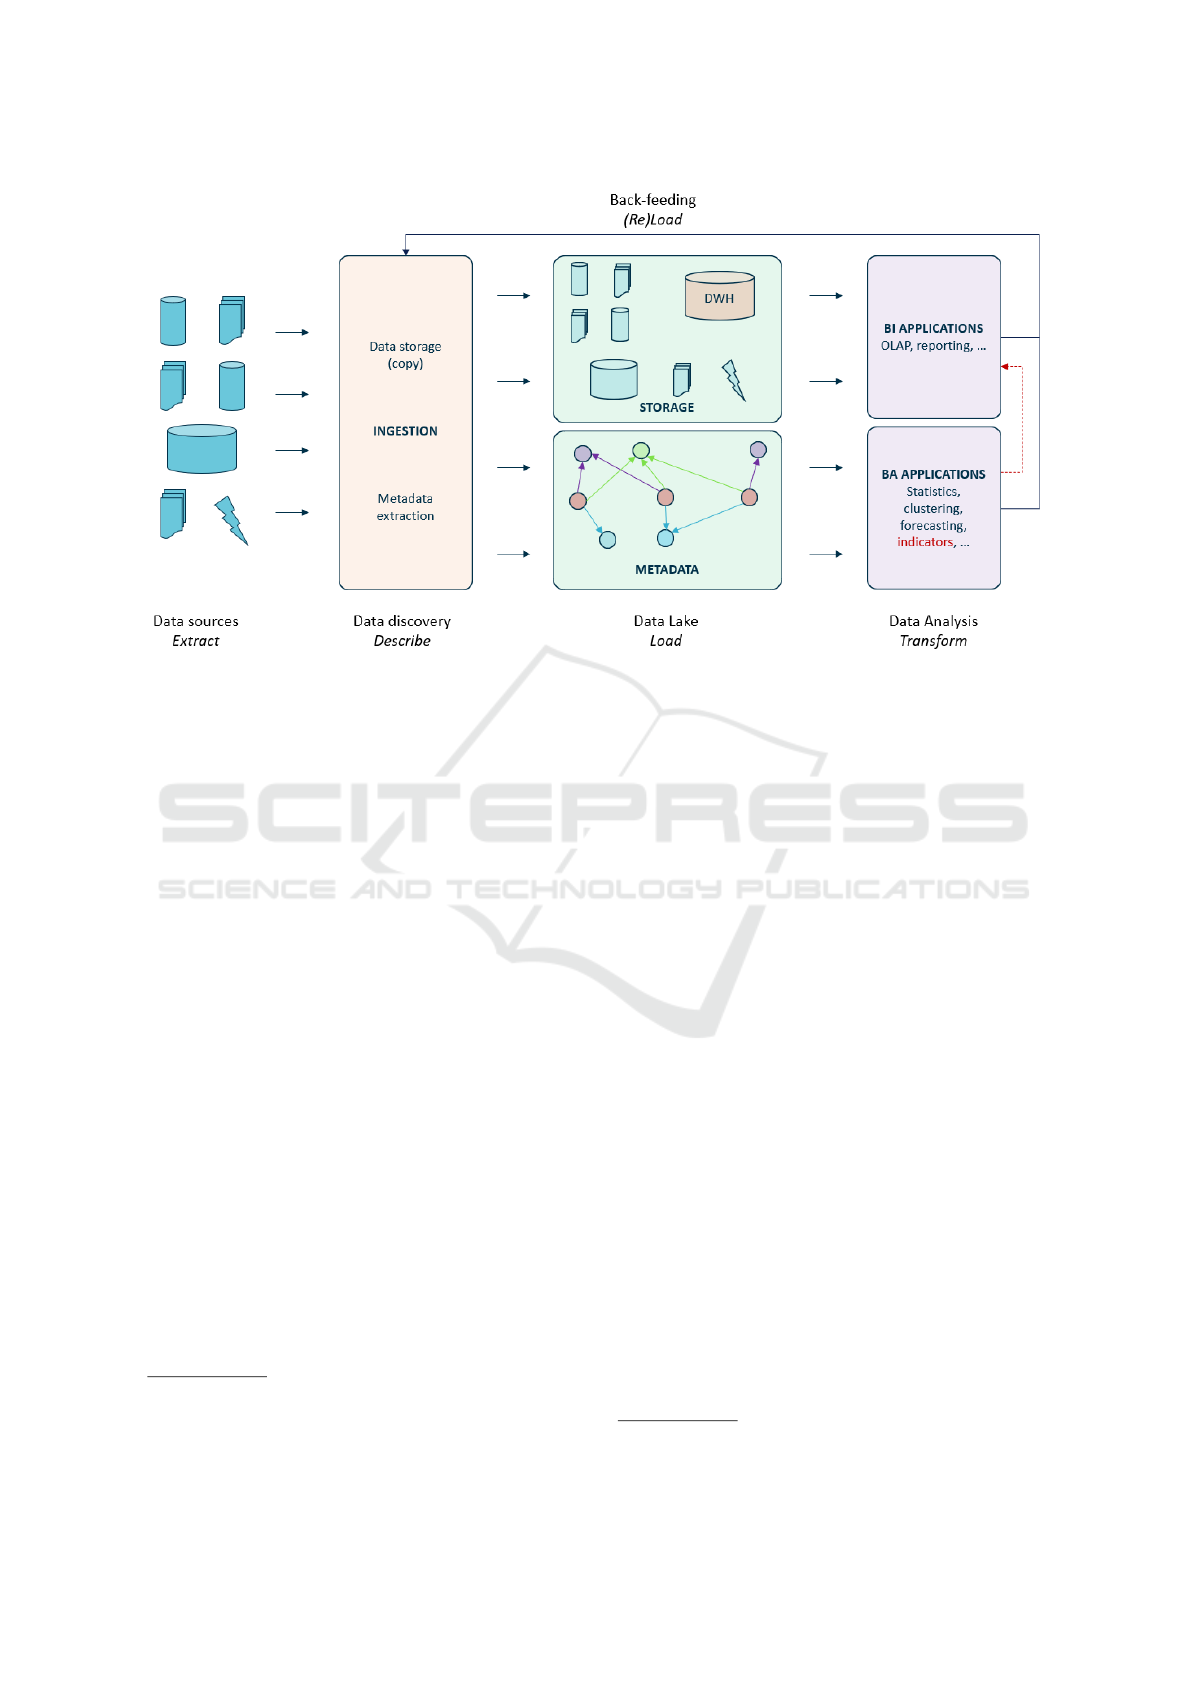
Figure 1: Proposed data lake’s framework.
We have identified four possible ways to implement
the data lake.
All-in-One Tool. The first is to use all-in-one tools,
such as Apache Kylo
2
. This is defined as “a self-
service data lake management software platform for
data acquisition and preparation with integrated meta-
data management”. Both data storage and analysis are
handled with Kylo, as well as the metadata system.
However, this option was abandoned for three main
reasons. First of all, the metadata system proposed
by Kylo is not exhaustive enough to let us implement
our goldMEDAL-based metadata system. Also, Kylo
is mainly oriented to manage structured data. Al-
though we mainly have source data in .csv format in
our use case, this becomes problematic when dealing
with files of various formats. The last reason con-
cerns data analysis: the data preparation part of the
tool is certainly interesting, especially in our case, but
as far as more advanced analyses (BI and BA) are con-
cerned, we would have had to manage them outside
Kylo. This would have had several unattractive con-
sequences, such as managing metadata outside Kylo.
Proprietary Clouds. The second option consid-
ered is to use proprietary clouds, such as Microsoft’s
Azure
3
or Amazon’s AWS
4
. Both have the main ad-
vantage of offering a wide range of services, allow-
ing one to ingest all types of data, manage metadata,
and conduct all types of data analysis. Users can
2
https://kylo.io/
3
https://azure.microsoft.com/
4
https://aws.amazon.com/
stay in the same ecosystem for all their needs, and
no longer have to worry about deploying the proper
server. However, having everything in the cloud, and
services for everything, also turns out to be a disad-
vantage. Firstly, if developments have already been
made, then they have to be migrated to the appro-
priate services within the cloud, which can be very
time-consuming. Besides, we noticed that these pro-
prietary clouds are not flexible: in particular, the ser-
vices for metadata management lacked completeness
on certain aspects, and we would have liked to be
able to make some modifications to them to match
our expectations better, but this turned out to be im-
possible. Finally, proprietary clouds are pay-per-use,
which slowed us down for a first proof of concept.
However, for future work on larger use cases or with
different needs, they might be reconsidered.
Hadoop Ecosystem. A third option explored is about
using an ecosystem from the world of big data open
technologies, such as Apache Hadoop
5
. Like pro-
prietary clouds, Hadoop comes with its own ecosys-
tem, and a lot of services are available to ingest data,
store data (especially with the Hadoop Distributed
File System, HDFS), manage the metadata system and
run different types of data analysis. In particular, the
metadata system Apache Atlas is very interesting, and
seems to be complete enough for us to implement
our metadata system. Nevertheless, following pre-
liminary tests, this solution was finally not retained.
On the one hand, HDFS is suitable for large files, but
5
https://hadoop.apache.org/
HOUDAL: A Data Lake Implemented for Public Housing
45

not for small files, which we have in large quantities
in our use case. On the other hand, installing an en-
tire Apache Hadoop ecosystem is a very long, com-
plex process, and requires specific skills, in addition
to the need for hardware resources to run the cluster
properly. Furthermore, these open source technolo-
gies evolve very quickly, and it is necessary to keep a
watchful eye on new developments, but also to keep
the cluster up to date, which takes time and can some-
times be a complicated task. Finally, in our vision
of the data lake, we consider that an Apache ecosys-
tem is welcome when there is a need to manage large
amounts of data, but this was not an issue in our use
case. Integrating an HDFS storage area into the data
lake, as well as some associated services, may how-
ever be a very interesting topic for future work.
From Scratch Development. Finally, the last way
studied is to develop our data lake from scratch, in
other words to take tools and technologies apparently
with no direct link and assemble them to form our
data lake. Although it is a risky gamble, this is the so-
lution we have chosen, in particular to have as much
flexibility as possible in the implementation of the
metadata system, but also to remain as faithful as pos-
sible to our vision of the data lake. Using already ex-
isting technologies and/or being part of an ecosystem
meant that we ran the risk of seeing these tools evolve
over time, possibly in a direction that might one day
no longer suit our vision of the data lake. In addi-
tion, developing a system from scratch gives us the
possibility to have a more complete control of it and
to be able to make it evolve as we wish, according to
the future use cases we might have to deal with. Fi-
nally, considering the limited volume of data in our
use case, using relatively simple technologies was the
best choice to make.
5.2 Technical Architecture
HOUDAL (public HOUsing DAta Lake), our imple-
mentation of the data for public housing, is based on
a web application. It has two major parts: the front-
end, or client part, which we can refer to as the user
interface, and the back-end, or server part, which is
broken down into various services, namely the API,
the metadata system, the data storage, and the user
management service.
User Interface. HOUDAL is operated through a user
interface. Users can connect to the interface and then
interact with the data lake. They can consult and ex-
plore existing metadata, with a search bar among oth-
ers. Files stored in the lake can be downloaded. In
addition, it is also possible for users to create new
metadata, but also to add new files to the data lake.
For this, a form is available, with which the user up-
loads the file. During this process, metadata are en-
tered semi-automatically : some information, such as
file name, size or format are extracted automatically,
while others have to be entered manually by the user,
such as a description. Once the file upload has been
validated, data are saved in the storage area, and meta-
data are created. From a technical standpoint, the user
interface has been developed in ReactJS.
API. Through requests methods, the user interface
communicates with an API. For any action made by
the user on the interface, it generates a request that
is sent to the API. The API then queries the applica-
tion’s various services, such as the metadata system,
and returns the results of this query to the interface in
response to the user’s request. This API has been de-
veloped in NodeJS. Moreover, HOUDAL works with
an identification system: the user must log in to ac-
cess the data lake. Besides, some pages of the inter-
face are reserved for users with an administrator role.
The information about the users is saved in a Mon-
goDB collection. Note that a MongoDB database is
not a necessity, and this may change in the future.
Metadata System. Since our metadata system is
based on goldMEDAL, which has a graph-based rep-
resentation, we store the data lake’s metadata in a
Neo4J
6
graph database. The database is accessed
only by the API, whether to consult existing metadata
or to create new ones. Data entities are nodes, and
are linked to each other through processes, or con-
nected to groups. Having all the metadata in a sin-
gle database is an advantage because it simplifies API
calls.
Storage Area. In our case of use, we only deal
with files so there is no database to manage (although
database data can also be considered as files). This
implies that for the storage area of HOUDAL, we did
not need anything other than a directory of a conven-
tional file system to store our data. Note however, that
this practice, although sufficient in our specific case,
is limited and could be problematic in other use cases.
This is discussed in more detail in the following sub-
section.
A screenshot of HOUDAL’s management inter-
face is presented in Figure 2. The interface allows
users to create different types of metadata. To this
end, the different buttons at the top of the screen redi-
rect users to pages containing forms to create meta-
data. Moreover, the interface provides a search bar,
where the user can perform a keyword search in data
entities. On the screenshot, the user has searched for
the keyword “solicitation”. The interface then pro-
vides the user with all data entities containing this
6
https://neo4j.com
ICEIS 2021 - 23rd International Conference on Enterprise Information Systems
46
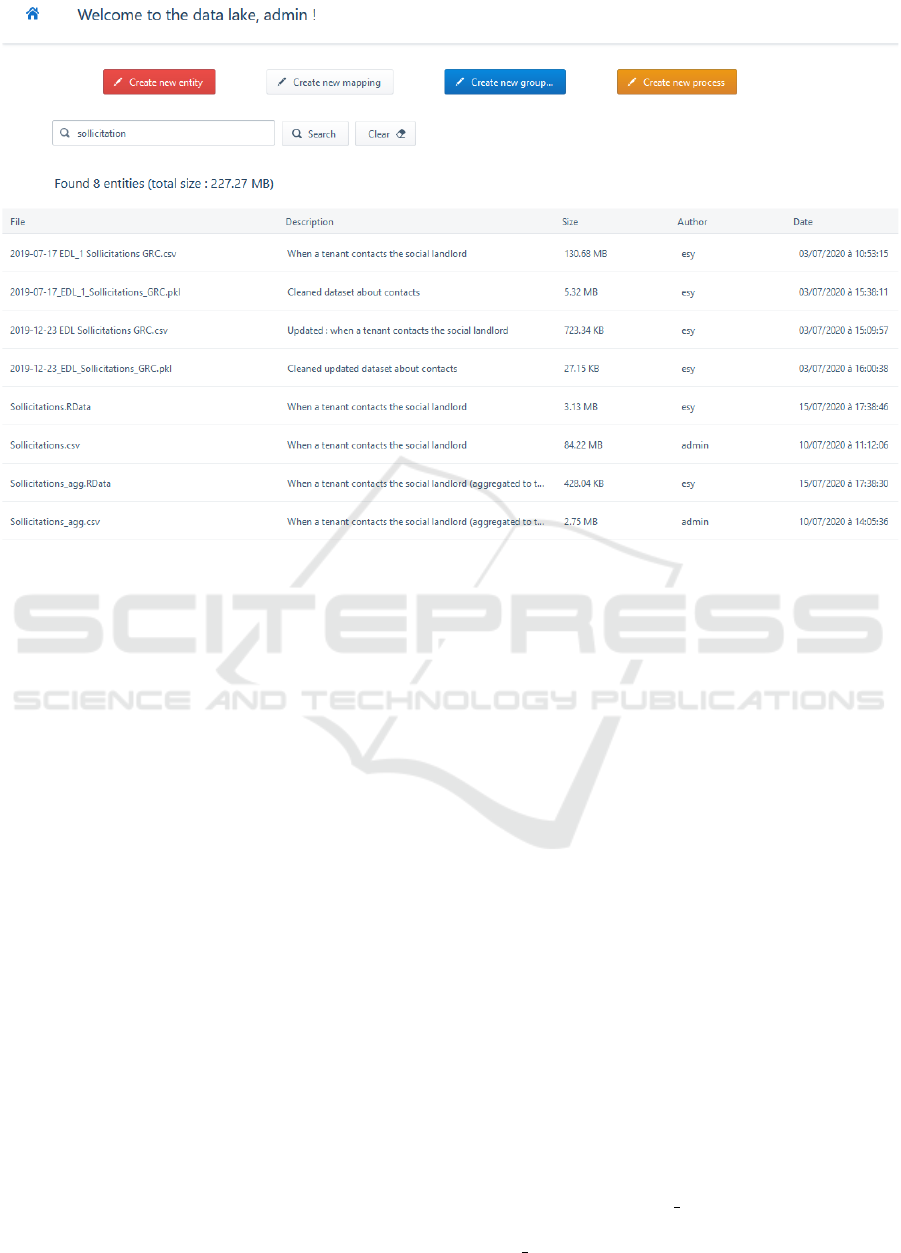
Figure 2: HOUDAL’s interface.
keyword in their file name or description.
Note that the screenshot of Figure 2 is only par-
tial and does not show all of the functionalities of the
interface, such as downloading data or viewing the
groups related to a data entity. In the following para-
graph, we discuss how HOUDAL helps us to tackle
the issues encountered in our use case.
5.3 HOUDAL Applied to the Use Case
In Section 3, we presented how the use case generates
issues when using traditional BI and BA tools. We
also showed that, from a theoretical standpoint, using
a data lake would be a good solution to tackle these
problems. In order to validate our proposal, we have
tried to replicate in HOUDAL the project carried out
without the use of a data lake. Here we discuss what
HOUDAL’s metadata system looks like when applied
to this use case, and how it assists data specialists.
As presented before, HOUDAL’s metadata system
is based on three main concepts. The different data
files that populate the data lake are data entities. They
can be either raw data files sent by landlords (often in
comma separated value files) or reworked data, some-
times stored in various formats such as .pkl or .RData,
for Python and R analyses, respectively. In Neo4J,
each data entity has its node labeled :ENTITY and
the entity’s properties, such as file name or descrip-
tion, are stored in the node’s attributes.
Groupings are use for categorizing data entities.
With HOUDAL, users can create as many groupings
as necessary, and several groups for each grouping.
Data entities can be linked to zero, one or several
groups for each grouping. In the physical model,
groupings are modeled by nodes carrying a :GROUP-
ING label. Groups are also nodes, carrying both a
:GROUP label and grouping’s name as a second label,
in order to facilitate querying. A data entity node can
be linked to several group nodes. A data entity node
(resp. group node) is linked to a group node (resp.
grouping node) with an edge labeled with the group-
ing’s name (resp. :GROUPING). With groups and
groupings, users can, for example, determine whether
it is internal or external data, or the data refinement
level (zones), and so on.
Processes reflects the modifications that data may
undergo, and are used for tracking data lineage. It can
be, for example, a script for transforming or cleaning
a data file, i.e., a data entity. In Neo4J, a process is
also modeled by a node, labeled :PROCESS. Data en-
tities can be input of the process (for example, raw
data sent by the landlord), or output (cleansed data).
If a data entity is the input of a process, there is an
edge labeled :PROCESS
IN from the entity node to
the process node. Inversely, an edge labeled :PRO-
CESS OUT from the process node to the entity node
HOUDAL: A Data Lake Implemented for Public Housing
47

is created if a new data entity is generated by the pro-
cess.
Figure 3 presents a sample of metadata stored in
Neo4J. Data entity nodes are colored in red. On both
sides of the Figure, a data entity node is highlighted:
some of its attributes are depicted at the bottom in
grey.
The left-hand side of the Figure gives an example
of groups. There are three groupings: a zone group-
ing, a format grouping and a granularity grouping.
Each grouping has its group nodes, colored in green,
purple and blue, respectively. Data entity nodes are
connected to group nodes with an edge. For example,
we can see that the highlighted data entity node (on
the left) is a raw .csv file, and the granularity level is
“Tenant”, meaning that each line corresponds to a ten-
ant. Note that in Neo4J, groupings are also modeled
as nodes, but are not represented in this Figure.
An example of process is depicted on the right side
of Figure 3. The process node is colored in yellow.
We can see that three data entity nodes are the pro-
cess’ input, and three data entity nodes are the pro-
cess’ output, meaning that they are generated by the
process.
5.4 Limitations and Future Work
HOUDAL is functional and is currently in advanced
testing phase. Several social landlords have shown
interest in our work and, although much work re-
mains to be done, discussions are underway to deploy
this application to other social landlords over the long
term. However, while being functional, it is still a
work in progress, and thus has limitations.
The first limitation of HOUDAL is its data stor-
age system. Indeed, considering the use case we have
treated, in which there are only files, having a storage
system other than a directory was not necessary. On
the other hand, in the long term, we would like to be
able to offer users the possibility of carrying out BI
analyses, which often implies the presence of a data
warehouse, and therefore a relational database.
To overcome this problem, we wish to add, at least
initially, a relational database in the storage space of
the data lake. In order to make it easy for the user to
use it, we also wish to propose through the interface a
page allowing the user to enter SQL queries, in order
to create and fill his databases and tables.
The second limitation arises at the level of filling
the data lake with source data. Although this process
is currently simple, it remains tedious in the case of
a large number of files, and if the data source is not
a native file, it forces the user to generate a file from
the source. If we take the example of a source being
a relational database, the user must extract data from
the tables as CSV files and then insert them in the
data lake. This adds one more step in the process of
storing data into the lake, and we could argue that it
“denatures” the source in a certain way.
This is why we wish to open the scope of possibil-
ities concerning the data sources that can feed the data
lake. In particular, we want to be able to automate the
filling of the lake, and not have to go through the in-
terface, which requires human intervention each time.
For this, we want to develop an ETL component (for
example, Pentaho Data Integration), as well as a li-
brary for a scripting language (for example, Python).
With these tools, the user would not use the “extract
from file/table” and “insert into file/table” functions
anymore, but an “extract from data lake” and “insert
into data lake” function.
The data lake can contain data of all types and
from all sources. In addition, many users with dif-
ferent profiles can connect to the lake to exploit it. On
the other hand, some data may be of a sensitive nature
and should only be accessible by a specific category
of users. For example, in the case of data concern-
ing Social Housing, if a dataset contains details about
the income of tenants or their professional situation, it
must be considered sensitive and therefore only acces-
sible by users who have been validated beforehand. In
the case of the use we dealt with in the data lake, there
was no notion of sensitive data.
For these reasons, we wish to work on this aspect.
To this end, we want to introduce the notion of roles
and restrictions in the data lake management applica-
tion. We want the roles to be modular, i.e. to be able
to define the roles for a given project, and to associate
restrictions to these roles. It is also possible to restrict
access to metadata according to a profile : to be able
to only consult, to be able to create new metadata, to
be able to modify it, and so on.
6 CONCLUSION
For achieving Data Intelligence in the context of big
data, some challenges must be addressed first. One
of or proposals is the use of a data lake, in which all
types of data are stored, and from which various kinds
of analyses can be performed. This is a trendy re-
search topic with several possibilities being explored.
Given the constraints of our real-life use case, we
drew inspiration from our metadata system based on
data semantics, namely MEDAL, to which we made a
few modifications to create goldMEDAL. It is based
on three main concepts: data entity, grouping and pro-
cess.
ICEIS 2021 - 23rd International Conference on Enterprise Information Systems
48
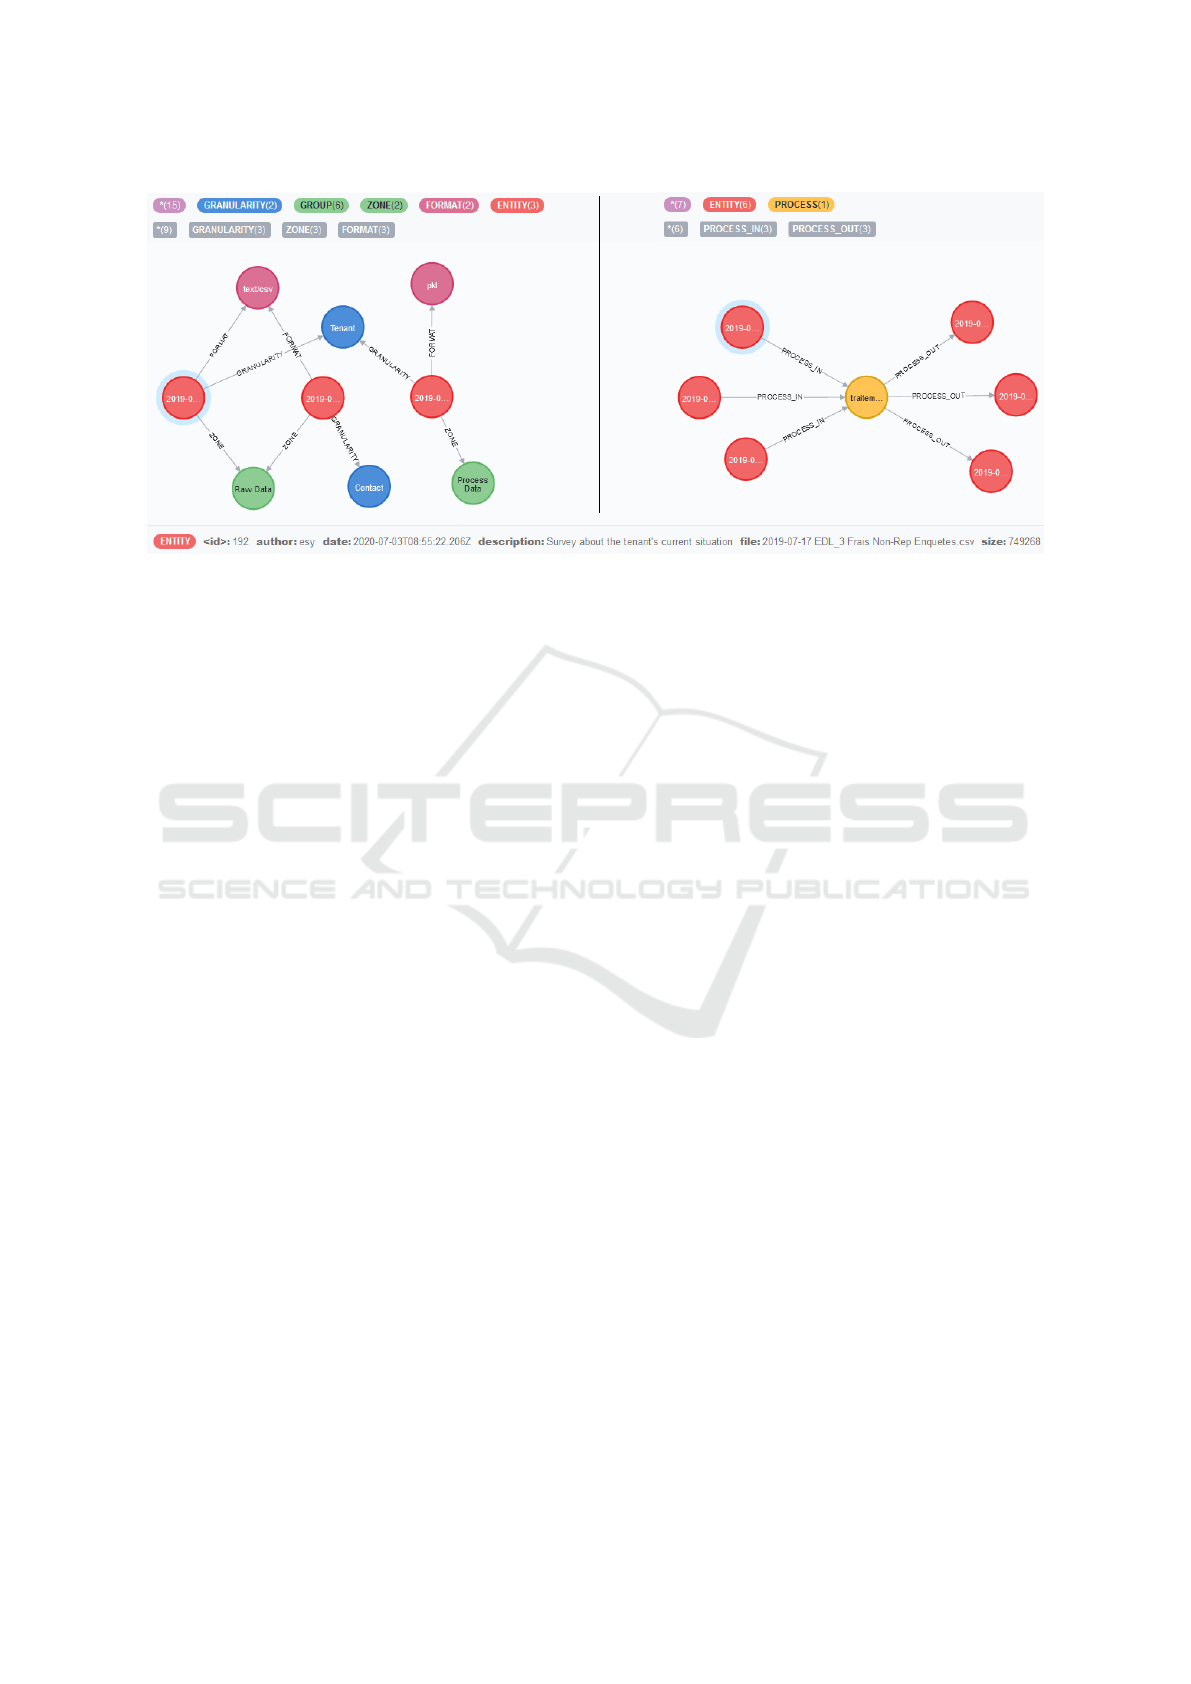
Figure 3: HOUDAL sample Neo4J metadata.
This metadata system allows us to define a frame-
work that doesn’t give a predefined shape to the data
lake. Conventional data lakes operate in ELT; we
prefer to add two steps to get an EDLT(L) operating
mode. Step D, for Describe, indicates that metadata
are extracted before storing the data in the lake. The
optional step L, for (Re)Load, is for analyses con-
ducted on the lake’s data, which may generate new
reworked data; when this is the case, these data are
back-fed into the lake, and go through the Describe
step again.
In the context of public housing, we have im-
plemented our framework and we have created
HOUDAL, a data lake for public housing. After a
review of the different possibilities to carry out this
development, we chose to develop a web application
from scratch, in order to best fit the requirements of
our use case. HOUDAL is composed of a user inter-
face and of an API that queries the various services
necessary for the proper functioning of the lake, in
particular the data lake storage area and the metadata
system.
HOUDAL is showing satisfactory results, but we
have many areas for improvement to make it more
complete. In particular, we would like to improve
the feeding of the data lake by being able to query
various sources, but also to simplify the data extrac-
tion from the lake, whether through ETL or scripting
languages. Finally, we also want to make HOUDAL
more robust against GDPR-related problems, which
we did not have to deal with in our case of use, but
which are nevertheless very common.
One of HOUDAL’s long-term objectives is to al-
low the study of a social landlord’s patrimony, and
more precisely the attractiveness of its dwellings.
This is indeed a key issue for social landlords. In
the past, qualitative studies have been carried out with
the help of business experts to obtain strategic infor-
mation on their patrimony and the actions to be taken
for the future. The next step would be to conduct a
data-driven, quantitative study to compare it with the
qualitative opinions drawn up by business experts.
But this objective raises many challenges. The at-
tractiveness of a dwelling is defined on the one hand
according to its characteristics, such as surface area,
number of rooms, or heating type; social landlords
have this information, in what we call “internal data”.
On the other hand, attractiveness is also defined by
the urban environment in which the dwelling is lo-
cated, with for example the presence of public trans-
portation and schools nearby, the employment rate in
the district or the general standard of living in the city.
Here, we need to retrieve this information from the in-
ternet, whether through open data, or social networks:
this is “external data”.
To meet these constraints, we believe that using
HOUDAL as presented in this article can be success-
ful. Indeed, it is a good solution to store both inter-
nal data from social landlords and external data gath-
ered from the Internet, while describing them prop-
erly with the appropriate metadata. Moreover, the
study of housing attractiveness is a good example of a
Data Intelligence project and the creation of advanced
indicators. The external data will be reworked and
then cross-referenced with internal data, with the fi-
nal objective of providing an attractiveness score for
each dwelling.
HOUDAL: A Data Lake Implemented for Public Housing
49

REFERENCES
Assunc¸
˜
ao, M. D., Calheiros, R. N., Bianchi, S., Netto,
M. A., and Buyya, R. (2015). Big data computing
and clouds: Trends and future directions. Journal of
Parallel and Distributed Computing, 79:3–15.
Baars, H. and Ereth, J. (2016). From data warehouses to
analytical atoms-the internet of things as a centrifugal
force in business intelligence and analytics. In 24th
European Conference on Information Systems (ECIS),
Istanbul, Turkey, page ResearchPaper3.
Chen, H., Chiang, R. H., and Storey, V. C. (2012). Business
intelligence and analytics: from big data to big impact.
MIS quarterly, pages 1165–1188.
Chen, M., Mao, S., and Liu, Y. (2014). Big data: A survey.
Mobile networks and applications, 19(2):171–209.
Diamantini, C., Giudice, P. L., Musarella, L., Potena, D.,
Storti, E., and Ursino, D. (2018). A New Meta-
data Model to Uniformly Handle Heterogeneous Data
Lake Sources. In European Conference on Advances
in Databases and Information Systems (ADBIS 2018),
Budapest, Hungary, pages 165–177.
Dixon, J. (2010). Pentaho, Hadoop, and Data Lakes.
https://jamesdixon.wordpress.com/2010/10/14/pentaho-
hadoop-and-data-lakes/.
Gandomi, A. and Haider, M. (2015). Beyond the hype: Big
data concepts, methods, and analytics. International
Journal of Information Management, 35(2):137–144.
Gr
¨
oger, C. (2018). Building an industry 4.0 analytics plat-
form. Datenbank-Spektrum, 18(1):5–14.
Hai, R., Geisler, S., and Quix, C. (2016). Constance: An
Intelligent Data Lake System. In International Con-
ference on Management of Data (SIGMOD 2016),
San Francisco, CA, USA, ACM Digital Library, pages
2097–2100.
Halevy, A. Y., Korn, F., Noy, N. F., Olston, C., Polyzotis, N.,
Roy, S., and Whang, S. E. (2016). Goods: Organizing
Google’s Datasets. In Proceedings of the 2016 Inter-
national Conference on Management of Data (SIG-
MOD 2016), San Francisco, CA, USA, pages 795–
806.
Heintz, B. and Lee, D. (2019). Production-
izing Machine Learning with Delta Lake.
https://databricks.com/fr/blog/2019/08/14/production
izing-machine-learning-with-delta-lake.html.
Hellerstein, J. M., Sreekanti, V., Gonzalez, J. E., Dalton,
J., Dey, A., Nag, S., Ramachandran, K., Arora, S.,
Bhattacharyya, A., Das, S., Donsky, M., Fierro, G.,
She, C., Steinbach, C., Subramanian, V., and Sun, E.
(2017). Ground: A Data Context Service. In Bien-
nial Conference on Innovative Data Systems Research
(CIDR 2017), Chaminade, CA, USA.
Inmon, B. (2016). Data Lake Architecture: Designing the
Data Lake and avoiding the garbage dump. Technics
Publications.
Maccioni, A. and Torlone, R. (2017). Crossing the finish
line faster when paddling the data lake with KAYAK.
VLDB Endowment, 10(12):1853–1856.
Madera, C. and Laurent, A. (2016). The next informa-
tion architecture evolution: the data lake wave. In
International Conference on Management of Digital
EcoSystems (MEDES 2016), Biarritz, France, pages
174–180.
Miloslavskaya, N. and Tolstoy, A. (2016). Big Data, Fast
Data and Data Lake Concepts. In International Con-
ference on Biologically Inspired Cognitive Architec-
tures (BICA 2016), NY, USA, volume 88 of Procedia
Computer Science, pages 1–6.
Mortenson, M. J., Doherty, N. F., and Robinson, S. (2015).
Operational research from taylorism to terabytes: A
research agenda for the analytics age. European Jour-
nal of Operational Research, 241(3):583–595.
Ravat, F. and Zhao, Y. (2019). Metadata management for
data lakes. In European Conference on Advances in
Databases and Information Systems (ADBIS 2019),
Bled, Slovenia, pages 37–44. Springer.
Sawadogo, P., Kibata, T., and Darmont, J. (2019a). Meta-
data management for textual documents in data lakes.
arXiv preprint arXiv:1905.04037.
Sawadogo, P. N., Scholly, E., Favre, C., Ferey, E., Loud-
cher, S., and Darmont, J. (2019b). Metadata sys-
tems for data lakes: models and features. In Inter-
national Workshop on BI and Big Data Applications
(BBIGAP@ADBIS 2019), Bled, Slovenia, pages 440–
451. Springer.
Scholly, E. (2019). Business intelligence & analytics ap-
plied to public housing. In ADBIS Doctoral Consor-
tium (DC@ADBIS 2019), Bled, Slovenia, pages 552–
557. Springer.
Scholly, E., Sawadogo, P., Liu, P., Espinosa-Oviedo, J. A.,
Favre, C., Loudcher, S., Darmont, J., and No
ˆ
us, C.
(2021). Coining goldmedal: A new contribution to
data lake generic metadata modeling. In 23rd Interna-
tional Workshop on Design, Optimization, Languages
and Analytical Processing of Big Data (DOLAP@
EDBT 2021).
Watson, H. J. and Wixom, B. H. (2007). The current state
of business intelligence. Computer, 40(9):96–99.
ICEIS 2021 - 23rd International Conference on Enterprise Information Systems
50
