
Software Product Line Traceability and Product Configuration in Class
and Sequence Diagrams: An Empirical Study
Thais S. Nepomuceno
a
and Edson OliveiraJr
b
State University of Maring
´
a, Maring
´
a, Brazil
Keywords:
Class Diagram, Experiment, Product Configuration, Sequence Diagram, Software Product Lines, Traceability,
UML.
Abstract:
A set of systems that share common and variable parts is called a Software Product Line (SPL). These kind
of systems are usually part of the same market segment. Their elements that vary are what allow the di-
versification among products from the same family, thus managing variability is an important issue of SPL
engineering. There are few studies in the literature that evaluate and compare approaches to SPL variability
management in UML-based SPLs. In this work, two of the existing approaches, SMarty and Ziadi et al., are
compared throughout an experiment to verify: the effectiveness in configuring products based on UML class
and sequence diagrams; the influence of the participants knowledge on UML, SPL and variability in the ef-
fectiveness results; and how traceability is performed in each approach. Results show the SMarty approach
is statically superior with relation to Ziadi et al. for the effectiveness at configuring products with class and
sequence diagrams. Regarding the knowledge level needed to a better effectiveness, SMarty demands less
knowledge than Ziadi et al. In addition, Ziadi et al. provides no means to round-trip trace variabilities in class
and sequence diagrams, thus SMarty was previously designed to allow it.
1 INTRODUCTION
According to Almeida (2019), several techniques ex-
ist to allow software reuse, establishing actions and
strategies to be taken to ensure compliance with stan-
dards such as: software product lines, application
frameworks, design standards, and program libraries.
Software Product Line (SPL) is an approach that is
constantly growing since the adoption of a successful
SPL brings out several advantages to the organization,
such as productivity improvement, development time,
product quality and customer satisfaction (Clements
and Northrop, 2001; Linden et al., 2007).
For the successful adoption of SPL, managing
variability becomes essential. In the SPL context,
variability represents a subset of all possible choices
to generate specific products. Variation points and
variants are used to define SPL variabilities. Accord-
ing to Chen and Ali Babar (2011), variation points
describe the specific location where differences occur
in systems, and variants represent the different possi-
bilities to resolve a variation point.
a
https://orcid.org/0000-0001-7107-1648
b
https://orcid.org/0000-0002-4760-1626
In the existing literature, we may highlight consol-
idated UML-based SPL variability management ap-
proaches, such as PLUS (Gomaa, 2004) and the Ziadi
et al. approach (Ziadi and Jezequel, 2006).
Chen and Ali Babar (2011), Galster et al. (2014),
and Raatikainen et al. (2019) point out such ap-
proaches have not been properly experimented, using
rigorous scientific methods. In a systematic review by
Ahnassay et al. (2014), the results show that a large
part of the empirical assessments on SPL was not ad-
equately designed or reported.
We previously compared the SMarty approach
to other existing UML-based variability management
approaches as: in Nepomuceno et al. (2020) for use
cases and classes; and in Nepomuceno et al. (2020)
for classes and components. Therefore, in this work
1
,
we want to answer the following research question:
“Is the SMarty approach more effective at configur-
ing specific products from UML-based SPL at class
and sequence diagrams level compared to the Ziadi
et al. approach?”.
1
This work is supported by CAPES/Brazil
(Coordenac¸
˜
ao de Aperfeic¸oamento de Pessoal de N
´
ıvel
Superior) code 001.
Nepomuceno, T. and OliveiraJr, E.
Software Product Line Traceability and Product Configuration in Class and Sequence Diagrams: An Empirical Study.
DOI: 10.5220/0010411001970204
In Proceedings of the 23rd International Conference on Enterprise Information Systems (ICEIS 2021) - Volume 2, pages 197-204
ISBN: 978-989-758-509-8
Copyright
c
2021 by SCITEPRESS – Science and Technology Publications, Lda. All rights reserved
197
2 BACKGROUND AND RELATED
WORK
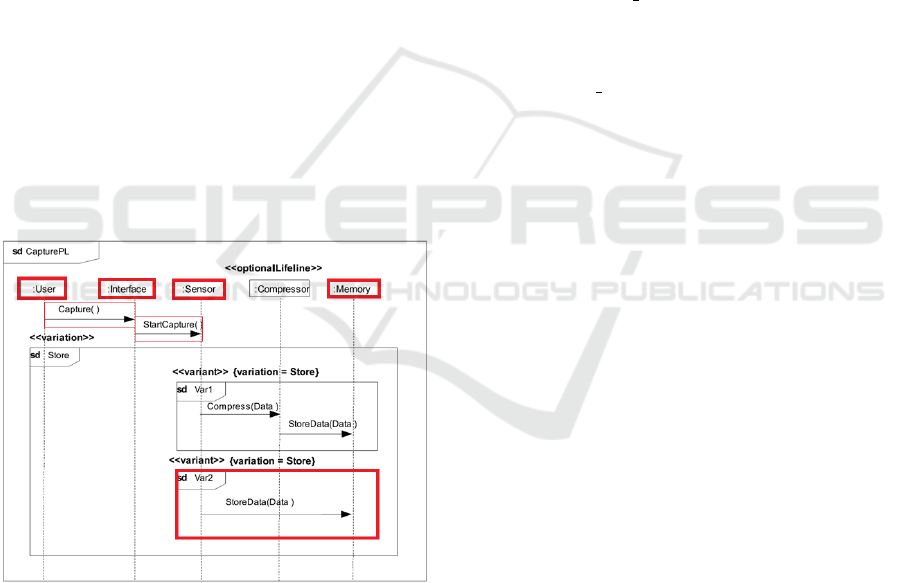
2.1 The Ziadi et al. Approach
The Ziadi et al. approach (Ziadi and Jezequel, 2006)
is composed of an UML 2.0 profile with a set of ex-
plicit tagged values and metaclasses to annotate se-
quence and class diagrams elements for represent-
ing variability. The stereotypes proposed by Ziadi et
al. are as follows: <<optionalLifeline>> used to
represent alternative or optional lifelines in sequence
diagrams; <<optionalInteraction>> used to rep-
resent optional interactions in sequence diagrams;
<<optional>> used to represent optional elements
in class diagrams, such as classes and packages;
<<variation>> used to represent variation points
in sequence and class diagrams; <<variant>> used
to represent variants in class and sequence diagrams;
<<virtual>> used to indicate when an interaction
represents a specific situation in which the behavior
of a sequence diagram can be represented by another
sequence diagram.
Figure 1 represents a sequence diagram example.
The highlighted elements are possible products con-
figured from the complete diagram.
Figure 1: A sequence diagram modeled according to Ziadi
et al.
The Ziadi et al. approach does not offer any support
for tracking elements from class to sequence diagrams
and vice-versa.
2.2 The SMarty Approach
SMarty is composed of a UML profile, the
SMartyProfile, and a process, the SMartyProcess
(OliveiraJr et al., 2010). The UML profile is com-
posed of a set of stereotypes and tagged-values as
follows: <<variability>>: represents variabilities
in an UML note. It has the following attributes:
name: name used to refer to a variability; minS-
election: minimum number of variants selected to
solve a variation point or variability; maxSelection:
maximum number of variants selected to solve a
variation point or variability; bindingTime: moment
of variability resolution; variants: collection of in-
stances associated with variability; realizes+: collec-
tion of variability names of higher level diagrams;
and realizes-: collection of variability names of lower
level diagrams. <<variationPoint>>: stereotype
of variation point; <<mandatory>>: represents
this variant must necessarily be present in any prod-
uct; <<optional>>: represents an optional vari-
ant; <<alternative OR>>: indicates the existence
of a group of inclusive variants. Different com-
binations of inclusive variants can be selected for
the resolution of a variation point or variability;
<<alternative XOR>>: indicates the existence of
a group of exclusive variants. Only one variant of
this group can be selected for the resolution of a vari-
ation point or variability; <<mutex>>: represents
the mutually exclusive relationship between variants;
<<requires>>: represents a complement relation-
ship between two variants.
Figure 2 represents a sequence diagram example.
The highlighted elements are possible products con-
figured from the complete diagram.
Traceability among class and sequence elements
and vice-versa in SMarty is performed using the
realizes+ and realizes- meta-attributes of the
<<variability>> stereotype.
2.3 Related Work
As far as we know, based on a non-systematic search
and the works of Ahnassay et al. (2014), Chen
and Ali Babar (2011), Galster et al. (2014), and
Raatikainen et al. (2019) there is no study in the
literature directly related to experimental compari-
son among UML-based variability management ap-
proaches with regard to product configuration and
traceability in class and sequence diagrams. However,
our research group has developed several experiments
to show the effectiveness of SMarty.
Marcolino et al. (2013) conducted an experiment
in 2013 comparing the SMarty approach with the
PLUS (Gomaa, 2004) method in relation to the iden-
tification and resolution of variability in use case di-
agrams, in which SMarty provided better results than
the PLUS method.
ICEIS 2021 - 23rd International Conference on Enterprise Information Systems
198
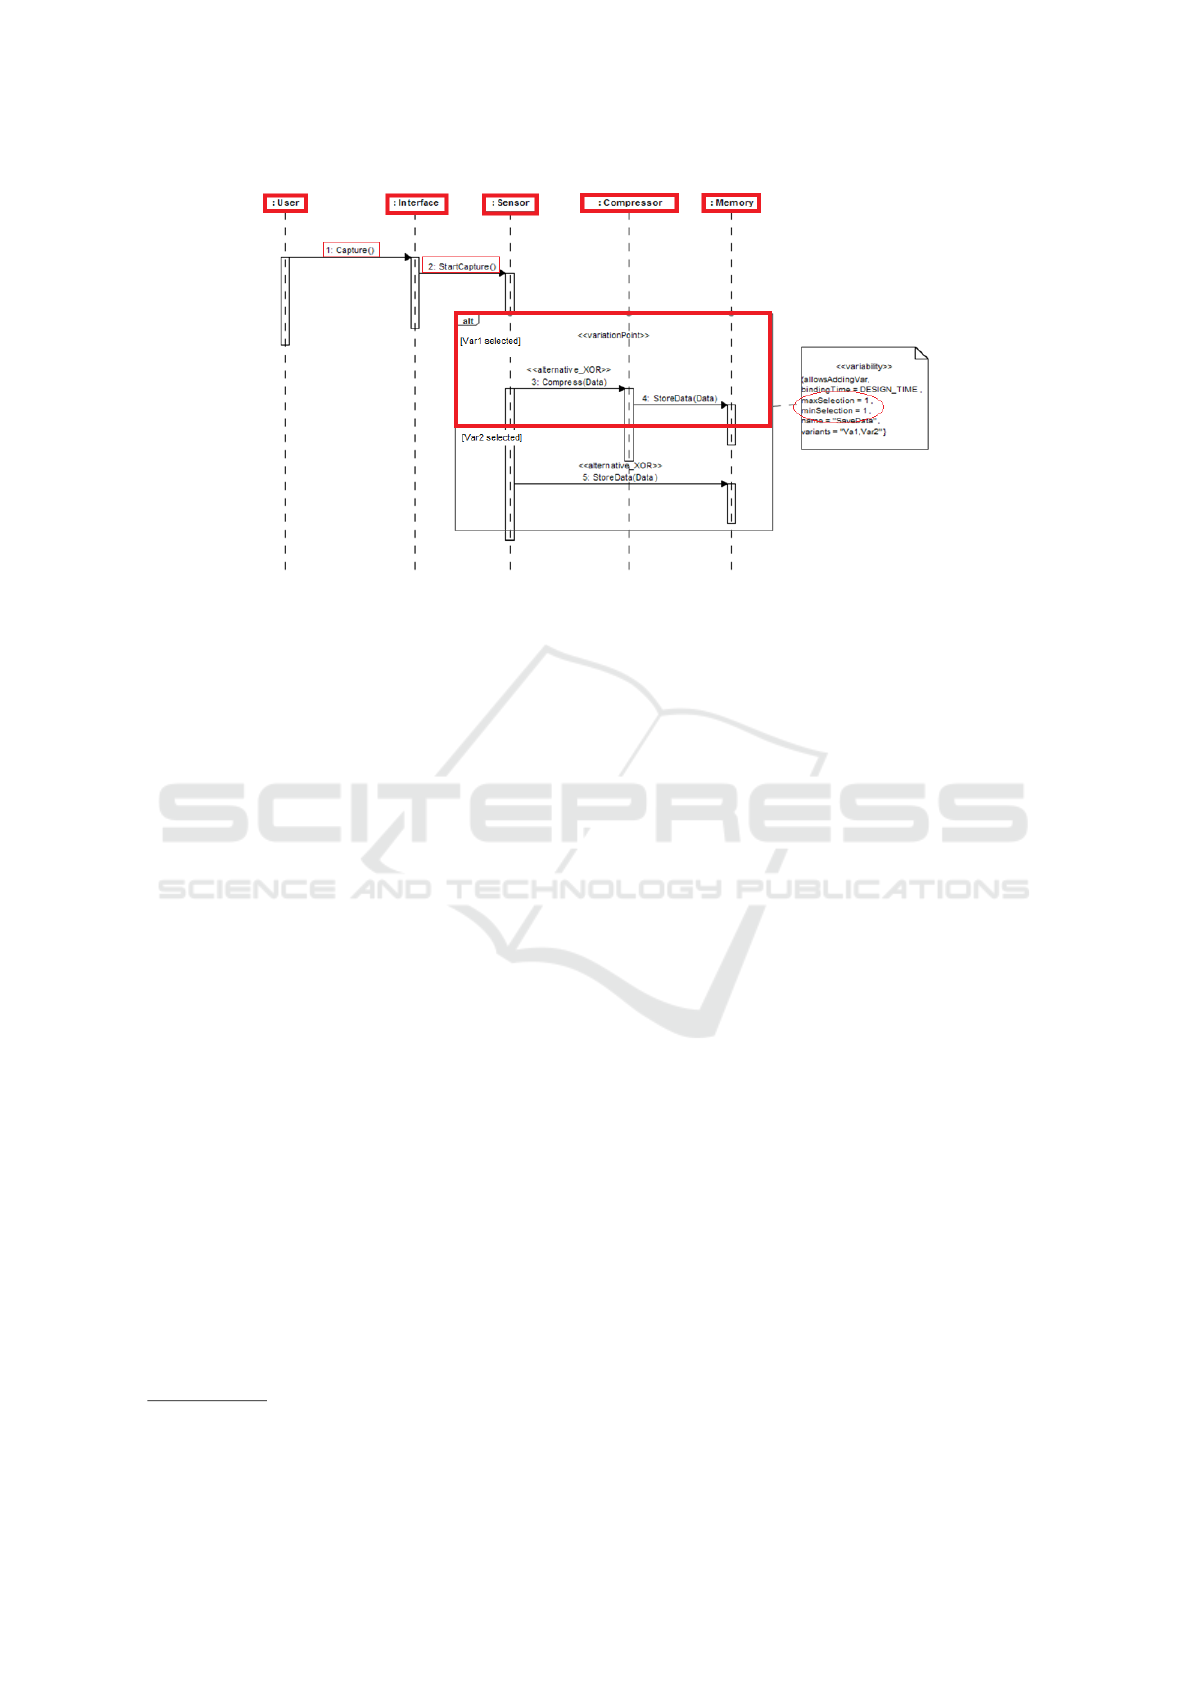
Figure 2: A sequence diagram modeled according to the SMarty approach.
A year later, a new experiment was conducted by
Marcolino et al. (2014a) comparing SMarty and Ziadi
et al. approaches in sequence diagrams. As a re-
sult, SMarty also provided more effectiveness results
at identifying and resolving variabilities.
In another experiment in 2014, Marcolino et al.
(2014b) compared SMarty and PLUS regarding the
identification and resolution of variability in class dia-
grams. In this evaluation, the PLUS method provided
better effectiveness results.
Two other experiments were conducted by Mar-
colino et al. (2017) and Marcolino and OliveiraJr
(2017) in 2017, which compared SMarty and PLUS
for a class diagram. In the first experiment, there
was no statistical difference between the effectiveness
samples in relation to the ability to interpret and con-
figure the correct products. In the second, PLUS pro-
vided better results.
3 EMPIRICAL STUDY
This study
2
is characterized as a quasi-experiment,
as the selection of participants was not randomized
based on the fact that the participants were chosen for
convenience.
The goal of this experiment is to compare the ap-
proaches Ziadi et al. and SMarty, with the purpose of
identifying which is more effective regarding the con-
figuration of specific products in sequence and class
diagrams, thre relevance of the knowledge of each
participant, and the traceability capacity of each ap-
2
Data of this study are available at https://doi.org/10.
5281/zenodo.4304279
proach from the point of view of researchers in the
role of SPL architects, in the context of undergradu-
ate and graduate students who have previously knowl-
edge about UML, SPL and variability.
We defined the following research questions for
this study: RQ1: Which approach is more effective
for deriving specific product configurations from se-
quence and class diagrams?; RQ2: What is the influ-
ence of the participants level of knowledge in config-
uring specific products from sequence and class dia-
grams?; and RQ3: Which approach is more effective
in tracing elements from class to sequence diagrams
and vice-versa?
3.1 Planning
This study can be characterized on the following di-
mensions: Process: for eight participants, the process
was online. We provided all instruments as a link on
the Google drive and the responses were returned by
email. For 22 participants, we applied the experiment
offline in different days, according to the availability
of each participant; and Participants: all participants
were undergraduate or graduated students. The pro-
file description of participants knowledge is shown in
Table 1.
The selection of participants was non-
probabilistic, not randomized based on the fact
that participants were chosen for convenience.
Thirty people participated in the experimental
evaluation. Such participants were undergraduate or
graduate students in Computer Science and Computer
Engineering, some with expertise in the industry.
The participants received a set of documents,
which are:
Software Product Line Traceability and Product Configuration in Class and Sequence Diagrams: An Empirical Study
199

Table 1: Knowledge level of participants.
Part. ID
Knowledge
Education
Exper. in
Industry?
Experience
(months)
UML
SPL/
Variab.
1 Basic Basic Masters St. No 36
2 Moderate Have read Masters St. Yes 36
3 Moderate Basic Masters St. No 50
4 Moderate Basic Masters St. No 48
5 Basic Have read Bachelor Yes 25
6 Basic None Bachelor Yes 12
7 Basic None Bachelor Yes 30
8 Moderate Have read Bachelor No 10
9 Basic Have read Bachelor No 60
10 Moderate Have read Bachelor No 36
11 Basic None Bachelor No 8
12 Basic Have read Bachelor Yes 36
13 Basic Have read Bachelor Yes 30
14 Basic Have read Bachelor Yes 48
15 Moderate None Bachelor No 48
16 Basic None Bachelor No 24
17 Moderate Have read Bachelor Yes 20
18 Moderate Have read Bachelor Yes 15
19 Moderate None Bachelor Yes 36
20 Moderate Have read Bachelor No 36
21 Basic None Bachelor No 24
22 Basic None Bachelor Yes 34
23 Basic None Bachelor Yes 40
24 Moderate None Bachelor No 36
25 Moderate None Bachelor No 36
26 Basic None Bachelor No 36
27 Moderate None Masters St. No 36
28 Basic None Bachelor Yes 60
29 Basic None Bachelor No 36
30 Basic None Bachelor Yes 26
• Informed Consent Term (ICT): containing the
main information about the experiment, such as:
confidentiality, procedures and benefits. Such
document allowed the participants to make their
decision about participation or not in the research
in a fair way;
• Characterization Questionnaire: applied to par-
ticipants to analyze the level of knowledge and ex-
perience on UML, SPL and variability;
• Theoretical Synthesis: to facilitate the partici-
pant to find the information on the experiment,
this document was divided into three sections.
The first with the main concepts of Software Prod-
uct Lines and the second with the general descrip-
tion of the AGM SPL. As the participants were
divided into two blocks (one block for each ap-
proach), the third section of this document, which
comprised information about the approaches, was
different for each group. The division was car-
ried out by sending different links to each group
of participants, as follows:
– Block with Ziadi et al.: comprised a summary
of the concepts of the Ziadi et al. approach,
as well as their stereotypes and examples. This
approach in the documentation was represented
by X;
– Block with SMarty: concepts about the
SMarty approach, its stereotypes and examples.
This approach was identified as Y.
• Videos (in Portuguese): with the explanation of
SPL and the approaches and examples.
We defined the following hypotheses as follows:
• for effectiveness in sequence diagrams:
– Null Hypothesis (H0
e f f seq
): there is no sig-
nificant difference in the effectiveness between
SMarty and Ziadi et al. at configuring specific
SPL products from sequence diagrams.
H0
e f f seq
: µ(eff seq(SMarty)) =
µ(eff seq(Ziadi et al))
– Alternative Hypothesis (H1
e f f seq
): there is a
significant difference in the effectiveness be-
tween SMarty and Ziadi et al. at configuring
specific SPL products from sequence diagrams.
H1
e f f seq
: µ(eff seq(SMarty)) 6=
µ(eff seq(Ziadi et al))
• for effectiveness in class diagrams:
– Null Hypothesis (H0
e f f cls
): there is no sig-
nificant difference in the effectiveness between
SMarty and Ziadi et al. at configuring specific
SPL products from class diagrams.
H0
e f f cls
: µ(eff cls(SMarty)) =
µ(eff cls(Ziadi et al))
– Alternative Hypothesis (H1
e f f cls
): there is a
significant difference in the effectiveness be-
tween SMarty and Ziadi et al. at configuring
specific SPL products from class diagrams.
H1
e f f cls
: µ(eff cls(SMarty)) 6=
µ(eff cls(Ziadi et al))
We defined the following variables for this study:
• Independent Variables: the variability
management approach, which is a factor with
two treatments: SMarty and Ziadi et al., and a pre-
fixed variable, the AGM SPL;
• Dependent Variables: the effectiveness on
correctly configuring products, the influence
of the participants knowledge on the
observed value of effectiveness, and the
traceability capability of each approach.
To calculate effectiveness we considered the follow-
ing equation:
Effectiveness (z) = nVarC/Total
Where:
• z = the approach;
• nVarC = number of variabilities correctly re-
solved; and
• Total = number of variabilities of a given diagram.
We calculated the influence of each participant knowl-
edge using a correlation between the five levels
of knowledge in the Characterization Questionnaire
ICEIS 2021 - 23rd International Conference on Enterprise Information Systems
200

(Likert Scale) and the value obtained for the effec-
tiveness for each participant.
We ran a pilot project to a set of Master’s students
in the area of software engineering at the State Uni-
versity of Maring
´
a with knowledge in managing vari-
ability in SPL.
From the application of this project, several issues
could be corrected and some changes to improve the
study instrumentation were made.
The participants answers of the pilot project were
discarded for the final set of responses on this study.
3.2 Operation
Thirty students participated in this study. Each of the
participants configured two specific products of the
AGM SPL: one from the sequence diagram; and one
from the class diagram.
The period of the experiment was one month, with
several days for face-to-face application of the exper-
iment according to the availability of each participant
and with the same period for participants who per-
formed the experiment online.
The group of participants was divided according
to the approach received by each participant. The di-
vision was done at random. Each group received a
document identifying the tasks to perform. Half of the
group configured products from an AGM SPL class
diagram, while the other half did it from a sequence
diagram.
3.3 Analysis and Interpretation
3.3.1 Effectiveness at Configuring Products
(RQ1)
The results collected from the configuration of the
products by each participant are shown in Table 2,
which refers to Ziadi et al. and SMarty. Such ta-
ble lists information on the correct resolved variabili-
ties (Corr), the total number of variability for a given
diagram (Total), and the effectiveness (Eff) of each
approach. In addition, descriptive statistics is shown
in such table. A correct modeled variability element
means it strictly follows the semantic meaning of vari-
ability, variation points and variants.
Normality Test. We applied the Shapiro-Wilk test
to the SMarty and Ziadi et al. effectiveness samples
for class and sequence diagrams.
We can observe all samples obtained p < (α =
0.05), therefore, they do not follow a normal distri-
bution: Ziadi et al. for class diagram (N=15): p =
0.0071; Ziadi et al. for sequence diagram (N=15):
Table 2: values observed with Ziadi et al. and SMarty for
class and sequence diagrams.
Class
Ziadi et al. SMarty
Part. ID Corr Total Eff Part. ID Corr Total Eff
1 6 10 0.6 2 10 10 1.0
3 10 10 1.0 4 10 10 1.0
5 9 10 0.9 6 10 10 1.0
7 7 10 0.7 8 8 10 0.8
9 8 10 0.8 10 10 10 1.0
11 6 10 0.6 12 9 10 0.9
13 7 10 0.7 14 10 10 1.0
15 10 10 1.0 16 10 10 1.0
17 10 10 1.0 18 9 10 0.9
19 10 10 1.0 20 10 10 1.0
21 8 10 0.8 22 10 10 1.0
23 7 10 0.7 24 10 10 1.0
25 10 10 1.0 26 9 10 0.9
27 10 10 1.0 28 10 10 1.0
29 6 10 0.6 30 9 10 0.9
Mean 8.22 - 0.82 Mean 9.6 - 0.96
Median 8 - 0.80 Median 10 - 1.00
St. Dev. 1.66 - 0.16 St. Dev. 0.63 - 0.06
Sequence
Ziadi et al. SMarty
Part. ID Corr Total Eff Partic Corr Total Eff
1 6 10 0.6 2 10 10 1.0
3 9 10 0.9 4 8 10 0.8
5 7 10 0.7 6 9 10 0.9
7 7 10 0.7 8 10 10 1.0
9 6 10 0.6 10 9 10 0.9
11 7 10 0.7 12 10 10 1.0
13 7 10 0.7 14 9 10 0.9
15 10 10 1.0 16 8 10 0.8
17 9 10 0.9 18 10 10 1.0
19 10 10 1.0 20 9 10 0.9
21 7 10 0.7 22 10 10 1.0
23 8 10 0.8 24 10 10 1.0
25 8 10 0.8 26 9 10 0.9
27 7 10 0.7 28 9 10 0.9
29 7 10 0.7 30 8 10 0.8
Mean 7.66 - 0.76 Mean 9.20 - 0.92
Median 7 - 0.70 Median 9 - 0.90
St. Dev. 1.29 - 0.12 St. Dev. 0.77 - 0.07
Corr = # of correct resolved elements, Eff = Effectiveness
p = 0.02453; SMarty for class diagram (N=15): p =
0.00011; and SMarty for sequence diagram (N=15):
p = 0.0043.
Hypothesis Test. Based on the non-normality of
samples, we decided to apply the Mann-Whitney-
Wilcoxon hypothesis test for the samples to indicate
whether there is a significant difference between them
according to the hypotheses established in Section
3.1, as follows:
• For Class Diagram Effectiveness Samples: the
calculated value for p was 0.0299 (< α = 0.05).
Therefore, we could reject H0
e f f cls
. It means
there is a significant difference between the effec-
tiveness of Ziadi et al. and SMarty samples for
effectiveness in configuring products from class
diagrams. By analyzing Table 2 we can observe
better results for SMarty compared to Ziadi et al.;
• For Sequence Diagram Effectiveness Samples:
the value of p calculated in the test was 0.001846
(< α = 0.05). Thus, we could reject H0
e f f seq
. It
means there is a significant difference between the
Software Product Line Traceability and Product Configuration in Class and Sequence Diagrams: An Empirical Study
201

effectiveness of Ziadi et al. and SMarty samples
for effectiveness in configuring products from se-
quence diagrams. By analyzing Table 2 we can
observe better results for SMarty compared to
Ziadi et al.
Effect Size. We calculated the effect size of each
hypothesis test to confirm the strength of respective
samples, as follows:
• For Class Diagram Effectiveness: the Cohen d
test was applied and we obtained -1.05, which in-
dicates a large difference between the samples for
class diagrams.
• For Sequence Diagram Effectiveness: for the
sequence diagram, the Cohen test returned the
value -1.44, which indicates a large difference be-
tween the samples of effectiveness in the configu-
ration of products from sequence diagrams.
3.3.2 Correlation between Effectiveness and
Participants Knowledge Level (RQ2)
In this section, we want to check whether there is a
correlation between the effectiveness and the partici-
pant level of knowledge. To do so, we used the Spear-
man’s correlation technique as we performed a con-
version of nominal scales to discrete values regarding
the participant knowledge.
We then found the following values for each dia-
gram:
• For Class Diagrams:
– Ziadi et al.: ρ = 0.77 a strong positive correla-
tion;
– SMarty: ρ = 0.27 a weak positive correlation.
• For Sequence Diagrams:
– Ziadi et al.: ρ = 0.66 a strong positive correla-
tion;
– SMarty: ρ = 0.05 a weak positive correlation.
We understand the lower the correlation ρ value, the
lesser the influence of the participant knowledge on
the obtained effectiveness. Therefore, SMarty ob-
tained better results than Ziadi et al. as the former de-
mands less previous knowledge to configure products
and to trace variabilities in both class and sequence
diagrams. This is particularly important to SMarty
newcomers to comprehend its syntax and semantics
for modeling variability in UML-based SPLs.
3.3.3 Traceability (RQ3)
As the Ziadi et al. approach has no traceability mech-
anisms as mentioned in Section 2.1, we analyzed such
mechanisms in SMarty.
To do so, we defined two likert-scaled questions
to the experiment participants who used the SMarty
approach:
• Question #1: Assuming that in a product config-
uration the features related to the Game Sprite
are excluded from the class diagram, can you ob-
serve/identify the respective changes/impacts in
the sequence diagram?.
• Question #2: If Play Game does not exist in the
sequence diagram, can you observe/identify the
respective changes/impacts in the class diagram?
We summarize the answers in Table 3.
Table 3: SMarty round-trip traceability to/from class and
sequence diagrams.
Question #1: Class to Sequence
Likert Labels Count Percentage (%)
I totally agree 8 53.33
I partially agree 5 33.33
I partially disagree 2 13.33
I totally disagree 0 0.00
Total 15 100.0
Question #2: Sequence to Class
Likert Labels Count Percentage (%)
I totally agree 6 40.00
I partially agree 5 33.30
I partially disagree 3 20.00
I totally disagree 1 6.70
Total 15 100.0
As observed in Table 3, 13 (86.66%) participants
agree changes can be traced to sequence diagrams
when a related variability element is modified in
a class diagram by using the <<variability>> at-
tribute realizes-. We assume, sequence diagrams
are lower abstraction level than class diagrams.
The same conclusion is valid for tracing elements
from sequence to class diagrams as 11 (73.33%)
participants could observe/identify such changes by
means of the attribute realizes+.
Based on these results, we understand traceability
in SMarty is promising, thus we need to reach 100%
satisfaction of its users.
3.4 Threats to Validity
We can make considerations regarding the internal va-
lidity of this experiment, as follows: all participants
were students, therefore there were no advanced skills
of the group; the participants training has leveled the
knowledge regarding SPL and variability, thus, we
consider the participants answers valid and signifi-
cant.
We detected certain threats related to the instru-
mentation. The AGM diagrams are not from an ac-
ICEIS 2021 - 23rd International Conference on Enterprise Information Systems
202

tual SPL. In addition, they are relatively simple to
understand. Therefore, in further studies, actual and
more complex SPLs must be considered to reduce
such threats.
The level of knowledge of the participants can also
be a threat, as some have more knowledge than others
on related topics (SPL and variability).
The feasibility of the study and the instrumenta-
tion were initially tested with a pilot project to ana-
lyze whether they are suitable to be applied in the real
study, and consequently not to invalidate the experi-
ment. As for the level of knowledge, the participants
received training on the concepts of SPL, variability,
SMarty, and Ziadi et al., thus we understand that they
obtained the necessary understanding to configure the
products and to answer the SMarty-related traceabil-
ity questions.
4 DISCUSSION OF RESULTS
4.1 Effectiveness Discussion
Observing the results of this study, we note a great
difference between samples in terms of effectiveness.
Analyzing the results on class diagrams, SMarty
had a mean of effectiveness of 0.96, a standard de-
viation of 0.06 and a median of 1.0, while Ziadi et
al. obtained a mean of 0.82, a standard deviation of
0.16 and a median of 0.8. SMarty participants config-
ured 10 products with 100% effectiveness, which rep-
resents more than half of the sample (median = 1.0).
On the other hand, Ziadi et al. obtained only six prod-
ucts totally correctly configured, which means less
than 50% of the sample (median = 0.8).
Although SMarty had better results than Ziadi et
al. for class diagrams effectiveness, SMarty partic-
ipants experienced partially wrong configuration of
certain products, which indicates a lack of total com-
prehensibility of the configuration process of the ap-
proach.
In relation to the sequence diagram, SMarty ob-
tained an effectiveness mean of 0.92, a standard de-
viation of 0.07 and a median of 0.9, whereas Ziadi et
al. obtained a mean of 0.76, a standard deviation of
0.12 and a median of 0.7. SMarty participants con-
figured six products with 100% effectiveness, which
represents less than half of the sample (median = 0.9).
Ziadi et al. obtained only two products totally cor-
rectly configured, which means much less than 50%
of the sample (median = 0.7).
We understand sequence diagrams are more diffi-
cult to understand and to configure products with both
approaches. Comparing both approaches, SMarty ob-
tained way better results than Ziadi et al. However, es-
pecially for SMarty, this result corroborates the con-
clusion on the class diagrams about the lack of guide-
lines to support its configuration process.
All of these results provide evidence on the ad-
vantage of SMarty over Ziadi et al. We assume par-
ticipants who used SMarty had better results because:
• SMarty provides a process to guide the user on
representation and identification of variability;
• SMarty provides several stereotypes for class
and sequence diagrams, not available in Ziadi
et al., which may make product configuration
easier.
4.2 Influence of Participant Previous
Knowledge
In this research question, we analyzed which ap-
proach had the least influence of the participants prior
knowledge. Therefore, we correlated the effective-
ness obtained to the level of knowledge.
When analyzing the correlation of the class dia-
grams, SMarty had ρ value 0.27 and Ziadi et al. 0.77.
With regard to Ziadi et al., a same knowledge tends
to lead to a specific effectiveness value at configur-
ing products. It means, the participant knowledge
highly determines his/her effectiveness. On the other
hand, in the SMarty approach, there is no tendency a
same knowledge to determine the effectiveness. For
SMarty, it is important as it provides numerous stereo-
types Ziadi et al. does not, as well as SMarty provides
a process to identify and represent variabilities, which
may influence the effectiveness at configuring prod-
ucts.
With relation to sequence diagrams, SMarty had
ρ value 0.05 and Ziadi et al. 0.66. As SMarty had a
way less correlation ρ value than Ziadi et al., the same
rationale can be used to interpret their results.
Therefore, we can summarize the results as fol-
lows: the participant knowledge seems to be irrel-
evant to SMarty at configuring product from both
class and sequence diagrams.
4.3 Traceability Results
We analyzed traceability for SMarty in a round-trip
flavor, from: class to sequence diagrams; and se-
quence to class diagrams.
From class to sequence diagrams 86.66% of par-
ticipants agree with SMarty support at identifying
and tracing the impacts at the sequence diagram level
when changes are made at the class level. This means
the majority of participants really comprehend the
Software Product Line Traceability and Product Configuration in Class and Sequence Diagrams: An Empirical Study
203

SMarty mechanism to trace variabilities from a higher
abstraction level diagram (class) to a lower level dia-
gram (sequence) by means of the <<variability>>
attribute realizes-. However, it seems there were
certain issues making it difficult to a small portion
(13.33%) of the participants to trace variabilities.
With regard to sequence to class diagrams,
73.3% of participants agree with SMarty support at
identifying and tracing the impacts at the class dia-
gram level when changes are made at the sequence
level. Again, the majority of participants really com-
prehend the SMarty mechanism to trace variabilities
from a lower abstraction level diagram (sequence)
to a higher level diagram (class) by means of the
<<variability>> attribute realizes+.
Unfortunately, for the traceability analysis, we did
not ask any open questions to participants to express
their thoughts on it, because we did not want to extend
the time for the participation in the experiment, thus
causing more fatigue threats.
5 CONCLUSION
Regarding the first research question, the results on
the effectiveness at configuring products showed an
advantage of SMarty in relation to Ziadi et al. for
both class and sequence diagrams.
We provide evidence the previous knowledge of
the participant in SPL, variability and UML may be
related to the effectiveness of Ziadi et al. to product
configuration. Especially for SMarty, the knowledge
seems not to determine such effectiveness, thus de-
manding less experienced participants.
With regard to the third research question, we un-
derstand SMarty provides subsidies for traceability
of variability-related elements in both class and se-
quence diagrams. However, this aspect still needs to
be improved. Ziadi, on the other hand, cannot be eval-
uated for not providing support for traceability of ele-
ments.
As future work we are developing an automated
tool to UML-based approaches which takes as a basis
any profile from the UML metamodel.
REFERENCES
Ahnassay, A., Bagheri, D., and Gasevic, D. (2014). Em-
pirical evaluation in sofware product line engineering.
Technical report, Ryerson University.
Almeida, E. S. (2019). Software Reuse and Product Line
Engineering. In Cha, S., Taylor, R. N., and Kang,
K., editors, Handbook of Software Engineering, pages
321–348. Springer International Publishing, Cham.
Chen, L. and Ali Babar, M. (2011). A systematic re-
view of evaluation of variability management ap-
proaches in software product lines. Inf. Softw. Tech-
nol., 53(4):344–362.
Clements, P. and Northrop, L. (2001). Software Product
Lines: Practices and Patterns. Addison-Wesley.
Galster, M., Weyns, D., Tofan, D., Michalik, B., and Avge-
riou, P. (2014). Variability in software systems—a
systematic literature review. IEEE Transactions on
Software Engineering, 40(3):282–306.
Gomaa, H. (2004). Designing Software Product Lines with
UML: From Use Cases to Pattern-Based Software Ar-
chitectures. Addison Wesley Longman Publishing
Co., Inc., Redwood City, CA, USA.
Linden, F. J. v. d., Schmid, K., and Rommes, E. (2007).
Software Product Lines in Action: The Best Indus-
trial Practice in Product Line Engineering. Springer-
Verlag, Berlin, Heidelberg.
Marcolino, A. and OliveiraJr, E. (2017). Comparing smarty
and plus for variability identification and represen-
tation at product-line uml class level: A controlled
quasi-experiment. J. Comp. Sci., 13:617–632.
Marcolino, A., OliveiraJr, E., and Gimenes, I. (2014a).
Variability identification and representation in soft-
ware product line uml sequence diagrams: Proposal
and empirical study. In SBES, pages 141–150.
Marcolino, A., OliveiraJr, E., Gimenes, I., and Barbosa,
E. F. (2014b). Empirically based evolution of a vari-
ability management approach at uml class level. In
COMPSAC, pages 354–363. IEEE.
Marcolino, A., OliveiraJr, E., Gimenes, I., and Maldonado,
J. (2013). Towards the effectiveness of a variability
management approach at use case level. In SEKE,
pages 214–219.
Marcolino, A., OliveiraJr, E., Gimenes., I. M. S., and Bar-
bosa, E. F. (2017). Variability resolution and product
configuration with smarty: An experimental study on
uml class diagrams. J. Comp. Sci., 13:307–319.
Nepomuceno, T., OliveiraJr, E., Geraldi, R., Malucelli, A.,
Reinehr, S., and Silva, M. A. G. (2020). Software
product line configuration and traceability: An empir-
ical study on smarty class and component diagrams. In
IEEE Annual Computers, Software, and Applications
Conference, pages 979–984.
Nepomuceno, T. S., OliveiraJr, E., Penteado, R. R. M.,
Silva, M. A. G., and Zorzo, A. (2020). Empirical study
on product configuration and traceability in uml-based
product-lines. In Proceedings of the Ibero-American
Conference on Software Engineering, pages 1–14.
OliveiraJr, E., Gimenes, I., and Maldonado, J. (2010). Sys-
tematic management of variability in uml-based soft-
ware product lines. J. UCS, 16:2374–2393.
Raatikainen, M., Tiihonen, J., and M
¨
annist
¨
o, T. (2019).
Software product lines and variability modeling: A
tertiary study. Journal of Systems and Software,
149:485 – 510.
Ziadi, T. and Jezequel, J.-M. (2006). Software Product Line
Engineering with the UML: Deriving Products, pages
557–588. Springer.
ICEIS 2021 - 23rd International Conference on Enterprise Information Systems
204
