
Insights with Big Data Analysis for Commercial Buildings Flexibility
in the Context of Smart Cities
Simona-Vasilica Oprea, Adela Bâra, Cătălin Ceaparu, Anca Alexandra Ducman, Vlad Diaconița
and Gabriela Dobrița Ene
Department of Economic Informatics and Cybernetics, Bucharest University of Economic Studies,
Romana Square 6, Bucharest 010374, Romania
diaconita.vlad@ie.ase.ro, gabrielaene02@gmail.com, simona.oprea@csie.ase.ro
Keywords: Big Data Processing, Analytics, Load Flexibility, Market Value, Commercial Buildings.
Abstract: The commercial buildings generate a significant volume of data that can be processed to assess the flexibility
of the electricity consumption and their potential contribution to flatten the load curve or provide ancillary
services. With the constant increase of the volatile output of the Renewable Energy Sources (RES) and
numerous Electric Vehicles (EV), the flexibility potential of the commercial buildings has to be investigated
to create smarter green cities. However, the volume of consumption data is significantly increasing when
various activities are profiled, such as cooling, heating, fans, lights, equipment, etc. In this paper, we propose
a big data processing framework or methodology to extract interesting insights from very large datasets and
identify the flexibility of the commercial buildings (of several types from the United State of America –
U.S.A.) and its market value in correlation with the Demand Response (DR) capabilities at the state and
Independent System Operator (ISO) level. This is a theoretical approach combining several aspects, such as:
large datasets processing techniques, DR programs, consumption data, flexibility potential estimation,
scenarios and DR enabling technologies costs. Applying one of the DR programs, significant results in terms
of savings are revealed from simulations.
1 INTRODUCTION
In regulated power systems, load was not a
controllable asset due to the high predictability of the
operation context. However, when most of the power
systems are deregulated, with an increasing volume
of RES and modern electric appliances that allow
considerable storage, the load becomes an important
factor to handle the challenges regarding power
system balancing, load curve peaks, electricity price
volatility, etc. (Hao, Corbin, Kalsi, & Pratt, 2017). In
the U.S.A., buildings represent a significant share in
the energy use and account for 72% of electricity and
36% of gas. On average, buildings account for 40%
of energy use. According to (Kahn, Kok, & Quigley,
2013), about 41% of the commercial building load in
the U.S.A. is represented by HVAC. In addition, at
the European Union level, gas has the highest share
of energy use in buildings, whereas the second
highest share of energy use is electricity (European
Commission, n.d.). Thus, the building consumption
data has to be investigated to understand buildings
potential in terms of flexibility and demand response.
The Department Of Energy (DOE) from the
U.S.A. within the Building Technologies program
prepares the datasets aiming to enhance the energy
efficiency in buildings. The data profiles represent the
reference models for 16 building types: 15
commercial buildings and 1 multifamily residential
building (Office of Energy Efficiency & Renewable
Energy (EERE), n.d.), (National Renewable Energy
Laboratory, 2011a). Also, several classifications of
the buildings are proposed in (Alves, Monteiro, Brito,
& Romano, 2016; Heinzerling, Schiavon, Webster, &
Arens, 2013; Pääkkönen & Pakkala, 2015). The
buildings are spread in 936 locations covering all
U.S.A. climate areas. The load profile consists in
totals for electricity and gas. Moreover, detailed
information regarding electricity and gas
consumption are stored, such as cooling, heating,
lights, equipment, water heater, etc. as in Table 1. The
existence of the two sources gas and electricity allow
the thermal energy storage using the water heater
tanks (Heier, Bales, & Martin, 2015) and also Power-
to-Gas (P2G) conversion, but these approaches are
outside the scope of this paper.
118
Oprea, S., Bâra, A., Ceaparu, C., Ducman, A., Diaconit
,
a, V. and Dobrit
,
a Ene, G.
Insights with Big Data Analysis for Commercial Buildings Flexibility in the Context of Smart Cities.
DOI: 10.5220/0010409801180124
In Proceedings of the 10th International Conference on Smart Cities and Green ICT Systems (SMARTGREENS 2021), pages 118-124
ISBN: 978-989-758-512-8
Copyright
c
2021 by SCITEPRESS – Science and Technology Publications, Lda. All rights reserved
The consumption data could be combined with
weather forecast that can be scraped from various
web services considering the main climatic areas
(National Renewable Energy Laboratory, 2011b) and
flexibility potential estimation in different studies
(Ryan Hledik Ahmad Faruqui, 2019), (Hledik,
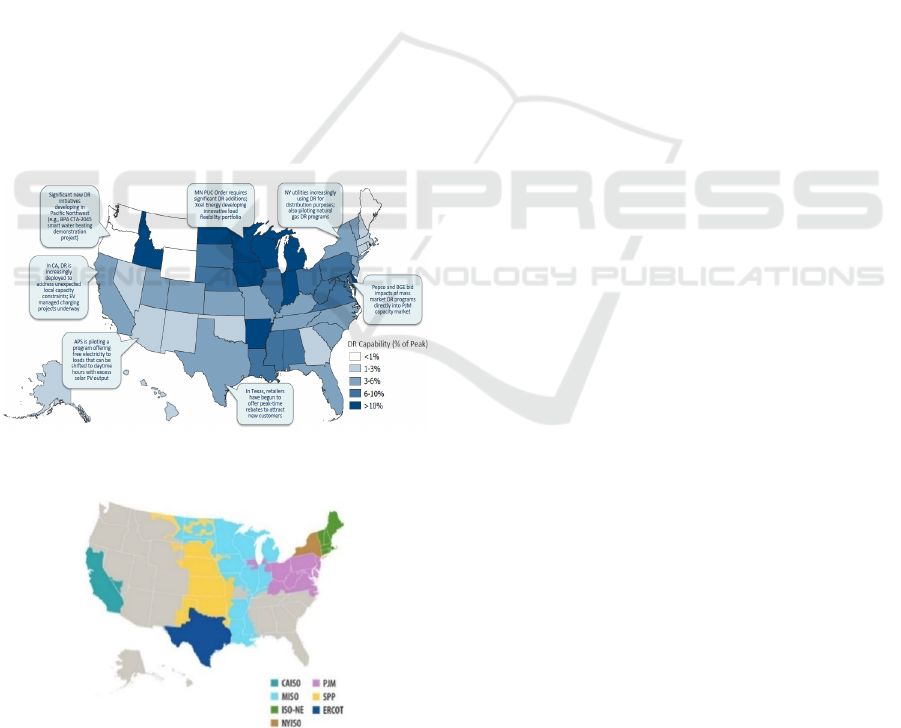
Faruqui, Lee, & Higham, 2019) as in Figure 1
providing interesting insights into the demand
response level of the commercial buildings.
Also, the consumption datasets could be grouped
by the Independent System Operators (ISO) that
manage the area where consumers are located as in
Figure 2 and combined with DR enabling
technologies costs (Potter & Cappers, 2017) to
identify the net benefits that commercial buildings
can obtain from shimmy, shed and shift of the flexible
appliances. However, the very large and various
datasets that are continuously flowing from meters
and other sensors require big data processing
(Pääkkönen & Pakkala, 2015), (Mathew et al., 2015),
(Linder, Vionnet, Bacher, & Hennebert, 2017).
Therefore, this is a theoretical approach that
combines different aspects to identify the flexibility
potential and possible outcome of the commercial
buildings for a specific area. Considering the large
datasets, big data techniques are required.
Figure 1: Demand response capability estimation in 2017
(Hledik et al., 2019).
Figure 2: Independent System Operators.
2 BIG DATA METHODOLOGY
TO HANDLE VERY LARGE
DATASETS
Big Data consists of datasets whose size and structure
exceed the processing capacities of traditional
programs (databases, software, etc.) for the
collection, storage and processing of data in a
reasonable time. The data can be structured, semi-
structured and unstructured, and this division makes
it impossible to manage and process efficiently with
traditional technology.
When discussing about the analysis of large
datasets, we can say that there is no commonly
agreed, standard methodology of analysis that can be
followed. On a regular basis, when the business
requirement is defined, an analysis process takes
place to outline the methodology that can be used.
The following steps were followed for the current
study.
2.1 Analysis of the Datasets
It is important to identify from the beginning what
type of data we will work with (structured,
unstructured, semi-structured) and what its volume is.
We also need to know if we are handling data in
motion or data at rest and how they are
sent/organized/stored.
Once the data type is clarified, the next step is to
clean up the datasets. The data-cleaning process is a
mandatory prerequisite, and it represents the perfect
way to kick off the analysis. This ensures the
accuracy of the datasets that are going to be analysed.
Through this process, data is filtered appropriately,
and the outcome is free of invalid, old/obsolete and
doubtful data. However, one has to keep in mind that
the reliability of the input data is closely related to the
source of their acquisition. Therefore, as a general
rule of thumb, we need to ensure from the beginning
that the latest, most complete and auditable datasets
are used for the analysis.
For the current study, the data analysed has the
following coordinates: it is structured data, at rest,
stored in .csv format. The datasets contain a number
of 14,976 .csv files with a total of 131.18 million
records. Given the large volume of the datasets,
above-average computing resources were required.
The working station used for processing having the
following configuration: two processors @2.5GHz
having 20 cores and 40 logical processors, a RAM
memory of 64.0 GB, a video card with 8 GB
dedicated memory and a storage capacity of 2.5 TB.
Insights with Big Data Analysis for Commercial Buildings Flexibility in the Context of Smart Cities
119
Additionally, just to follow on the above-mentioned
process, it is worth mentioning that no clean-up
process was needed, as the datasets were created for
research. The data structure of the .csv files is provided
in Table 1. Therefore, fans, cooling and heating
consumption from Table 1 are assumed to be flexible
and targeted for DR programs. The volume of data
profiles for commercial buildings is over one hundred
three thousand million records as they classify into 16
categories of buildings (as in Table 2) and 936 main
locations of the U.SA. The profile is done at hourly
resolution for 8760 hours. The datasets for commercial
buildings represent a multi-year reference by location,
created for modelling (Touzani, Granderson, &
Fernandes, 2018) and research.
Table 1: Consumption breakdown for commercial
buildings.
No. Columns in the datasets
1 Date/Time
2 Electricit
y
:Facilit
y
3 Fans:Electricit
y
4 Coolin
g
:Electricit
y
5 Heating:Electricit
y
6 InteriorLights:Electricit
y
7 InteriorE
q
ui
p
ment:Electricit
y
8 Gas:Facilit
y
9 Heatin
g
:Gas
10 InteriorEquipment:Gas
11 Water Heater:WaterSystems:Gas
Table 2: Categories of buildings.
No. Cate
g
or
y
1 Small Office
2 Medium Office
3 Large Office
4 Primary School
5 Secondar
y
School
6 Stan
d
-A lone Retail
7 Stri
p
Mall
8 Supermarket
9 Quick Service Restaurant
10 Full Service Restaurant
11 Small Hotel
12 Lar
g
e Hotel
13 Hos
p
ital
14 Outpatient Healthcare
15 Warehouse
16 Midrise A
p
artment
2.2 Data Pre-processing
This stage is an important one and it involves
structuring data into appropriate formats and types.
As previously mentioned, when performing an
analysis, we may encounter structured, semi-
structured and unstructured data. Data pre-processing
is done through normalization and aggregation
techniques. This transformation process ensures data
is easily readable by the applied processing
algorithms.
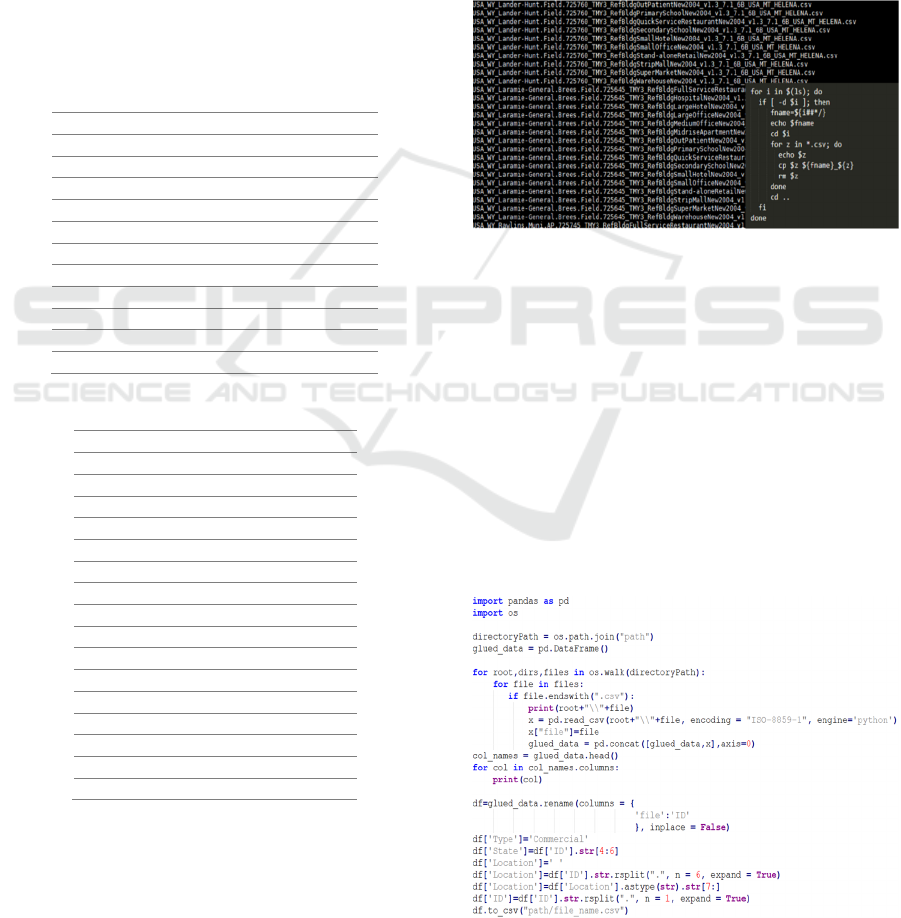
Pre-processing for this study consisted in
preparing the data for analysis, by extracting files
from archives and renaming them (prefixing with the
file name) as in Figure 3. This process was mandatory
as it prevented potential cases of data overwriting
after extracting it from the various archive (files with
the same name, but belonging to different locations).
Figure 3: Extracting and renaming .csv files.
The files have been processed to add information
about the U.S.A state, as well as the city where the
consumption took place. Additional checks and
renaming were performed on the structure of data and
labels as in Figure 4, as well as for the identification
and replacement of null values, when needed. Once
the pre-processing was over, it could be observed that
the volume of the data files increased and went more
than double (from 15 GB to 35 GB). Subsequently, in
order to provide flexibility when choosing the most
appropriate analysis techniques and tools, a large .csv
file was created by merging all the .csv files as in
Figure 5.
Figure 4: Python code for data pre-processing.
SMARTGREENS 2021 - 10th International Conference on Smart Cities and Green ICT Systems
120
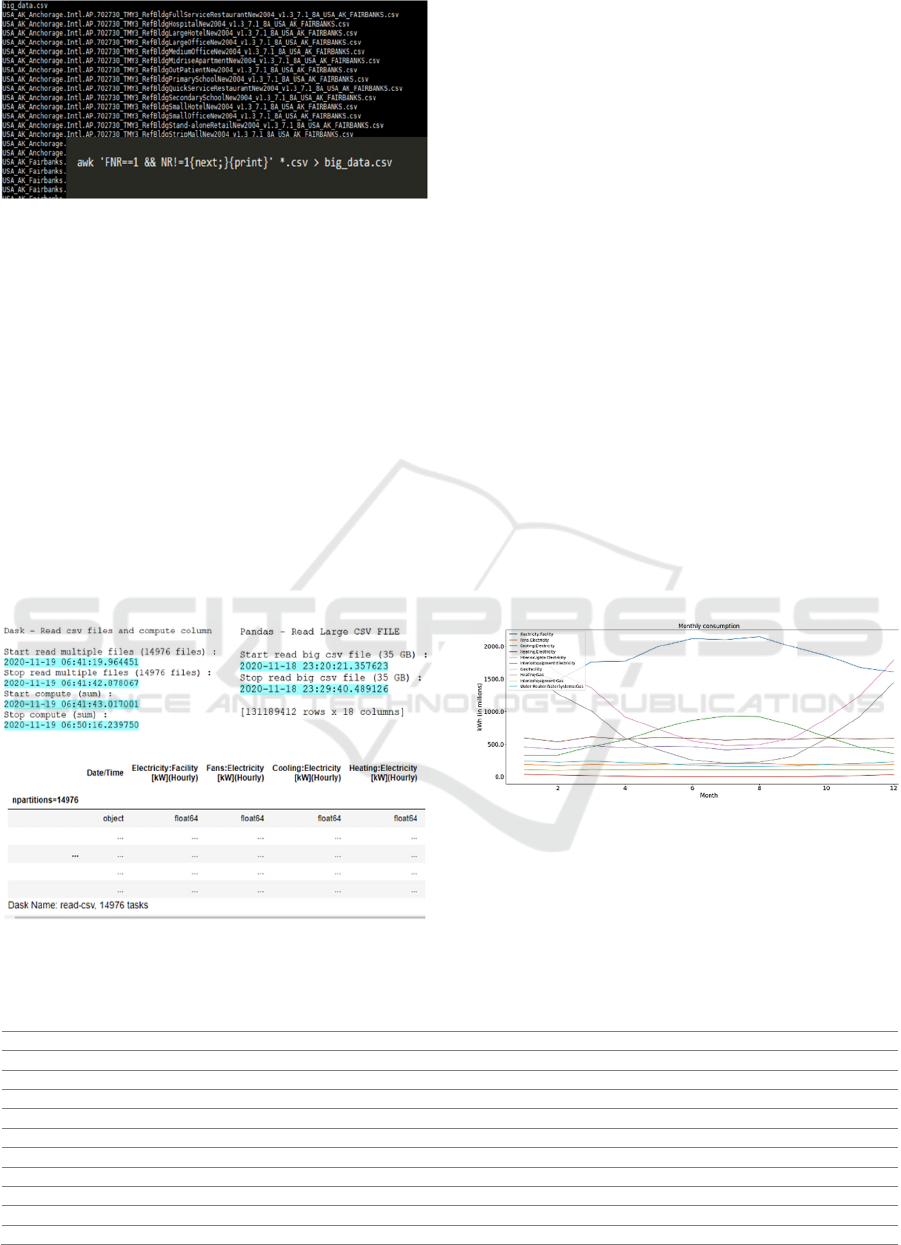
Figure 5: Code for .csv merge.
2.3 Data Processing (Tool,
Technologies, and Frameworks)
A great variety of tools can be used for the analysis of
a large set of data, all of them depending on the nature
of the topic/context that needs to be solved. However,
as a mandatory step, we must consider the computing
power resources before choosing the right framework
and processing tools. Opting for the most appropriate
technology has to rely on a detailed analysis which
should identify both the problem that has to be solved,
as well as the volume of data that needs to be process
and the available resources.
For our data analysis, Hadoop and Python are
successfully used. Files were stored in HDFS and
Figure 6: Statistics for .csv read performance Dask vs
Pandas.
analysis was performed in Python using Pandas and
Dask (that is an open-source library for parallel
computing) to save both time and resources. For data
representation Tableau or Power BI can be also used,
but we extracted graphics with Python libraries such
as Matplotlib or Seaborn. Time for reading multiple
files reduces significantly with Dask as in Figure 6.
An alternative for this kind of processing can be
provided by analysis done with Hive. The data can be
imported into a Hive table and then analysed either
through Hive SQL queries or using Spark.
3 SIMULATION AND RESULTS
First, we started the analysis on the reduced dataset
by generating descriptive statistics as in Table 3.
Consumption values for each category were
calculated on monthly and hourly intervals as in
Figures 7 and 8. A downward curve for gas
consumption can be observed during the warm and
hot times of the year (later spring, summer, early fall),
whereas, during that same period, the electricity goes
on an upward curve. This surplus of the electricity is
directly influenced by Cooling, that is specific for the
hot months of the year.
Figure 7: Monthly consumption.
It can be observed that main electricity
consumption hours are between 5 AM – 10 PM, with
peaking trends between 8 AM –9 PM. Gas peak hours
are noticed especially in the morning, around 7 AM
and in the evening.
Table 3: Descriptive statistics.
count(millions) mean std min 25% 50% 75% Max
Electricity:Facility 131.2 203.36 326.97 0.00 25.63 62.47 218.63 2005.33
Fans:Electricity 131.2 17.22 27.37 0.00 0.56 4.63 26.80 377.56
Cooling:Electricity 131.2 56.08 136.25 0.00 0.00 0.16 23.97 1028.13
Heating:Electricity 131.2 1.12 7.53 0.00 0.00 0.00 0.00 326.60
InteriorLights:Electricity 131.2 41.00 74.97 0.00 3.79 15.86 43.51 448.57
InteriorEquipment:Electricity 131.2 53.20 83.21 0.00 8.09 20.64 53.24 448.57
Gas:Facility 131.2 96.30 204.76 0.00 2.19 18.20 88.33 5292.60
Heating:Gas 131.2 67.74 183.82 0.00 0.00 0.02 52.18 5281.64
InteriorEquipment:Gas 131.2 10.16 18.42 0.00 0.00 2.34 9.91 91.80
Water Heater:WaterSystems:Gas 131.2 18.40 57.80 0.00 0.02 1.17 9.63 783.88
Insights with Big Data Analysis for Commercial Buildings Flexibility in the Context of Smart Cities
121
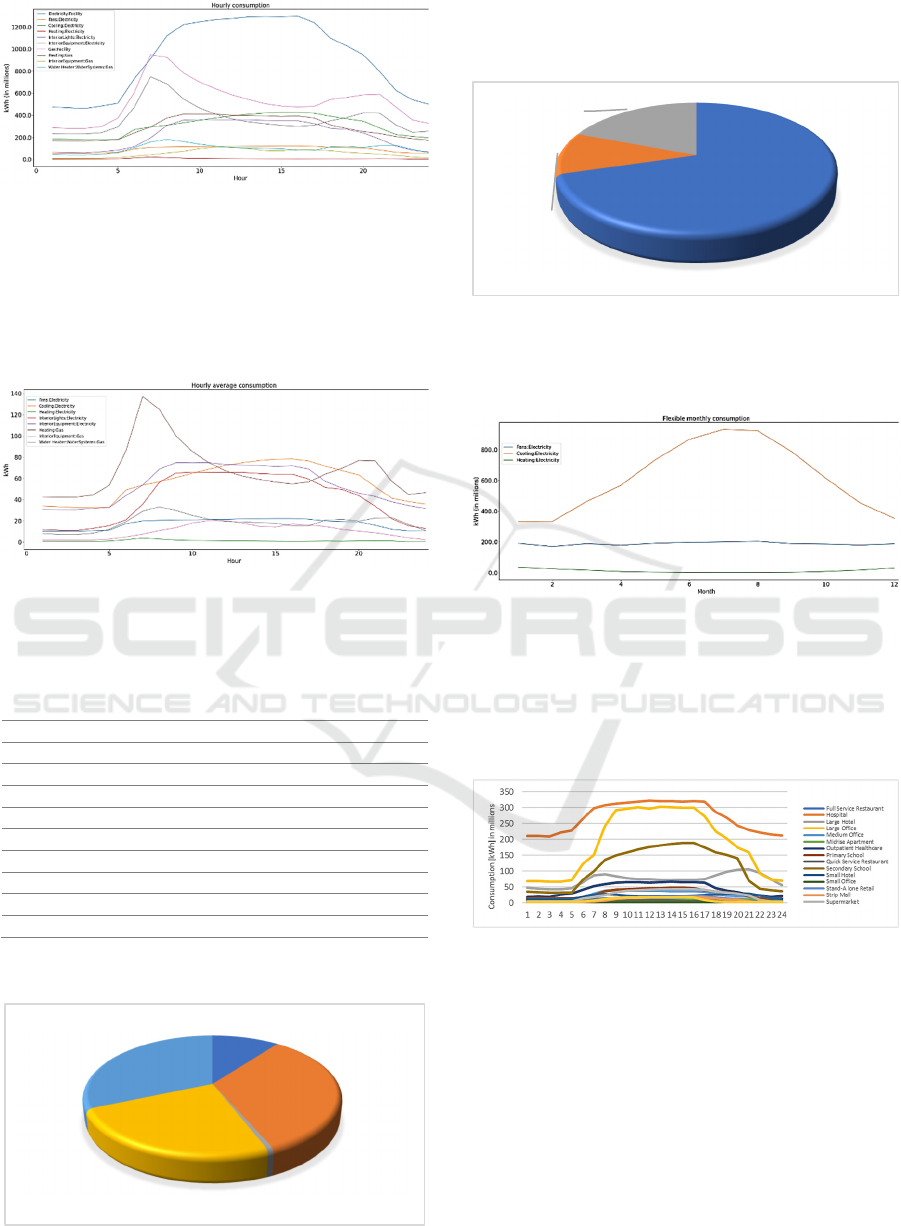
Figure 8: Hourly consumption.
The hourly average consumption at the appliances
level is provided in Figure 9. We can notice that the
electricity load peak is heavily influenced by
InteriorLights, InteriorEquipment (non-controllable)
and Cooling that is controllable. Also, Heating
significantly influences the gas load peak.
Figure 9: Hourly average consumption.
The total consumption and its breakdown for
electricity and gas are provided in Table 4.
Table 4: Total consumption.
Electricity:Facility 22,121,741,306.97
Fans:Electricit
y
2,259,308,217.61
Coolin
g
:Electricit
y
7,357,244,868.11
Heatin
g
:Electricit
y
146,757,948.57
InteriorLights:Electricit
y
5,378,513,423.55
InteriorEquipment:Electricit
y
6,979,916,849.15
Gas:Facilit
y
12,633,452,795.87
Heatin
g
:Gas 8,887,262,369.10
InteriorE
q
ui
p
ment:Gas 1,332,694,124.33
Water Heater:WaterS
y
stems:Gas 2,413,496,302.44
The graphical breakdown on electricity and gas
consumption is provided in Figures 10 and 11.
Figure 10: Electricity Facility – Components.
It can be observed that flexible consumption
(Fans, Cooling and Heating consumption from Table
1) represents 44% of total electricity consumption.
Figure 11: Gas Facility – Components.
The largest share is held by Cooling, with a large
increase during the hot months as in Figure 12.
Figure 12: Flexible monthly consumption.
Grouping the electricity and gas consumption by
building type, we can notice that Hospital, Large
Office, Secondary School and Large Hotel have the
largest share in both cases as in Figure 13 and Figure
14.
Figure 13: Hourly electricity consumption per building
type.
The Heating, Cooling and Fans consumptions are
analysed from the flexibility point of view. The
hourly flexibility capability for commercial buildings
is shown also in Figure 15. It represents around 44%
of the total consumption. Grouping the flexibilities by
ISO (as in Figure 2), ERCOT and SOUTHEAST have
higher total flexibility (51%) on average as in Figure
16.
Fans:Electricity
[kW](Hourly)
10%
Cooling:Electricit
y[kW](Hourly)
33%
Heating:Electrici
ty[kW](Hourly)
1%
InteriorLights:El
ectricity
[kW](Hourly)
24%
InteriorEquipme
nt:Electricity
[kW](Hourly)
32%
Heating:Gas
[kW](Hourly)
70%
InteriorEquipme
nt:Gas
[kW](Hourly)
11%
Water
Heater:WaterSys
tems:Gas
[kW](Hourly)
19%
SMARTGREENS 2021 - 10th International Conference on Smart Cities and Green ICT Systems
122
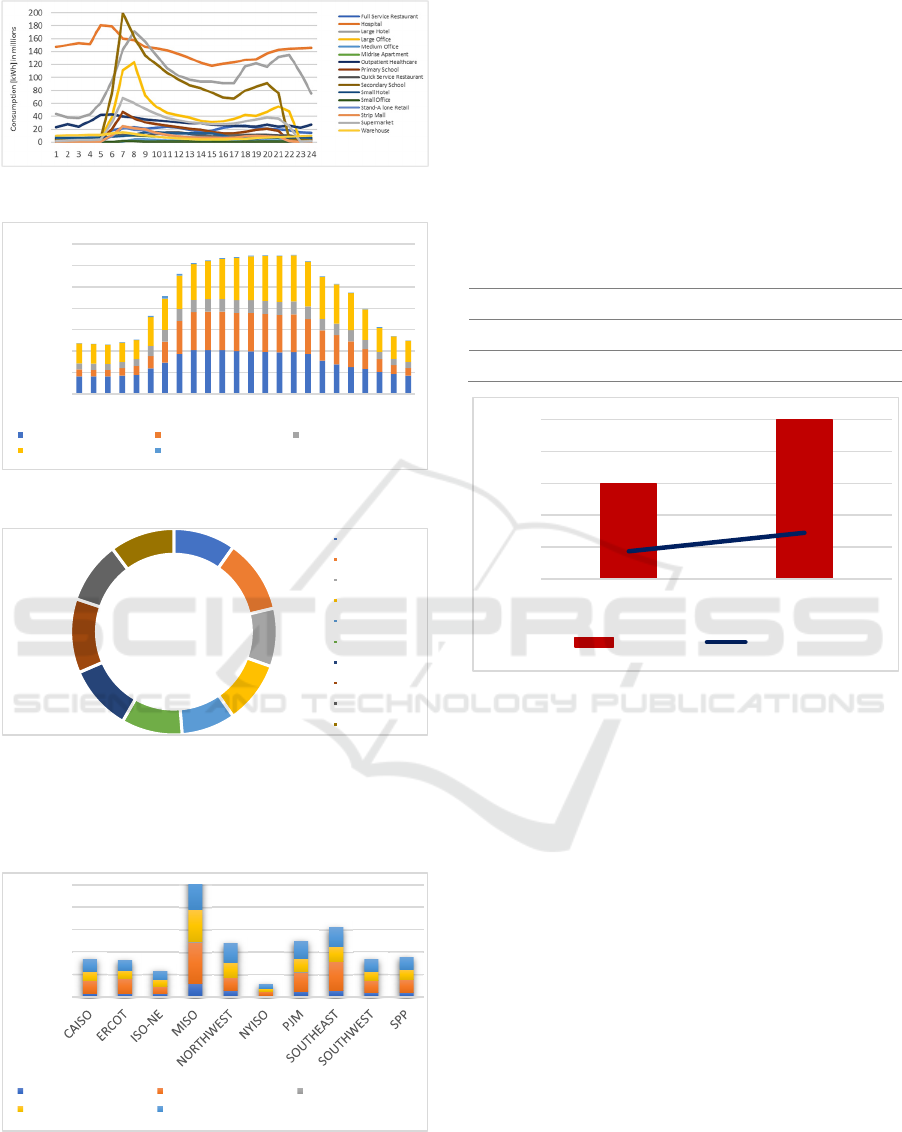
Figure 14: Hourly gas consumption per building type.
Figure 15: Electricity load curve by components.
Figure 16: ISO flexibility capability.
The consumption breakdown by ISO is provided
in Figure 17. The highest consumptions are recorded
by MISO, SOUTHEAST and PJM.
Figure 17: Electricity load by ISO.
Correlating the consumption datasets with DR
capabilities from Figure 1, the results are summarized
in Table 5 and Figure 18. There is a multitude of DR
programs that can be applied for commercial
buildings. They can offer shift, shimmy and shed
services. However, shimmy and combinations of shed
and shift require higher DR technology enablement
Costs that can go up to 2,000$ per controllable
appliance (Potter & Cappers, 2017). That we propose
ALL SHIFT that represents a DR program that
involves that the operation of Cooling, Fans and
Heating is partially shifted from peak to off-peak
hours.
Table 5: Annually results of ALL SHIFT DR program.
ALL SHIFT Shifted energy Savings in Euro
Scenario 20% 149916969.4 17990036.32
Scenario 33% 249861615.6 29983393.87
Figure 18: Results of shifting the controllable appliance for
commercial buildings.
The savings that could be obtained from ALL
SHIFT DR program are calculated considering the
tariff rate difference (0.21 Euro/kWh peak rate and
0.09 Euro/kWh off-peak rate). The annually shifted
energy and savings are calculated in two scenarios:
Scenario 20% and Scenario 33% represent the time
share when the controllable appliances are involved
in the DR program. The savings from shifting are
significant and could range between 17 and 29
million Euro.
4 CONCLUSION
The commercial buildings generate a very large
volume of data that requires big data technologies to
assess the flexibility of the electricity consumption
and estimate potential savings. Thus, we propose a
big data processing framework that combines Hadoop
and Multi-processing and Dask packages of Python to
extract interesting insights from very large datasets
0
200000000
400000000
600000000
800000000
1000000000
1200000000
1400000000
1357911131517192123
InteriorEquipment:Electricity InteriorLights:Electricity Fans:Electricity
Cooling:Electricity Heating:Electricity
42%
51%
40%
43%
37%
41%
45%
51%
42%
44%
CAISO
ERCOT
ISO‐NE
MISO
NORTHWEST
NYISO
PJM
SOUTHEAST
SOUTHWEST
SPP
0
1000000000
2000000000
3000000000
4000000000
5000000000
Fans:Electricity Cooling:Electricity Heating:Electricity
InteriorLights:Electricity InteriorEquipment:Electricity
0
50000000
100000000
150000000
200000000
250000000
Scenario20% Scenario33%
Flexibility Savings
Insights with Big Data Analysis for Commercial Buildings Flexibility in the Context of Smart Cities
123

and identify the consumption flexibility of the
commercial buildings of several types from the U.S.A
in correlation with the DR capabilities. Using
commercial building data sets from the U.S.A and
findings of other studies from previous research, we
proposed and implemented a DR program namely
ALL SHIFT and estimated the flexibility potential in
terms of shifted energy and savings. The results show
a significant potential for savings that commercial
buildings can achieve using their consumption
flexibility. For data graphical representation, in future
research, we will use Power BI that is a powerful
open-source tool. We also plan to extend the study
and create a comprehensive data model that integrate
more data sources and enhance the results.
ACKNOWLEDGEMENTS
This work was supported by a grant of the Romanian
National Authority for Scientific Research and
Innovation, CCCDI – UEFISCDI, project title “Multi-
layer aggregator solutions to facilitate optimum
demand response and grid flexibility”, contract number
71/2018, code: COFUND-ERANET-
SMARTGRIDPLUS-SMART-MLA-1, within
PNCDI III. This paper is an extension of the scientific
results of the project “Intelligent system for trading on
wholesale electricity market” (SMARTRADE), co-
financed by the European Regional Development Fund
(ERDF), through the Competitiveness Operational
Programme (COP) 2014–2020, priority axis 1 –
Research, technological development and innovation
(RD&I) to support economic competitiveness and
business development, Action 1.1.4-Attracting high-
level personnel from abroad in order to enhance the RD
capacity, contract ID P_37_418, no. 62/05.09.2016,
beneficiary: The Bucharest University of Economic
Studies.
REFERENCES
Alves, O., Monteiro, E., Brito, P., & Romano, P. (2016).
Measurement and classification of energy efficiency in
HVAC systems. Energy and Buildings.
https://doi.org/10.1016/j.enbuild.2016.08.070
European Commission. (n.d.). Building consumption by
energy. Retrieved October 30, 2020, from
https://ec.europa.eu/energy/content/building-
consumption-energy_en
Hao, H., Corbin, C. D., Kalsi, K., & Pratt, R. G. (2017).
Transactive Control of Commercial Buildings for
Demand Response. IEEE Transactions on Power
Systems. https://doi.org/10.1109/TPWRS.2016.2559485
Heier, J., Bales, C., & Martin, V. (2015). Combining thermal
energy storage with buildings - A review. Renewable and
Sustainable Energy Reviews. https://doi.org/10.1016/
j.rser.2014.11.031
Heinzerling, D., Schiavon, S., Webster, T., & Arens, E.
(2013). Indoor environmental quality assessment
models: A literature review and a proposed weighting
and classification scheme. Building and Environment.
https://doi.org/10.1016/j.buildenv.2013.08.027
Hledik, R., Faruqui, A., Lee, T., & Higham, J. (2019). The
National Potential for Load Flexibility: Value and
Market Potential through 2030. Retrieved November 2,
2020, from https://brattlefiles.blob.core.windows.net/
files/16639_national_potential_for_load_flexibility_-
_final.pdf
Kahn, M., Kok, N., & Quigley, J. (2013). Commercial
Building Electricity Consumption Dynamics: The Role
of Structure Quality, Human Capital, and Contract
Incentives. NBER Working Paper Series.
Linder, L., Vionnet, D., Bacher, J. P., & Hennebert, J. (2017).
Big Building Data-a Big Data Platform for Smart
Buildings. In Energy Procedia. https://doi.org/10.1016/
j.egypro.2017.07.354
Mathew, P. A., Dunn, L. N., Sohn, M. D., Mercado, A.,
Custudio, C., & Walter, T. (2015). Big-data for building
energy performance: Lessons from assembling a very
large national database of building energy use. Applied
Energy. https://doi.org/10.1016/j.apenergy.2014.11.042
National Renewable Energy Laboratory. (2011a). U.S.
Department of Energy Commercial Reference Building
Models of the National Building Stock. Retrieved
October 30, 2020, from https://www.nrel.gov/docs/
fy11osti/46861.pdf
National Renewable Energy Laboratory. (2011b). U.S.
Department of Energy Commercial Reference Building
Models of the National Building Stock.
Office of Energy Efficiency & Renewable Energy (EERE).
(n.d.). Commercial and Residential Hourly Load Profiles
for all TMY3 Locations in the United States. Retrieved
October 30, 2020, from https://openei.org/datasets/
dataset/commercial-and-residential-hourly-load-
profiles-for-all-tmy3-locations-in-the-united-states
Pääkkönen, P., & Pakkala, D. (2015). Reference Architecture
and Classification of Technologies, Products and
Services for Big Data Systems. Big Data Research.
https://doi.org/10.1016/j.bdr.2015.01.001
Potter, J., & Cappers, P. (2017). Demand Response
Advanced ControlsFramework and Assessment of
Enabling Technology Costs. Retrieved November 2,
2020, from https://emp.lbl.gov/sites/default/files/dem
and_response_advanced_controls_framework_and_cost
_assessment_final_published.pdf
Ryan Hledik Ahmad Faruqui. (2019). Brattle Study: Cost-
Effective Load Flexibility Can Reduce Costs by More
Than $15 Billion Annually. Retrieved October 30, 2020,
from https://www.brattle.com/news-and-knowledge/
publications/the-national-potential-for-load-flexibility-
value-and-market-potential-through-2030
Touzani, S., Granderson, J., & Fernandes, S. (2018). Gradient
boosting machine for modeling the energy consumption
of commercial buildings. Energy and Buildings.
https://doi.org/10.1016/j.enbuild.2017.11.039
SMARTGREENS 2021 - 10th International Conference on Smart Cities and Green ICT Systems
124
