
User Experience and Analysis of an Autonomous Shuttle Service
Lova Andersson, Allegra Ayala, Shuan Chan, Kyle Hickerson, Liam Kettle, Lindsey A. Malcein
and Yi-Ching Lee
a
Department of Psychology, George Mason University, Fairfax, Virginia, U.S.A.
Keywords: Autonomous Shuttle, User Experience, Driving Automation Systems, Ridesharing, Public Transportation.
Abstract: As the use of autonomous vehicles for public transportation becomes more prevalent, it is important to
examine characteristics of potential users and their perception of the service. This study aimed to capture user
opinions and feedback from both riders and non-riders concerning an autonomous shuttle service. Potential
differences in user groups were examined as well, comparing employees of the Department of Defense to
civilian users. Participants generally held positive opinions about the shuttle, although riders were more likely
to rate the service favourably. Civilian users were also more likely to rate the shuttle favourably and more
often claimed that they would recommend it to others. The youngest participants tended to report higher levels
of agreement and acceptance on perceived safety and intelligence as well as the shuttle’s avoidance of
obstacles and obedience of traffic rules. Research in this area has implications for all facets of the
transportation industry as well as future users of autonomous public transportation.
1 INTRODUCTION
The Society of Automotive Engineers International
defines Driving Automation Systems as motor
vehicle driving automation systems that perform part
or all of the dynamic driving task on a sustained basis,
with further classifications for six levels of driving
automation, ranging from no driving automation
(Level 0) to full driving automation (Level 5) (SAE
International, 2018). Colloquially, “autonomous” or
“driverless” has been used to describe the major
feature of the Level 5 driving automation systems -
vehicles that can drive without human control
(Ruijten, 2018). Over the past several years, there has
been a push for the development and use of
autonomous vehicles (AV). A major motivator for
this has been the potential for increased roadway
safety. In 2015, the US National Highway Traffic
Safety Administration found that in 94% of
automobile crashes, fault was assigned to the driver,
meaning that human error played a role in the
accident. In their examination, these critical reasons
were classified into recognition errors, decision
errors, performance errors, and non-performance
errors (Singh, 2015). AVs have the potential to
mitigate various types of human errors in driving and
a
https://orcid.org/0000-0002-9383-4105
could play a significant role in accident reduction on
the roadways. With full implementation of AVs, it is
predicted that accidents could be reduced by up to
90%, which, in turn, could potentially save up to $190
billion in the healthcare costs that are associated with
these accidents (Bertoncello & Wee, 2015). Besides
safety, AV technology is also able to provide mobility
for non-drivers such as the young, the elderly, and
people with physical disabilities (Alkan, 2017).
Other recent research has focused on the benefits
of autonomous public transportation. One example of
this is autonomous shuttles (AS) or buses (AB). Like
autonomous personal vehicles, safety plays an
important role in the design and implementation of
AS. They also operate in environments where
unpredictable situations are inevitable, such as
interactions with pedestrians, intersections without
traffic lights, and roundabouts (Wang et al., 2018).
Passenger acceptance and willingness to ride the
AS should be considered in the design and
implementation of these shuttles. There are three key
factors that have been shown to determine
passengers’ acceptance of AS: safety, comfort, and
convenience (Eden et al., 2017). A study by Dong et
al. (2017) on an AB service in Philadelphia gave
further insight into passenger acceptance. Of the 891
370
Andersson, L., Ayala, A., Chan, S., Hickerson, K., Kettle, L., Malcein, L. and Lee, Y.
User Experience and Analysis of an Autonomous Shuttle Service.
DOI: 10.5220/0010408703700377
In Proceedings of the 7th International Conference on Vehicle Technology and Intelligent Transport Systems (VEHITS 2021), pages 370-377
ISBN: 978-989-758-513-5
Copyright
c
2021 by SCITEPRESS – Science and Technology Publications, Lda. All rights reserved

surveyed riders, two-thirds were willing to ride in an
AB when a transit employee, who could perform take
over requests, was also on board. Only 13% of those
surveyed would agree to ride in the bus in the absence
of a transit employee. In addition, those under the age
of 45 years were more willing to ride in an AB –
possibly due to greater exposure to various digital
features and automated technology in this age group.
These results show optimism for an increase in
acceptance of automated technologies as younger
generations grow with the advancement of automated
technologies and along with it bring less scepticism
(Dong et al., 2017). In line with these results, the
Mcity research project conducted at the University of
Michigan found that riders were more likely than
non-riders (86% vs. 66%) to report trust in an AS
service (Kolodge et al., 2020). These findings further
emphasize the idea that exposure to technology may
have an effect on acceptance of technological
advancements.
In the past decade, there have been major shifts in
the public transportation market. With these shifts,
there has been a significant increase in the use of app-
based transportation services. For example, within the
past five years, the ridesharing industry has greatly
increased its share in the transportation market due to
easy accessibility and convenience. In 2016,
ridesharing apps such as Uber and Lyft surpassed
taxis in New York City for total number of pickups
(Wagner et al., 2018). A fairly recent implementation
within this ridesharing industry has been the use of
AVs. Starting in 2015, Uber started testing AVs in
Pittsburgh, Phoenix, and Toronto. Along with AV
Ubers and AV shuttles, driverless taxis have recently
been tested in Japan in 2018. The trial lasted roughly
one month and took place on a 5.3 km route that was
mapped out. In all, around 1,500 people applied to be
passengers in this study (Chowdhury, 2018).
Another major factor that plays a role in a
person’s acceptance is comfort. As AS becomes more
prominent, it is also important to design the shuttles
in a way that is comfortable for all passengers. The
layout of seating on public transportation plays a role
in the social comfort of passengers (Thomas, 2009).
Seating layouts that force passengers into close
proximity with strangers can lead to social discomfort
(Thomas, 2009). In a ridesharing context, seating
impacts both passengers’ privacy and comfort (Ong
et al., 2019). The lack of passengers’ privacy and
comfort during rides is further exacerbated when in
the presence of others; this could be dependent on
whether the riders are familiar with each other. For
instance, a study investigated social interactions on
railway transit and found that people who were
familiar with one another, such as friends, were less
reserved and interacted more (Bissell, 2010). Those
who are sharing rides with familiar people, such as
friends or regulars, may be less bound by the social
tension that is created through a close quarters seating
layout. Additionally, seat availability and design may
serve to influence general comfort. Seats with clearly
defined boundaries and separation from others are
more ideal to passengers (Lombardi & Ciceri, 2019).
Most user acceptance studies in the context of
AVs to date focused on passenger cars, little has been
done to look at the perceptions people have of larger
AVs such as shuttles. The current research focuses
specifically on perceptions of an AS service and the
likelihood to recommend this mode of transportation.
This study is a secondary data analysis on an AS
feasibility study conducted at a military base. Details
of the study can be found in Allen et al. (2020).
2 METHODOLOGY
2.1 Description of the Autonomous
Shuttles
The dimensions of the exterior of the AS are 12.86
feet by 6.73 feet with a height of 8.20 feet. The
wheelbase of the vehicle extends to 8.29 feet. The
interior height reaches 6.40 feet. Each AS can carry
up to 1,350 pounds, an estimated maximum of twelve
passengers, but only eight seats are present in this
model of AS. This passenger limit must also include
the safety operator. The AS can travel an average
distance of 40 miles at nominal conditions, and 25
miles if operating with the maximum load and
maximum air conditioning. The maximum speed is
25 mph and one and a half hours is required to reach
a full charge. The AS was programmed to operate on
a defined route at the military base, and a safety
operator was required to be present during all
operations and to take-over manual control of the AS
if necessary.
2.2 Study Procedures and Data
Collection
This research consisted of two phases: a pilot,
invitational phase (during July 2019) and a main
study (from late August to end of September 2019).
2.2.1 Pilot Study
During the pilot phase, the study team invited
individuals who worked on- and off-base (including
User Experience and Analysis of an Autonomous Shuttle Service
371

officials from other Department of Defense (DoD)
and Federal agencies as well as organizations in the
local area) to either observe the operations of the AS
or ride the AS. This study received Institutional
Research Board approval from the authors’ university
and US Army Engineer Research and Development
Center’s Construction Engineering Research
Laboratory. Upon experiencing the AS (either as a
rider or a non-rider observer), participants were asked
to complete either a paper version of the survey (on-
site) immediately or an electronic version of the
survey administered by the AS company (on-line)
within a few days. It took approximately five minutes
to complete the survey.
Of the 47 valid responses, all participants were
passengers who had ridden the shuttle either one or
two times. The mean age of this data set was 44.4
years (SD = 11.29). No other demographic
information was collected. A fourth of participants
(25.53%) lived or worked on the base; 10.64% of
participants worked for the DoD but did not live on
base, while the remainder (63.83%) of participants
did not work for the DoD. Participants received their
information about the shuttle primarily from the
onboard safety operators (91.48%), while some
participants heard from media (14.89%), word of
mouth (4.26%), and information operator
publications (4.26%). Three participants received no
information before their ride (6.38%).
2.2.2 Main Study
The study team welcomed anyone who worked on-
and off-base to experience the AS, which operated
during a two-hour lunch period. Through
advertisements, personnel who worked or lived on-
base, visitors to the base, and individuals who heard
about the AS could ride the AS and consent to
participate in the main study. This study received
Institutional Research Board approval from the
authors’ university and US Army Engineer Research
and Development Center’s Construction Engineering
Research Laboratory. Upon experiencing the AS
(either as a rider or a non-rider observer), participants
were asked to complete either a paper version of the
survey (on-site) immediately or an electronic version
of the survey administered by the AS company (on-
line) within a few days. It took approximately five
minutes to complete the survey. A total of 21
questions were included in the survey: most of the
items were identical to those used during the pilot
study, but some adjustments and additions were
deemed necessary to capture the demographics of the
riders and non-riders during the main study. For
example, one question asked for participants’ normal
mode of travel on base and another asked for the
likelihood of recommending this service to others.
The same Likert-scale questions were included, with
the comfort rating being divided into two questions;
the first for riders and the second for non-rider
observers. An additional Likert-scale question asked
for the perceived value of the AS operating on the
base. The survey then asked if the riders would use
the service again. Participants were able to give open-
ended feedback at two points during the survey.
Participants who reported interacting with the AS
as a safety operator and those listed as “Other” were
removed from data analysis (n = 5). Participants who
had taken the survey multiple times were also
removed (n = 3). Of the remaining 98 valid responses,
67 were passengers (31 were non-rider observers).
The mean age of this data set was 37.71 years (SD =
14.85). The mean age for passengers was 40.62 years
(SD = 14.04) and the mean age for non-rider
observers was 31.40 years (SD = 14.82). No other
demographic information was collected. About half
(49.47%) of participants worked for the DoD. Almost
half of the participants travelled around the base in a
personal vehicle (47.96%), while the next largest
group walked (17.35%). The majority of participants
had been a passenger on the shuttle one to two times
(68.37%).
2.3 Simple Correspondence Analysis
Simple Correspondence Analysis (SCA) is an
exploratory method for visualizing contingency
tables on graphs and trends in the data (Clausen,
1998). The only assumption of SCA is that the values
are non-negative. In addition, outliers defined as one
standard deviation away from the centroid (origin)
were removed because they compress the SCA plots
and make interpretation difficult (Bendixen, 2003).
The units on the plots are standard deviations from
the centroid.
SCA was used to visualize participants’
perception of the AS service and technology across
three age groups. The six variables about the AS
service and technology were: Perceived Intelligence,
Regular Use of Shuttle, Perceived Safety, Perceived
Trustworthiness, Avoidance of Obstacles, and
Obedience of Traffic Rules. Participants rated their
level of agreement (strongly disagree to strongly
agree) for the first four variables and level of
acceptance (totally unacceptance to perfectly
acceptance) for the last two variables. Age was
collected as a continuous variable but for the purposes
of SCA, it was binned to have equal N across groups.
VEHITS 2021 - 7th International Conference on Vehicle Technology and Intelligent Transport Systems
372

Initially, we hypothesized that three age groups (two
dimensions) would be appropriate. After reviewing
the inflection point of the scree plots and eigenvalues
(variance) produced by the correspondence analysis,
three age groups (two dimensions) were deemed
appropriate for the analysis (Kassambara, 2017). The
age groups were 20-40, 41-51, and 52-61 for the pilot
study and 19-27, 28-45, and 46-70 for the main study.
Twelve contingency tables were analysed using SCA
(six variables of interest per study). The pilot study
had one participant removed for missing age values;
the main study had two removed. Data analysis was
conducted in R v.3.6.2 using FactoMineR and
factoextra packages (Le et al. 2008; Kassambara &
Mundt, 2020).
3 RESULTS
3.1 Pilot Study Results
The participants in the pilot study agreed that the
shuttle was intelligent (18.3%), safe (17.0%),
trustworthy (15.0%), comfortable (15.0%), and that it
would be used regularly (17.0%). Participants also
rated the shuttle as acceptable at following traffic
rules (12.4%) and avoiding obstacles such as
pedestrians and other vehicles (18.3%). A Chi-Square
test showed a significant association between age and
rating of Perceived Safety. χ
2
(6, N = 47) = 16.20, p =
.013. Everyone responded either “neither agree nor
disagree” or higher to the statement “The Vehicle is
Safe.” Those in the youngest age group (20-40)
responded “strongly agree” more than those in the 41-
51 and 52-61 age groups.
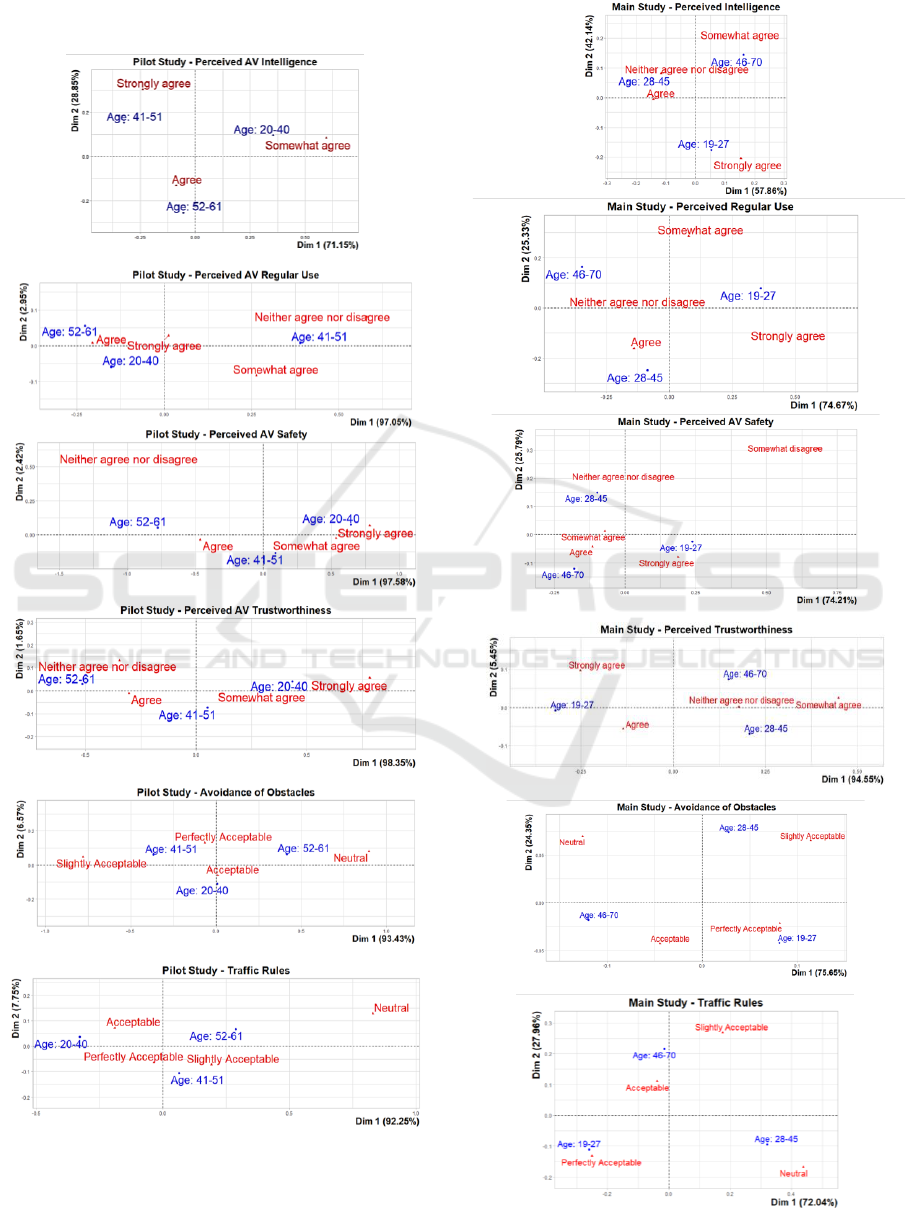
Results from the SCA indicated that, overall,
participants in the pilot study had a favourable view
of the AS service and technology. In five out of the
six variables of interest, participants reported
acceptability of at least neutral or higher. The SCA
plots are presented in the Appendix. SCA indicates
which groups have similar frequency counts (red for
the survey response and blue for age groups) and
therefore describes general grouping patterns
(Kassambara, 2017). Percent of variance explained
by the dimensions is presented in Table 1. Of note,
two outliers were found in the Avoidance of
Obstacles variable (slightly unacceptable, n = 44) as
well as one outlier in the Perceived Safety variable
(neither agree nor disagree, n = 45).
When looking at the Perceived Intelligence plot,
it was interesting to note that both older age groups
clustered closely around “strongly agree” and
“agree,” respectively. However, for the Regular Use
of Shuttle variable, both 20-40 and 52-61 age groups
were grouped around “agree” indicating similar
frequency responses. The youngest age group
responded the most frequently with “strongly agree”
to the Perceived Safety variable. For Perceived
Trustworthiness, individuals aged 52-61 had similar
response frequencies with “neither agree nor
disagree” as well as “agree” while individuals 41-51
grouped more closely with “somewhat agree.”
Avoidance of Obstacles showed that the youngest age
group (20-40) mostly reported “acceptable.” For the
Obedience of Traffic Rules variable, individuals aged
41-51 were grouped with “slightly acceptable” and
“perfectly acceptable” while those aged 20-40
grouped closer to “acceptable.”
Table 1: Variance (%) Explained by Dimension 1 and 2 –
Pilot Study.
Variable
Variance in
Dimension 1
Variance in
Dimension 2
Perceived
Intelligence
71.15
28.85
Regular use of
Shuttle
97.05
2.95
Perceived
Safety
97.58
2.42
Perceived
Trustworthiness
98.35
1.65
Avoidance of
Obstacles
89.53
10.47
Obedience of
Traffic Rules
92.25
7.75
3.2 Main Study Results
The passengers in the main study reported that the
most common reason for riding was curiosity, at
29.5%. The next most reported reason was for
research (25.7%), followed by convenience (8.6%).
Only two participants were interested in accessibility
(1.9%) and 13 participants listed multiple reasons for
riding the shuttle.
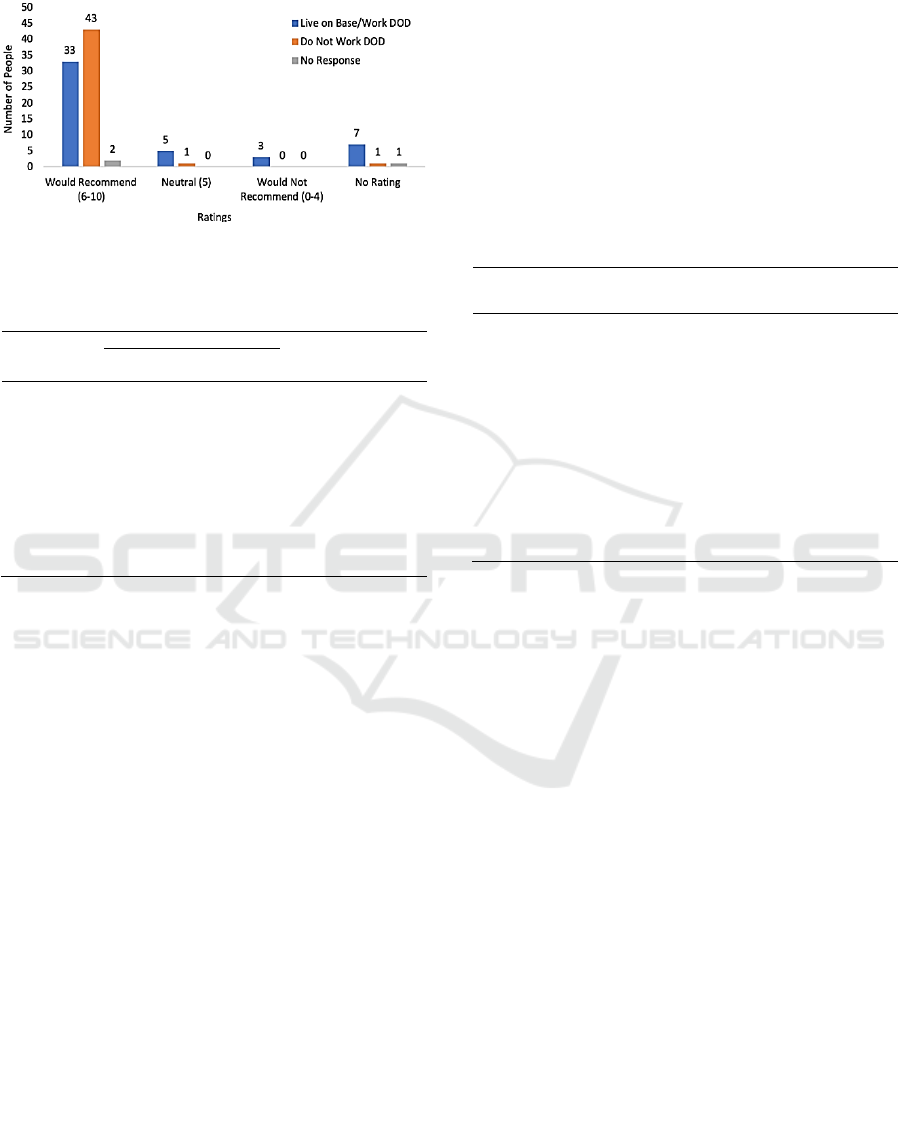
Participants who worked for the DoD rated the AS
negatively more often than their counterparts for the
perceived value to the base (U = 673.00, p = .024).
Those who did not work for the DoD stated that they
would be more likely to recommend the AS to a friend
(U = 469.00, p < .001) (Figure 1). When comparing
riders to non-riders, riders rated the AS favourably
more often on many variables including Perceived
Safety, Perceived Trustworthiness, and the value of
the shuttle to the base (Table 2).
A Chi-Square Test showed no significant
association between the typical method of
User Experience and Analysis of an Autonomous Shuttle Service
373
transportation around the base and DoD employment,
χ
2
(4, N = 77) = 4.16, p = 0.38.
Figure 1: Distribution of Recommendation Ratings Across
DoD and non-DoD Participants.
Table 2: Riders vs Non-Rider Ratings of AS – Main Study.
Riders
Non-Riders
U
z
p
Mean
Rank
n
Mean
Rank
n
Recommend to
Others
52.47
64
20.43
23
194.00
-
5.40
0.000
Perceived Value
on Base
49.54
61
33.11
27
516.00
-
2.91
0.004
Perceived
Intelligence
56.18
67
35.06
31
591.00
-
3.61
0.000
Perceived
Safety
57.45
67
32.32
31
506.00
-
4.30
0.000
Perceived
Trustworthiness
56.47
67
34.44
31
571.50
-
3.75
0.000
Avoidance of
Obstacles
53.50
67
40.85
31
770.50
-
2.13
0.033
Obedience of
Traffic Rules
53.80
67
40.21
31
750.00
-
2.33
0.020
Results from the SCA indicated that participants
in the main study had a favourable view of the AS
service and technology. The SCA plots are presented
in the Appendix. Of note, after examining the SCA
plot for the Avoidance of Obstacles variable, four
outliers from ratings of “slightly unacceptable” and
“unacceptable” were detected and removed, leaving n
= 92 for the analysis. The SCA plot for Perceived
Trustworthiness had one outlier removed from ratings
of “somewhat disagree,” leaving n = 95 for the
analysis. Similarly, the Perceived Safety plot revealed
one outlier from ratings of “strongly disagree,”
leaving n = 95 for the analysis. Percent of variance
explained by the dimensions is presented in Table 3.
For the Perceived Intelligence variable, the
youngest group (19-27) was more highly associated
with the highest level of agreement (“strongly
agree”), while the older group (46-70) was more
closely associated with a weaker positive response
(“somewhat agree”). The middle age group 28-45
was associated with “agree” and “neither agree nor
disagree.” The closest association for the Regular Use
of Shuttle variable was with individuals in the middle
age group (28-45) who most frequently responded
“agree.” Other responses did not have close
groupings. The Perceived Safety variable showed that
individuals in the youngest age group (19-27)
frequently strongly agreed that the shuttle was safe
while participants in the middle age group (28-45)
were neutral in opinion. The Perceived
Trustworthiness variable did not have any patterns of
note. The Avoidance of Obstacles variable showed an
association between the 19-27 group with “strongly
agree.” Finally, for the Obedience of Traffic Rules
variable, the closest frequency count was with
individuals in the youngest group (19-27) finding the
service “perfectly acceptable.”
Table 3: Variance (%) Explained by Dimension 1 and 2 –
Main Study.
Variable
Variance in
Dimension 1
Variance in
Dimension 2
Perceived
Intelligence
57.86
42.12
Regular use of
Shuttle
74.66
25.33
Perceived Safety
71.30
28,70
Perceived
Trustworthiness
95.60
4.40
Avoidance of
Obstacles
77.69
22.32
Obedience of
Traffic Rules
72.04
27.96
4 DISCUSSION
The aim of this study was to explore rider and non-
rider perceptions of an AS service and technology,
along with their likelihood of recommending it to
future users. Those who chose to ride in the AS were
more likely to rate the shuttle positively and more
likely to recommend the service to a friend or
colleague. However, employees of the DoD were not
as likely to recommend the AS when compared to
non-DoD employees.
The open-ended feedback helped to identify some
of the issues these participants felt about the AS. The
first issue was related to the pre-defined route the AS
had to follow, and many participants expressed a
desire to see changes to the defined route with
comments such as “More stops… maybe faster,”
“More hours,” and “Better routes needed.” There
were also requests for specific changes to the route
such as, “Stop closer to Hatfield Gate. In January,
February, and March we have workshops at Brucker
Hall and a shuttle between Hatfield Gate and Brucker
would be very useful.” This issue was also found in a
similar AV study involving a shuttle on a set route
(Eden et al., 2017). Second, participants made
VEHITS 2021 - 7th International Conference on Vehicle Technology and Intelligent Transport Systems
374

comments about the ride not being as smooth as they
would like with sudden jerky acceleration and
breaking, which Eden et al. (2017) also found was an
issue for riders. One participant stated, “I sat in the
back seat which made me nauseated with the jerky
and fast stops and starts. I had to move to a side seat
and sit with my legs toward the front to support me. I
would not ride it again til that was fixed.” Third, some
riders desired more clear communication regarding
which stop the shuttle was at, along with information
about unexpected situations such as stopping for a
parked vehicle. This is backed up by the finding that
an AV with an interface that communicates with
passengers is found to be more trustworthy (Ruijten
et al., 2018). Lastly, some participants were not fond
of the size or arrangement of seating in the AS. Some
passengers commented that they felt the seats were
uncomfortable or should be larger. Additionally, all
seats were placed along three sides of the shuttle and
face inward, which forced participants to look
towards each other or the door if they did not wish to
interact with other riders. One participant remarked
on the need for both, simply stating “larger, front
facing seating.” Research conducted by Ong et al.
(2019) in which typically shared transportation
methods were partitioned off for privacy garnered
similar feedback from participants who enjoyed the
idea of avoiding interaction with a stranger during
their ride.
The trends seen in the SCA plots suggest that the
younger age group (e.g., ages 19-27 in the main
study) usually reported higher levels of agreement
and acceptance on the surveys. This was very
prevalent when examining topics such as Perceived
Safety and Avoidance of Obstacles. These findings
were also seen in the results of the Chi-Square test in
the pilot study that examined the association between
vehicle safety and age, where the youngest group of
participants were more likely to rate the AS as safe.
However, in the main study, this trend was contrasted
by the next age group (28-45), who reported neutral
responses to Perceived Safety. It is surprising that this
age group was the most associated with agreement
that the AS service would see regular use despite
generally not viewing it as particularly safe. More
research should be conducted to further examine the
perceptions from different age groups, in particular,
the middle age group, to determine the motivations
they may have about AS usage despite holding a
lower view of its safety.
One of the limitations of this study was the use of
a military base as the testing ground for the shuttle.
While civilians were permitted onto the base to ride
the AS, it is unlikely that this would be common
knowledge for some people. Much of the sample
consisted of DoD employees, where ideally the
sample would have been more diverse. The sample
may have also been impacted by the pilot phase of the
study, in which one could only ride the AS by
invitation. Without an invitation, potential users
might have been turned away during this portion of
data collection and might not have returned during the
main study phase, although the research team
encouraged some DoD employees to try out the
service.
There was also a concern that participant answers
were potentially influenced by the safety operators
who were present during the AS rides. These
operators were employees of the AS company and
were trained to give a more interactive experience in
which they gave a short presentation about the shuttle
and participants could ask questions. It has been
found that the presence of an employee onboard can
influence overall willingness to ride for participants
(Dong et al., 2019). The personable nature of the
operators may have also softened criticism of the
shuttle that some participants may have reported if
they were to ride it without an operator present.
The survey itself also faced some limitations.
Some participants had trouble receiving the email for
completing the survey on-line. As it was not asked
that they take it immediately, like the paper survey,
and some participants did not complete it. The on-line
survey also did not allow participants to revisit a
question after it was answered. After the initial pilot
phase, the wording for the question regarding comfort
was altered. The initial survey used during the pilot
study was also missing several questions that the later
version in the main study covered.
Overall, this research suggests that those who
experience an AS may hold a more positive outlook
on the future of the technology. Addressing the
negative feedback and desires of users will be
beneficial in creating a positive AS experience and
promoting the technology.
ACKNOWLEDGEMENTS
The order of the authorship is alphabetized by last
names. Each author contributed to the project: Yi-
Ching Lee: Conceptualization and Supervision;
Lindsey Malcein, Kyle Hickerson, Allegra Ayala:
Formal analysis; Kyle Hickerson, Allegra Ayala,
Lindsey Malcein: Visualization; Allegra Ayala,
Lindsey Malcein, Kyle Hickerson: Writing - original
draft; All authors: Writing - review & editing. We
would also like to acknowledge the efforts from Dr.
User Experience and Analysis of an Autonomous Shuttle Service
375

Lance Larkin, John Cliburn, and GJ Cedric Portea
who participated in project discussions during the
early phase of this research.
REFERENCES
Alkan, M. A. (2017). Sürücüsüz (Otonom) Araçlar. http://
www.endustri40.com/surucusuz-otonom-araclar/
Allen, J. P., Myers, N. R., Carlson, T. A., Stinson, J. T.,
Liesen, R. J., Larkin, L. L., and Davila-Perez, J. L.
(2020). Autonomous Vehicle Pilot at Joint Base Myer-
Henderson Hall: Project Summary, Impact, and
Recommendations from Phase I. Champaign, Illinois:
Engineer Research and Development Center.
Bendixen, M. (2003). A Practical Guide to the Use of
Correspondence Aanlysis in Marketing Research.
Marketing Bulletin, 14. http://marketing-bulletin.
massey.ac.nz/V14/MB_V14_T2_Bendixen.pdf.
Bertoncello, M & Wee, D. (2015). Ten ways autonomous
driving could redefine the automotive world. McKinsey
& Company. https://www.mckinsey.com/industries/
automotive-and-assembly/our-insights/ten-ways-auto
nomous-driving-could-redefine-the-automotive-world.
Bissell, D. (2010). Passenger mobilities: affective
atmospheres and the sociality of public transport.
Environment and Planning D: Society and Space, 28,
270-289. doi: 10.1068/d3909.
Chowdhury, H. (2018, August 28). Driverless taxi carries
passengers across Tokyo in "world's first" trial. The
Telegraph.https://www.telegraph.co.uk/technology/20
18/08/28/driverless-taxi-carries-passengers-across-tok
yo-worlds-first/
Clausen, S.-E. (1998). Applied Correspondence Analysis
An Introduction (1st ed.). Sage Publications, Inc.
Dong, X., DiScenna, M., & Guerra, E. (2019). Transit user
perceptions of driverless buses. Transportation, 46(1),
35–50. https://doi.org/10.1007/s11116-017-9786-y.
Eden, G., Nanchen, B., Ramseyer, R., & Evéquoz, F. (2017,
September 25). Expectation and Experience:
Passenger Acceptance of Autonomous Public Trans-
portation Vehicles. https://doi.org/10.1007/978-3-319-
68059-0_30.
Kassambara, A. (2017). Practical Guide To Principal
Component Methods in R.
Kassambara, A., & Mundt, F., (2020). Factoextra: Extract
and Visualize the Results of Multivariate Data Analyses.
https://CRAN.R-project.org/package=factoextra.
Kolodge K., Cicotte, S., & Peng, H., (2020). Mcity
Driverless Shuttle: What We Learned About Consumer
Acceptance of Automated Vehicles.
Le, S., Josse., J., Husson, F. (2008). FactoMineR: An R
Package for Multivariate Analysis. Journal of
Statistical Software, 25, 1-18. https://doi.org/10.18637/
jss.v025.i01.
Lombardi, D. B. & Ciceri, M. R. (2019). Dealing With
Feeling Crowded on Public Transport: The Potential
Role of Design. Environment and Behavior, 1-40. doi:
10.1177/0013916519879773.
Ong, A., Troncoso, J., Yeung, A., Kim, E., & Agogino, A.
(2019). Towards flexible ride sharing experience:
human-centered design of segmented shared spaces.
HCI International. https://link.springer.com/chapter/
10.1007%2F978-3-030-23525-3_50.
Ruijten, P. A. M, Terken, J. M. B, Chandramouli, S. N.
(2018) Enhancing Trust in Autonomous Vehicles
through Intelligent User Interfaces That Mimic Human
Behavior. Multimodal Technologies and Interaction,
2(62) https://doi.org/10.3390/mti2040062.
SAE International. (2018). SAE J3016 Taxonomy and
Definitions for Terms Related to Driving Automation
Systems for On-Road Motor Vehicles. https://www.
sae.org/news/2019/01/sae-updates-j3016-automated-dr
iving-graphic.
Singh, S. Critical Reasons for Crashes Investigated in the
National Motor Vehicle Crash Causation Survey;
Technical.
Report; National Highway Traffic Safety Administration:
Washington, WA, USA, 2015.
Thomas, J. A. P. K. (2009). The Social Environment of
Public Transport [Unpublished doctoral thesis].
Victoria University of Wellington.
Wagner, P., Richter, F.: Infographic: ride-hailing apps
surpass regular taxis in NYC, April 2018.
Wang, H., Tota, A., Aksun-Guvenc, B., & Guvenc, L.
(2018). Real time implementation of socially
acceptable collision avoidance of a low speed
autonomous shuttle using the elastic band method.
Mechatronics, 50, 341–355. https://doi.org/10.1016/j.
mechatronics.2017.11.009.
VEHITS 2021 - 7th International Conference on Vehicle Technology and Intelligent Transport Systems
376
APPENDIX
Pilot Study
Main Study
User Experience and Analysis of an Autonomous Shuttle Service
377
