
Contactless Optical Respiration Rate Measurement for a Fast Triage of
SARS-CoV-2 Patients in Hospitals
Carolin Wuerich
a
, Felix Wichum
b
, Christian Wiede
c
and Anton Grabmaier
d
Fraunhofer IMS, Finkenstrasse 61, Duisburg, Germany
Keywords:
Respiration Rate, Image Processing, Remote Measuring, SARS-CoV-2 Triage, Feature Tracking.
Abstract:
Especially in hospital entrances, it is important to spatially separate potentially SARS-CoV-2 infected patients
from other people to avoid further spreading of the disease. Whereas the evaluation of conventional laboratory
tests takes too long, the main symptoms, fever and shortness of breath, can indicate the presence of a SARS-
CoV-2 infection and can thus be considered for triage. Fever can be measured contactlessly using an infrared
sensor, but there are currently no systems for measuring the respiration rate in a similarly fast and contactless
way. Therefore, we propose an RGB-camera-based method to remotely determine the respiration rate for the
triage in hospitals. We detect and track image features on the thorax, band-pass filter the trajectories and
further reduce noise and artefacts by applying a principal component analysis. Finally, the respiration rate
is computed using Welch’s power spectral density estimate. Our contactless approach is focused on a fast
measurement and computation. It is especially adapted to the use case of the triage in hospitals by comprising
a face detection which is robust against partial occlusion allowing the patients to wear face masks. Moreover,
we show that our method is able to correctly determine the respiration frequency for standing patients despite
considerable body sway.
1 INTRODUCTION
The entire world is currently experiencing an un-
precedented pandemic with COVID-19. As more
and more people become infected with SARS-CoV-
2, hospital capacities are also becoming scarcer. It
is important to effectively protect patients, medical
staff and visitors from potentially SARS-CoV-2 in-
fected patients. Hereby, the most efficient solution
is a spatial separation. However, for the separa-
tion, potentially infected patients need to be identified
quickly, and conventional laboratory tests based on
polymerase chain reaction (PCR), antibodies or anti-
gens take too long to evaluate. In addition, if there
is a high incidence of infection, not everyone can be
tested due to limited laboratory capacity.
Since laboratory diagnoses are not possible or
practically feasible, a focus on the symptoms of
SARS-CoV-2 is necessary. The two most com-
mon symptoms are fever and accelerated breathing.
a
https://orcid.org/0000-0003-0917-2696
b
https://orcid.org/0000-0002-3586-2802
c
https://orcid.org/0000-0002-2511-4659
d
https://orcid.org/0000-0002-4882-4223
Whereas the first one can be measured quickly and
contactlessly with the help of a thermal imaging cam-
era, there is no contactless measuring system for de-
termining the respiration rate which can take mea-
surements quickly and in an uncomplicated way.
In order to provide a solution, we propose an op-
tical measuring system which can automatically de-
termine the respiration rate. Such measuring systems
have already been used in the field of Ambient As-
sisted Living (Wiede et al., 2019). The principle is
based on tracking the optical flow of suitable features
on the thorax, filtering of the trajectories with band-
pass filters, artefact reduction by principal component
analysis (PCA) and frequency analysis. Since the ap-
plication scenarios differ significantly, it is necessary
to investigate which changes need to be made for the
new field of application. This concerns questions of
save distancing, face detection with masks and body
movement during standing, and affects illumination,
camera attachment and especially the algorithm de-
sign.
The system must enable fast measurements, in or-
der to separate the patients as quickly as possible at
the hospital entrance. A great advantage of the pro-
posed measurement method is that there is no contact
Wuerich, C., Wichum, F., Wiede, C. and Grabmaier, A.
Contactless Optical Respiration Rate Measurement for a Fast Triage of SARS-CoV-2 Patients in Hospitals.
DOI: 10.5220/0010408400290035
In Proceedings of the International Conference on Image Processing and Vision Engineering (IMPROVE 2021), pages 29-35
ISBN: 978-989-758-511-1
Copyright
c
2021 by SCITEPRESS – Science and Technology Publications, Lda. All rights reserved
29

between the patient to be measured and the measure-
ment system, which eliminates the risk of infection
carriers being passed on.
In this paper, we firstly present the state of the
art in remote respiration rate determination in Section
2. In Section 3, we explain the used methods in de-
tail. This is followed by the experiments and results
in Section 4. The discussion is presented in Section
5. We conclude with our findings and the outlook on
future developments in Section 6.
2 STATE OF THE ART
In clinical practice, there are multiple methods to
measure the respiration rate such as nasal thermistors,
pressure transducer, respiratory effort belts or an anal-
ysis of the electrocardiogram (ECG). However, these
devices all require direct contact to the patient. This
increases the risk of contamination of the device and
an infection of the nurse who needs to attach the de-
vices to the patient. As alternative, optical methods
can contribute to the protection of medical staff and
other patients by enabling a safety distance.
Jin Fei and Pavlidis (2010) developed a remote
thermistor by applying a face detection followed by
a nostrils detection on thermal images. Around the
nostrils, wavelets are used to analyse changes in tem-
perature during inhalation and exhalation. Martinez
and Stiefelhagen (2012) use a Kinect camera to track
an infrared pattern projected on the upper body of
sleeping persons. Then, they deploy a Principal Com-
ponent Analysis (PCA) merging the trajectories and
an Auto-regressive (AR) spectral analysis to compute
the respiration frequency. The method by Lim et al.
(2014) uses a Kinect camera as well, but their ap-
proach is based on a moving average filter and a spline
interpolation on the depth points. Ostadabbas et al.
(2015) extended this approach by an automatic selec-
tion of a Region of Interest (ROI) on the chest.
While these approaches are based on the infrared
spectrum, we want to focus on applications of con-
ventional RGB-cameras in the visible light spectrum,
since these cameras are more economically priced
and thus can provide a low-cost system with a higher
availability. Using an RGB-camera, Tan et al. (2010)
observe the chest movement by subtracting two con-
secutive frames and analysing the generated edges.
Bartula et al. (2013) transform the images or selected
ROIs to 1D-vectors and then cross-correlate con-
secutive frames to obtain the motion-based changes.
Reyes et al. (2016) analyse the intensity changes in
the video channels caused by lifting and lowering the
chest during breathing. Massaroni et al. (2018) follow
a similar approach considering the intensity changes
of the video, but they select the ROI at the pit of the
neck.
An alternative approach considers the intensity
changes of the skin to determine the heart rate. From
a modulation of this heart rate signal, the respiration
rate can be derived (Poh et al., 2011; Tarassenko et al.,
2014). Poh et al. (2011) apply an independent compo-
nent analysis (ICA) for the frequency determination,
whereas Tarassenko et al. (2014) use AR models.
Further methods employ feature tracking and op-
tical flow, such as Lukac et al. (2014) who use a KLT
tracker (Tomasi and Kanade, 1991), or Koolen et al.
(2015) who extended this approach by applying a
PCA, an ICA and finally a Short Time Fourier Trans-
form (STFT) to improve signal analysis. Wiede et al.
(2017) apply feature detection and tracking within a
selected ROI, and then use a PCA and FFT to deter-
mine the frequency.
Previous methods are not developed and tested for
the application of epidemic triage in hospitals. We
base our approach on the method by Wiede et al.
(2017) and adapt the algorithm to the triage use case
in hospitals. We reduce the total recording and com-
putation time to avoid accumulations of patients wait-
ing. Further, we improve the face detection by in-
creasing the robustness against occlusion to allow a
respiration rate measurement with face masks. More-
over, patients should touch as few objects and sur-
faces as possible making a respiration measurement
while standing desirable. Therefore, we show, that
our improved method is able to determine the respi-
ration rate correctly despite the body’s sway during
standing.
3 METHOD
3.1 System Overview
The proposed system allows the contactless measure-
ment of the respiration rate. For this purpose, an
RGB-camera is located 1.5 m away from the subject.
The use of the system in an application-like environ-
ment is shown in Figure 1.
In the following we use the term real-time respira-
tion rate (RTRR) to describe our proposed method. In
parallel to the image acquisition by an RGB-camera,
the face or alternatively the upper body of the patient
is detected in the video. Based on these results, the
ROI is placed on the chest and the area is further di-
vided into four subregions. Prominent features are
found and tracked over time. Hereby, the motion in
y-direction corresponds to the breathing movement.
IMPROVE 2021 - International Conference on Image Processing and Vision Engineering
30
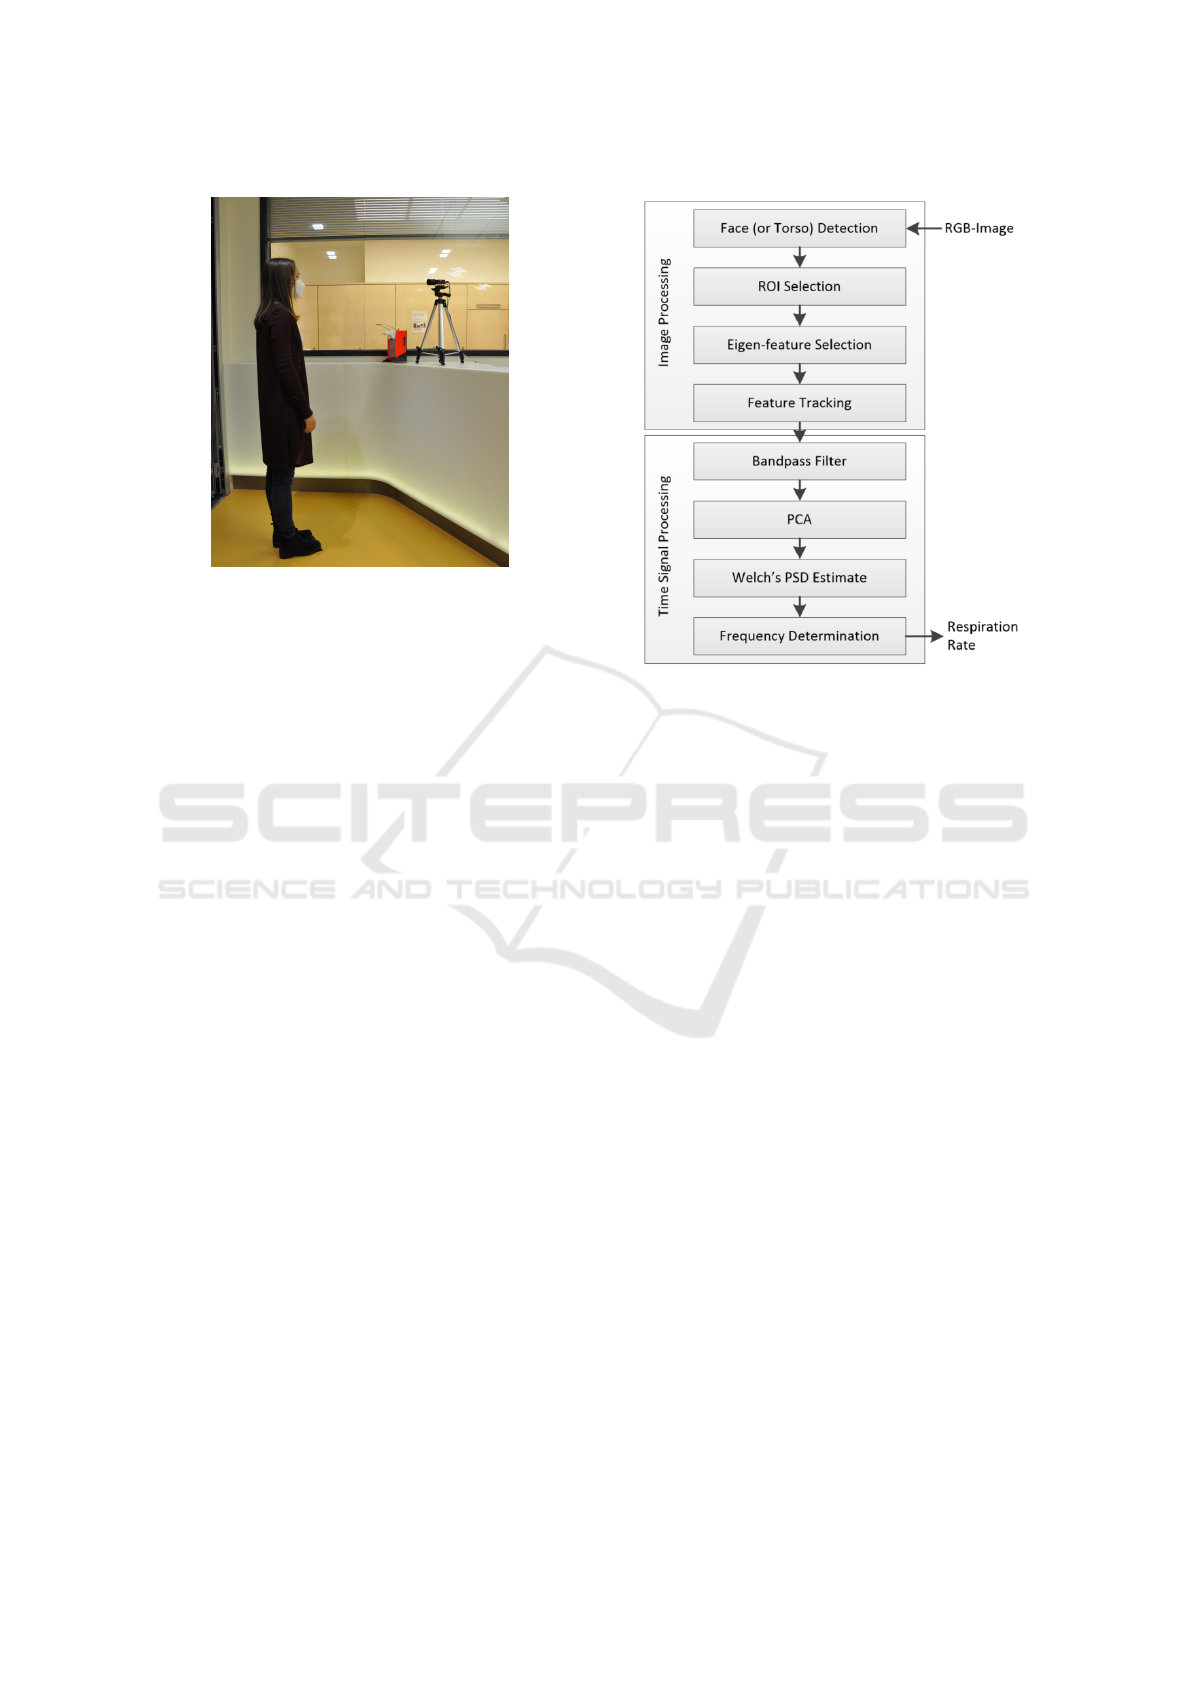
Figure 1: The proposed system for contactlessly measur-
ing the respiratory rate in a hospital-like environment. The
camera can be located 1.5 m away from the subject and the
evaluation can be done in a safe distance or behind a glass
panel by medical personnel.
This is followed by a PCA and bandpass filtering for
the removal of artefacts and noise. The respiratory
rate is determined by the highest spectral density of
the principal components. The average respiratory
rate is determined over 30 s time intervals. Figure
2 shows the different steps of the proposed method.
3.2 ROI Selection and Feature Tracking
To determine the respiration rate, the proposed ap-
proach observes the lifting and lowering movements
of the torso. For this, an ROI on the chest is to be
selected. Since the upper body detection is less ac-
curate, we first employ a face detection algorithm to
estimate the ROI based on the relative position and
size of the bounding box of the face. Only if the face
is not visible, the upper body detection is applied.
First, we apply the Histogram of oriented Gradi-
ents (HoG) method (Dalal and Triggs, 2005) for face
detection. The employed model is built of five HoG
filters for different angles of the face. It is a rather
light-weight model and works well for frontal faces
and faces under partial occlusion. Latter is impor-
tant for our application since the patients might be
wearing masks. If this method does not find a face
in the image, a Viola-Jones face detector (Viola and
Jones, 2004) is applied as alternative. Based on this,
the ROI is placed centrally below the bounding box
shifted and sized relatively to the bounding box of the
face. This way, we ensure the right size of the ROI
independently of the patient’s size or distance to the
camera. The factors for determining the relative po-
Figure 2: Overview of the proposed method for contactless
real-time measurement of the respiration rate. The image
processing includes the ROI selection and feature tracking,
and is followed by the time signal processing with the signal
extraction and frequency analysis.
sition of the ROI (see Equation 1a to 2d) were found
empirically. The ROI is defined by the position of the
upper left corner (x
ROI
, y
ROI
) and its width w
ROI
and
height h
ROI
. Equivalently, the bounding box is defined
by the position of the upper left corner (x
f ace
, y
f ace
)
and its width w
f ace
and height h
f ace
.
x
ROI
= x
f ace
− (0.7 · w
f ace
) (1a)
y
ROI
= y
f ace
− (1.4 · h
f ace
) (1b)
h
ROI
= 0.7 · h
f ace
(1c)
w
ROI
= 1.4 · w
f ace
(1d)
If non of the face detection algorithms was suc-
cessful, an upper body Viola-Jones detector is de-
ployed. The ROI is then to be selected relatively to
the bounding box of the torso, which is defined by the
position of the upper left corner (x
torso
, y
torso
) and its
width w
torso
and height h
torso
.
x
ROI
= x
torso
+ (0.32 · w
torso
) (2a)
y
ROI
= y
torso
− (0.16 · h
torso
) (2b)
h
ROI
= 0.2 · h
torso
(2c)
w
ROI
= 0.36 · w
torso
(2d)
After computing the position of the ROI, it is split
equally into four subregions in order to improve the
Contactless Optical Respiration Rate Measurement for a Fast Triage of SARS-CoV-2 Patients in Hospitals
31
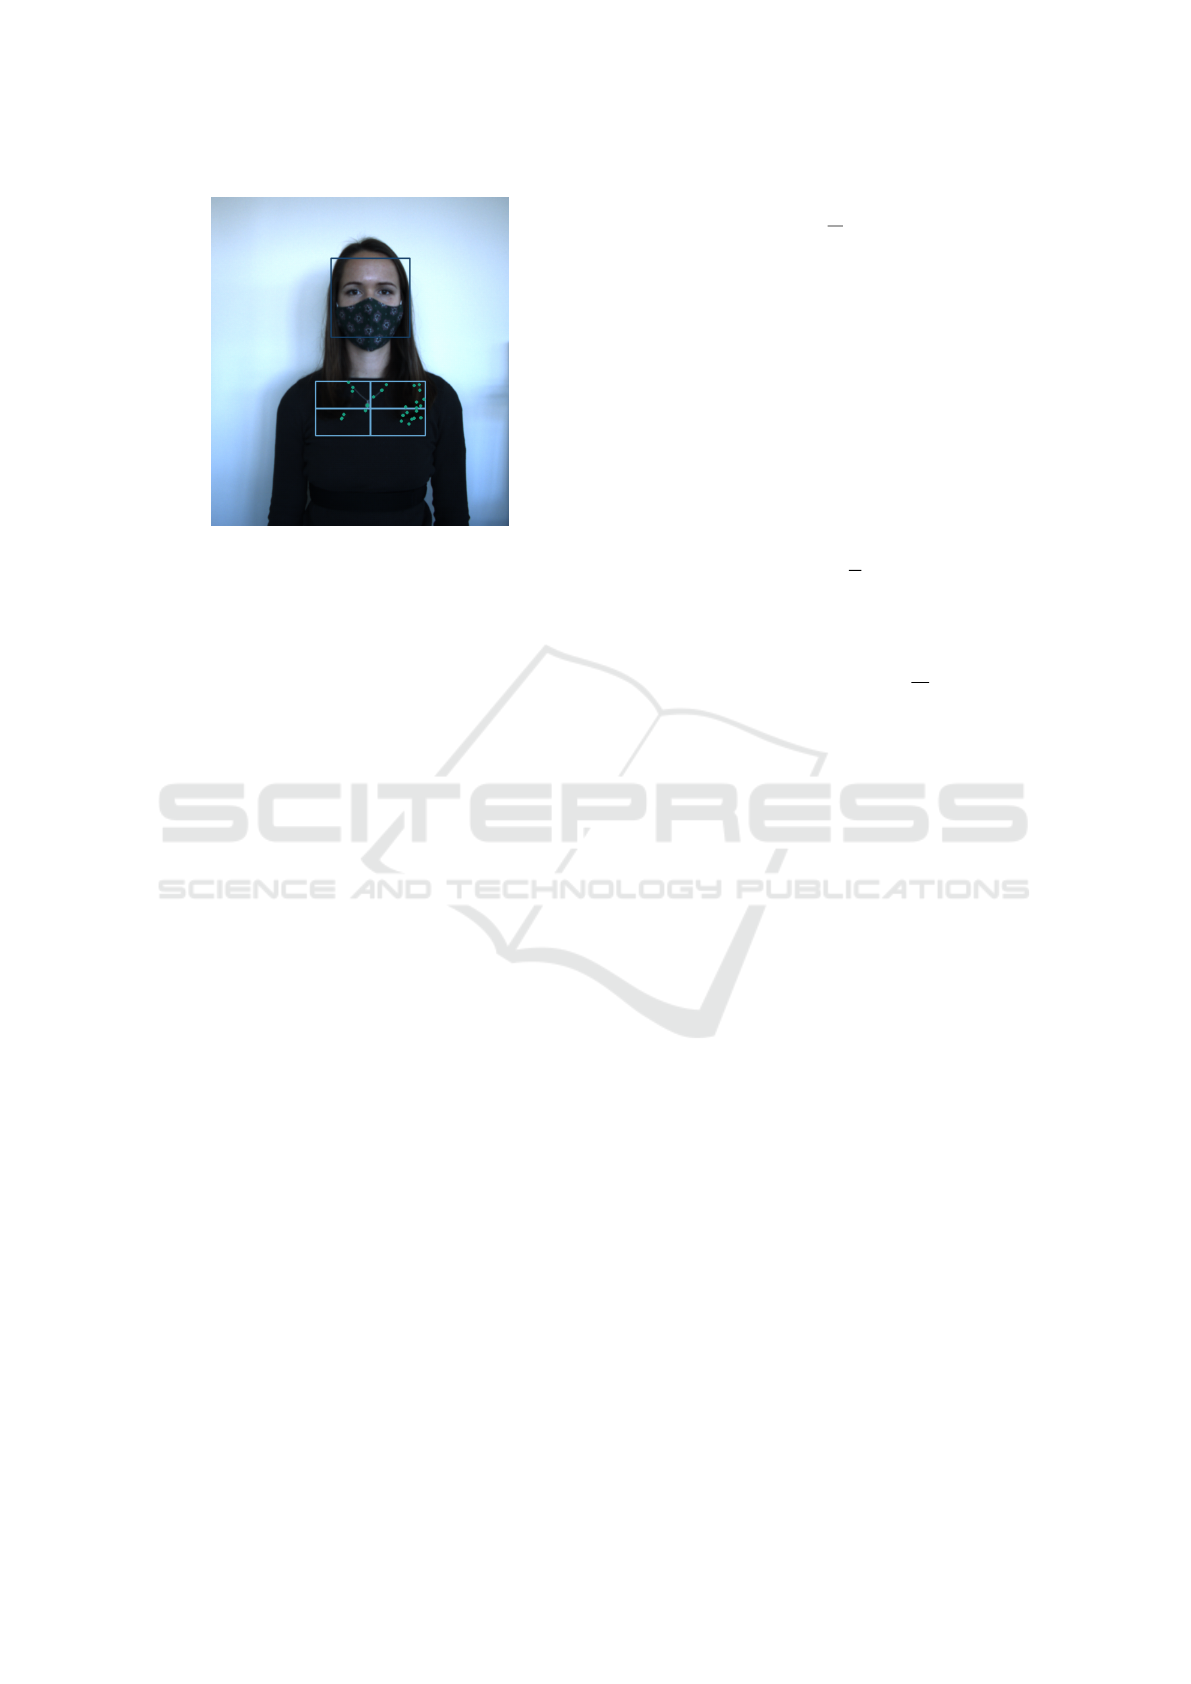
Figure 3: The face is detected to set the position of the
ROI relatively to the position and size of the face in the im-
age. Subsequently the ROI is divided into four subregions
in which the strongest features are identified and tracked.
robustness of the following signal processing. Within
each of these four subregions, we identify 15 unique
image features to be tracked subsequently. For this
purpose, we select the 15 strongest minimum Eigen-
value features according to the Shi-Tomasi feature de-
tection (Shi and Tomasi, 1993). Figure 3 shows a sin-
gle frame with the bounding box around the detected
face, the partitioned ROI and its selected features.
To observe the movement of the torso, the KLT
tracker by Tomasi and Kanade (1991) is applied to the
previously selected features. According to the bright-
ness assumption, the intensity of a pixel remains
constant for small movements and a short time pe-
riod. However, to enable tracking in two-dimensional
space, Tomasi and Kanade (1991) suggested to con-
sider the neighbouring pixels as well, resulting in a
3x3 patch to be tracked.
3.3 Time Signal Processing
In the further processing, only the y-direction of
the tracked features are considered, since this corre-
sponds to the main direction of the chest movement
during breathing. For each of the subregions, the y-
directories of the tracked feature points are averaged
and the mean y-displacement Y
avg
of all features is
considered to represent the overall movement of the
subregion, resulting in four time signals, see Equa-
tion 3. The indices i refer to the four regions with n
i
tracked feature points. If in any subregion all features
are lost during tracking or no features were found at
all, its final signal is replaced by the signal of the sub-
region with the most features in the end.
Y
i
avg
(t) =
1
n
i
n
i
∑
j=1
y
i
j
(t) (3)
Subsequently, a bandpass BP filter is applied to
exclude frequencies not in the range of the physio-
logical human respiration rate, see Equation 4. In or-
der to guarantee a linear phase response and therefore
a constant group delay, an FIR filter with 128 filter
coefficients was chosen. The cutoff frequencies al-
low frequencies between 0.125 Hz (7.5 bpm) and 0.7
Hz (42 bpm) to pass, where bpm denotes breaths per
minute. This bandwidth complies with the physiolog-
ical human respiration rate.
Y
i
BP
(t) = Y
i
avg
(t) ∗ BP(t) (4)
In the next step the signal is mean-centred, see
Equation 5. In this context Y stands for the tempo-
ral average of Y
i
avg
. Afterwards the PCA is applied.
By splitting the signal in its principal components PC,
artefacts and noise are further reduced.
Y
i
centered
(t) = Y
i
BP
(t) −Y
i
(5)
For the final frequency determination, the spectral
estimator described by Welch (1967) is employed us-
ing a sliding window of 30 seconds. It is applied to
each of the principal components, and finally, for the
determination of the respiration, the principal compo-
nent exhibiting the highest overall spectral density is
chosen. The respiration rate is calculated according
to Equation 6.
f
respiration
= max(|Welch(PC)|) (6)
The conversion of the respiratory frequency into the
unit bpm is done by a final multiplication with the
factor 60.
4 EXPERIMENTS AND RESULTS
4.1 Experimental Setup
The validation of the approach is divided into two
parts. The first set of experiments aims at testing
the general functionality of the implemented method,
whereas the second set of experiments focuses on the
applicability for the triage use case in particular.
In a first experiment, we recorded a total of 24
videos of eight different persons. The videos to be
analysed are captured by an Allied Manta G-201-
RGB-camera at a fixed frame rate of 10 fps and have
a resolution of 1624 x 1234 pixels. Each video has
IMPROVE 2021 - International Conference on Image Processing and Vision Engineering
32

a duration of 30 seconds, which is the total record-
ing time needed for the calculation of the respira-
tion rate by the algorithm. During this time the sub-
jects were sitting in a chair facing the camera and
were instructed not to talk. The experiments in-
cluded three female and five male subjects between
the age of 22 and 28, where each of the subjects was
recorded three times at different respiration rates. The
clothes of the subjects include plain as well as pat-
terned/textured shirts. This also includes very dark
and bright colours, which might be more challeng-
ing for the image processing algorithms. Light con-
ditions, exposure time and white balancing were not
changed during the experiments. Our method is im-
plemented on a NUC8i5BEK with an Intel
R
Core
TM
i5 processor (8
th
Gen).
Simultaneously to the recording of the video, we
measured the respiration with a reference system to
obtain ground truth data for validation. The reference
system consisted of a NeXus-10 MKII device with
the corresponding chest strap and the software Bio
Trace+ (V 2017 A). The resolution of the measured
respiration rate values is 0.1 bpm.
In a second experiment, we tested the validity of
the approach for the triage use case. Since the pa-
tients should touch as few objects and surfaces as pos-
sible, a respiration measurement while standing is de-
sirable. Further, the face detection algorithm has to
prove to be robust against occlusion due to masks.
We included these two challenges in the second set of
tests by recording the subjects with masks and while
standing. Again, we took three videos and reference
measurements for each of the eight subjects with the
same technical settings as before.
4.2 Results
The presented optical method rounds the measure-
ment results to whole numbers, while the data from
the reference system is rounded to one decimal place.
The recorded respiration rates range from 7.3 bpm to
37.0 bpm. The maximum absolute error is 3.2 bpm,
while the root mean squared error (RMSE) is 1.4 bpm
and thus within the self requested level of 3 bpm. For
the data with face mask and standing the RMSE is
1.3 bpm and without mask 1.5 bpm respectively. The
absolute errors of each individual measurement are
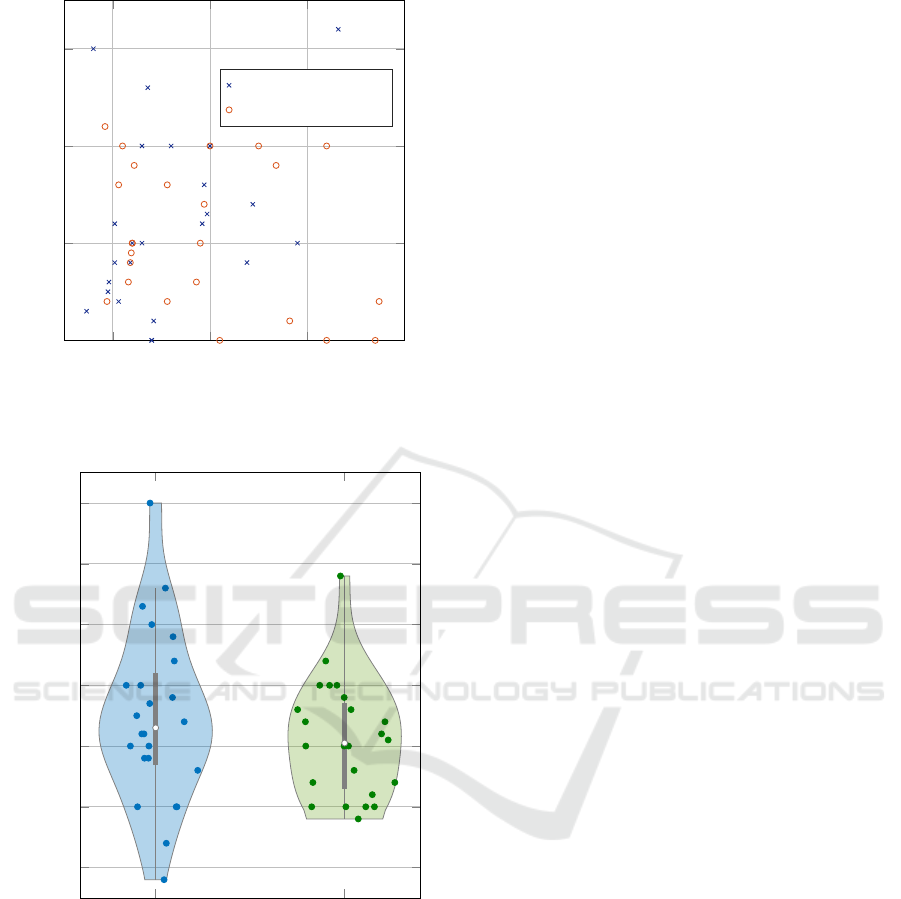
shown in Table 1. Figure 4 shows the error for each
target value. The two largest errors are located at the
outer edges of the measuring rate. Only with subject
3 measurement 3 the error exceeds the value of 3.0
bpm. Most absolute errors are even below 2.0 bpm
and a large proportion fall below an absolute error of
1.0 bpm.
Figure 5 shows the distribution of errors. There is
only one peak in the error probability function at -0.7
bmp . Starting from this point, the probability of error
occurrence decreases continuously in both directions
symmetrically. The measurements with face mask
and standing lie within the other results and show a
smaller spread.
A complete measurement takes 32.83 s on aver-
age in the C++ implementation. Thereof, 30 seconds
are required for the video recording (and parallel im-
age processing) and 2.83 s for the actual time signal
processing.
5 DISCUSSION
As shown in the previous section, the RMSE on our
data sets is at 1.5 bpm for sitting subjects without
mask and 1.3 bpm for standing subjects with mask.
Under the assumption that a healthy person has a res-
Table 1: Measurement results for sixteen subjects with three
measurements each. The first eight subjects were sitting and
did not wear any face masks. The subjects nine to sixteen
were standing and did wear a face mask. The values of
the Nexus system (reference) and the RTRR approach are
shown.
Subject Reference [bpm] RTRR [bpm]
#1 #2 #3 #1 #2 #3
1 7.3 8.0 14.0 7 11 14
2 13.0 12.0 19.7 14 11 21
3 16.0 19.2 33.2 14 18 30
4 10.2 13.6 23.8 9 11 23
5 10.2 9.6 11.8 11 9 11
6 20.0 19.4 24.4 18 21 23
7 9.5 14.2 29.0 9 14 28
8 13.0 10.6 14.0 11 11 14
9 18.6 15.6 20.0 18 14 18
10 11.9 19.4 19.0 11 18 18
11 21.0 32.0 32.0 21 32 30
12 11.8 26.8 37.0 11 25 37
13 12.0 12.2 25.0 11 14 23
14 15.6 9.2 28.2 16 7 28
15 10.6 12.0 11.6 9 11 11
16 9.4 11.0 37.4 9 9 37
Contactless Optical Respiration Rate Measurement for a Fast Triage of SARS-CoV-2 Patients in Hospitals
33
10 20 30 40
0
1
2
3
Reference value [bpm]
Absolute measurement error [bpm]
without face mask
with face mask
Figure 4: Occurred absolute errors for our proposed RTRR
method in relation to the reference system.
Without face mask With face mask
−3
−2
−1
0
1
2
3
Measurement error [bpm]
Figure 5: Distribution of measurement errors.
piration rate between 10 and 15 bpm, the relative er-
ror would be 9 % to 14 %. This is acceptable for the
use case of the triage. It does not matter whether the
respiration rate is at 10 or 11 bpm respectively but
it should be distinguished between normal respiration
and an abnormal high respiration rate above 20 bpm.
This requirements can be met.
The reasons for the deviations are manifold. On
the one hand, it must be noted that the lighting con-
ditions were not always ideal. This results in partly
very dark or overexposed images, which do not allow
robust tracking of the features. As a solution in the
future, an ROI specific brightness control has to be
designed. It is also evident that the images of sitting
persons have a 0.2 bpm higher RMSE. This can be
explained by the fact, that the breathing patterns are
better visible while standing. In two of the tests with
masks, the subjects’ faces were not detected at first.
After around 10 seconds, the faces were finally recog-
nised and the respiration rate could still be determined
without problems. The difficulties in face detection
can be attributed to significant occlusion because of
the mask. The effect is intensified if subjects wear
glasses that reflect in the image, have bangs or poten-
tial additional face coverings. In these cases the face
is not sufficiently visible for robust recognition. A so-
lution could be provided by specially trained face de-
tectors or by asking the subjects to e.g. take off their
glasses. On the other hand, we showed that the im-
plemented method is robust against body sway during
standing. Although this movement often is stronger
than the breathing movement of the upper body, it is
not as constant in frequency. Therefore, Welch’s spec-
tral density estimation can effectively eliminate those
artefacts.
We are fully aware that the data set is rather small
for an extensive overview. Especially, the involve-
ment of different user groups of different age and pre-
existing conditions justify a following clinical study.
This clinical study will be carried out in the Univer-
sity Hospital Essen. Nevertheless, this paper focuses
on the technical part and we would like to share our
preliminary results with the community.
An important factor for a triage in the entrance
area of the hospital is time. A measurement should
take place as quickly as possible and at the same time
be as accurate as possible. The actual measurement is
performed in a 30 second measurement window, fol-
lowed by an evaluation with a processing time below
3 seconds. With the resulting total duration it is pos-
sible to examine more than 100 persons in one hour.
6 CONCLUSION
In this study, we presented a contactless optical ap-
proach to determine the respiration rate in an hospi-
tal entrance for triage. Thereby, the method is based
on an optical flow, a PCA and a frequency analysis.
We could demonstrate that the results are accurate
(RMSE of 1.4 bpm) and fast (less than 35 seconds)
at the same time.
A clinical study to validate the results in a clini-
cal setting is already planned. Further work will con-
centrate on including further vital parameters such as
IMPROVE 2021 - International Conference on Image Processing and Vision Engineering
34

heart rate and blood pressure to the contactless mea-
surement procedure. Thereby, the focus should not
be solely on COVID-19 but as well on other diseases
with different symptoms. Furthermore, we intend
to expand our idea of a remote respiration rate de-
termination to other application areas such as access
control to buildings and public transport, assistance
robots and recovery monitoring.
REFERENCES
Bartula, M., Tigges, T., and Muehlsteff, J. (2013). Camera-
based system for contactless monitoring of respira-
tion. In Engineering in Medicine and Biology Society
(EMBC), 2013 35th Annual International Conference
of the IEEE, pages 2672–2675. IEEE.
Dalal, N. and Triggs, B. (2005). Histograms of oriented
gradients for human detection. In 2005 IEEE com-
puter society conference on computer vision and pat-
tern recognition (CVPR’05), volume 1, pages 886–
893. IEEE.
Jin Fei and Pavlidis, I. (2010). Thermistor at a Distance:
Unobtrusive Measurement of Breathing. IEEE Trans-
actions on Biomedical Engineering, 57(4):988–998.
Koolen, N., Decroupet, O., Dereymaeker, A., Jansen, K.,
Vervisch, J., Matic, V., Vanrumste, B., Naulaers, G.,
Van Huffel, S., and De Vos, M. (2015). Automated
Respiration Detection from Neonatal Video Data:. In
Proceedings of the International Conference on Pat-
tern Recognition Applications and Methods, pages
164–169. SCITEPRESS - Science and and Technol-
ogy Publications.
Lim, S. H., Golkar, E., Rahni, A., and Ashrani, A. (2014).
Respiratory motion tracking using the kinect camera.
In Biomedical Engineering and Sciences (IECBES),
2014 IEEE Conference on, pages 797–800. IEEE.
Lukac, T., Pucik, J., and Chrenko, L. (2014). Contactless
recognition of respiration phases using web camera.
In Radioelektronika (RADIOELEKTRONIKA), 2014
24th International Conference, pages 1–4. IEEE.
Martinez, M. and Stiefelhagen, R. (2012). Breath rate mon-
itoring during sleep using near-ir imagery and pca. In
Pattern Recognition (ICPR), 2012 21st International
Conference on, pages 3472–3475. IEEE.
Massaroni, C., Lopes, D. S., Lo Presti, D., Schena, E., and
Silvestri, S. (2018). Contactless monitoring of breath-
ing patterns and respiratory rate at the pit of the neck:
A single camera approach. Journal of Sensors, 2018.
Ostadabbas, S., Sebkhi, N., Zhang, M., Rahim, S., Ander-
son, L. J., Lee, F. E.-H., and Ghovanloo, M. (2015). A
Vision-Based Respiration Monitoring System for Pas-
sive Airway Resistance Estimation. IEEE Transac-
tions on Biomedical Engineering, pages 1–1.
Poh, M.-Z., McDuff, D., and Picard, R. (2011). Advance-
ments in Noncontact, Multiparameter Physiological
Measurements Using a Webcam. Biomedical Engi-
neering, IEEE Transactions on, 58(1):7–11.
Reyes, B. A., Reljin, N., Kong, Y., Nam, Y., and Chon,
K. H. (2016). Tidal volume and instantaneous respira-
tion rate estimation using a volumetric surrogate sig-
nal acquired via a smartphone camera. IEEE journal
of biomedical and health informatics, 21(3):764–777.
Shi, J. and Tomasi, C. (1993). Good Features to Track.
Technical report, Cornell University, Ithaca, NY,
USA.
Tan, K. S., Saatchi, R., Elphick, H., and Burke, D. (2010).
Real-time vision based respiration monitoring sys-
tem. In Communication Systems Networks and Digital
Signal Processing (CSNDSP), 2010 7th International
Symposium on, pages 770–774. IEEE.
Tarassenko, L., Villarroel, M., Guazzi, A., Jorge, J., Clifton,
D. A., and Pugh, C. (2014). Non-contact video-
based vital sign monitoring using ambient light and
auto-regressive models. Physiological Measurement,
35(5):807–831.
Tomasi, C. and Kanade, T. (1991). Detection and Tracking
of Point Features. Technical report, Carnegie Mellon
University.
Viola, P. and Jones, M. J. (2004). Robust real-time face
detection. International Journal of Computer Vision,
57(2):137–154.
Welch, P. (1967). The use of fast fourier transform for
the estimation of power spectra: a method based on
time averaging over short, modified periodograms.
IEEE Transactions on audio and electroacoustics,
15(2):70–73.
Wiede, C., Richter, J., and Hirtz, G. (2019). Contact-less vi-
tal parameter determination: An e-health solution for
elderly care. In VISIGRAPP (5: VISAPP), pages 908–
915.
Wiede, C., Richter, J., Manuel, M., and Hirtz, G. (2017).
Remote respiration rate determination in video data-
vital parameter extraction based on optical flow and
principal component analysis. In International Con-
ference on Computer Vision Theory and Applications,
volume 5, pages 326–333. SCITEPRESS.
Contactless Optical Respiration Rate Measurement for a Fast Triage of SARS-CoV-2 Patients in Hospitals
35
