
BarChartAnalyzer: Digitizing Images of Bar Charts
Komal Dadhich, Siri Chandana Daggubati
∗
and Jaya Sreevalsan-Nair
a,†
Graphics-Visualization-Computing Lab, and E-health Research Center,
International Institute of Information Technology Bangalore, Bangalore, India
Keywords:
Chart Classification, Chart Segmentation, Chart Image Analysis, Optical Character Recognition, Data
Extraction, Text Recognition, Text Summarization, Convolutional Neural Network, Bar Charts, Stacked Bar
Charts, Grouped Bar Charts, Histograms.
Abstract:
Charts or scientific plots are widely used visualizations for efficient knowledge dissemination from datasets.
However, these charts are predominantly available in image format. There are various scenarios where these
images are interpreted in the absence of datasets used initially to generate the charts. This leads to a pertinent
need for data extraction from an available chart image. We narrow down our scope to bar charts and propose a
semi-automated workflow, BarChartAnalyzer, for data extraction from chart images. Our workflow integrates
the following tasks in sequence: chart type classification, image annotation, object detection, text detection
and recognition, data table extraction, text summarization, and optionally, chart redesign. Our data extraction
uses second-order tensor fields from tensor voting used in computer vision. Our results show that our workflow
can effectively and accurately extract data from images of different resolutions and of different subtypes of
bar charts. We also discuss specific test cases where BarChartAnalyzer fails. We conclude that our work is an
effective and special image processing application for interpreting charts.
1 INTRODUCTION
Data can be interpreted better when presented as visu-
alizations, wherein one of the simplest and most ubiq-
uitous forms is the class of charts. Chart representa-
tion specifically is a widely used approach, which is
evident from the inclusion of the basic understanding
of simple charts in the curriculum of primary school
education. Simple charts, e.g., bar charts, scatter
plots, etc., are commonly found in documents (text-
books, publications), print media (newspapers, maga-
zines), and on the internet; and are most prevalent in
image format. There are use cases of redesign and re-
construction of charts for getting high-resolution im-
ages for applications such as generating accessible
reading materials for differently-abled students. The
chart redesign also enables students with learning dif-
ficulty to understand data using alternative designs.
These applications pose a problem when the source
data for the charts is not available alongside the chart
image for ready consumption. Thus, data extraction
in the form of semi-structured tables (Methani et al.,
a
https://orcid.org/0000-0001-6333-4161
∗
K. Dadhich and S. C. Daggubati contributed equally.
†
Corresponding author.
2020) from these chart images is a relevant problem,
specifically in the space of improving assistive tech-
nologies.
Amongst all statistical plots, bar chart representa-
tion is the most commonly used one for visual sum-
marization. Since the design space for charts is large,
in terms of chart types and their formatting, we focus
on bar charts here. Bar charts have subtypes, depend-
ing on the data type and user requirement, such as
simple, stacked, grouped bar charts, to name a few.
Stacked and grouped bar charts help visualize multi-
class or multi-series data. The grouped bar chart gives
inter-and intra-class trends, and the stacked bars give
part-to-whole information for multiple classes.
The redesigning of multi-series charts is a moti-
vating application, as they are relatively difficult to
interpret (Burns et al., 2009). The redesign entails
the requirement of source data that is used to gen-
erate the original plot as well as information about
classes/multi-series being represented in the image.
The state-of-the-art in reasoning over scientific plots
includes bar charts (Methani et al., 2020; Choi et al.,
2019), where object detection using convolutional
neural networks (CNN) for bars may fail for specif-
ically the stacked bars. Hence, we revisit the im-
Dadhich, K., Daggubati, S. and Sreevalsan-Nair, J.
BarChartAnalyzer: Digitizing Images of Bar Charts.
DOI: 10.5220/0010408300170028
In Proceedings of the International Conference on Image Processing and Vision Engineering (IMPROVE 2021), pages 17-28
ISBN: 978-989-758-511-1
Copyright
c
2021 by SCITEPRESS – Science and Technology Publications, Lda. All rights reserved
17

Chart Image
Image Annotation (C2)
Text Detection and
Recognition (C5)
CNN
Classification
(C1)
Canvas Extraction (C3) Tensor Field Computation
and Corner Detection (C4)
Of bar chart type
Not of bar chart type
Data (Table) Extraction (C6)
Chart Reconstruction/
Redesign
The plot depicts a Vertical
Grouped Bar Graph. The plot
is between Weight on y-axis
over Date on the x-axis for
c39, and c52. The Weight of
c39 has an overall decreasing
trend from d16 to d21. The
Weight of c52 starts with 2 in
d16 then increases till d20,
followed by and finally ends
with 1 in d21
Chart Summary (C7)
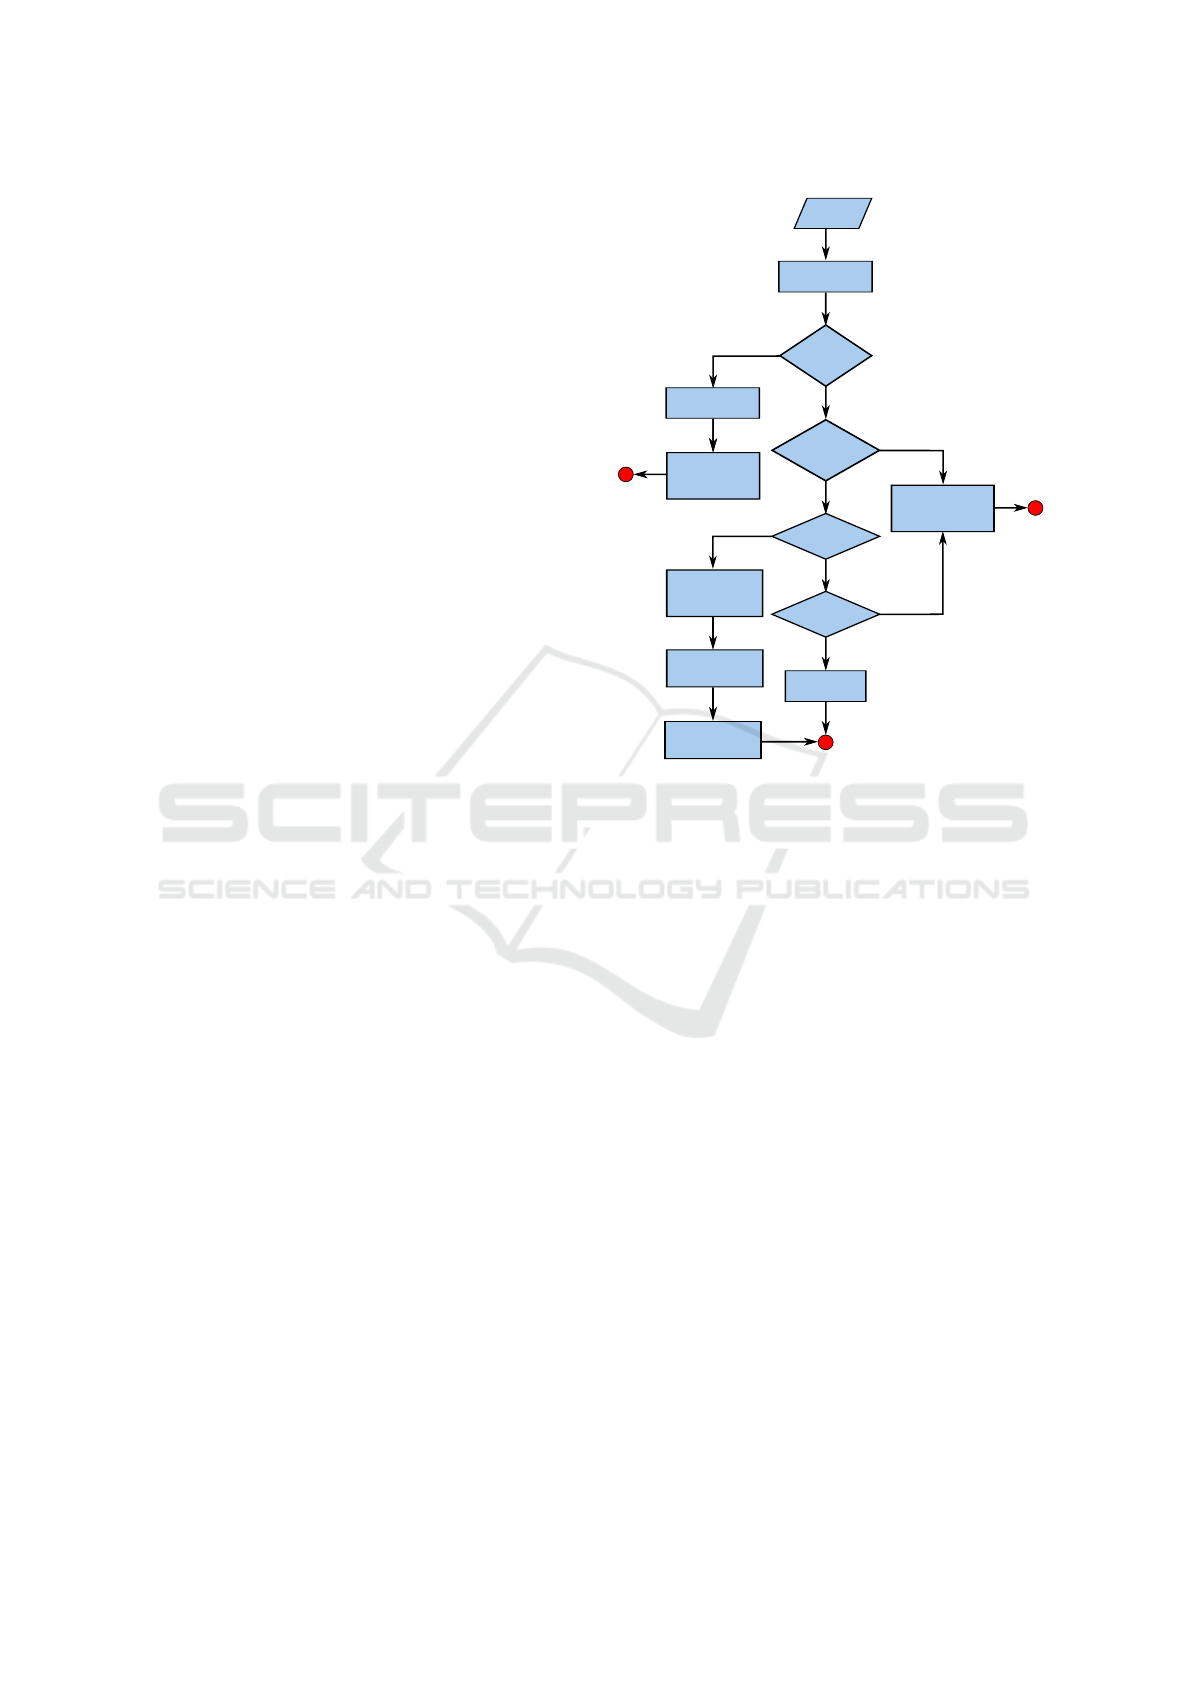
Figure 1: Our proposed workflow for data extraction from a given image of a chart using our proposed semi-automated
BarChartAnalyzer (BCA), with seven components (C1-C7), for applications including chart reconstruction and redesign.
Significant components include C1 for classifying the chart image to bar charts and its subtypes, C2-C4 for feature extraction,
C5 for text detection for data contextualization, and finally C6 for generating the data table.
age processing method exploiting spatial locality for
object detection (Sreevalsan-Nair et al., 2020). We,
thus, propose a semi-automated workflow (Figure 1),
called BarChartAnalyzer, that can take an image as in-
put, identify the bar chart, sub-classify it to bar chart
type, and then perform data extraction. The extracted
data can be further used for reconstruction to get cus-
tomized charts of high-resolution image quality, as
well as for redesigning the complex to simpler charts.
Our contributions in this work are in:
• proposing a complete semi-automated workflow
for digitizing images of bar charts and its seven
subtypes, including stacked bar charts,
• identifying appropriate state-of-the-art algorithms
for text recognition in bar charts,
• generating training dataset for bar chart images
covering all seven subtypes, and a complement set
“others”,
• proposing a flowchart for templatizing text sum-
mary of bar charts from its images, and
• conducting a systematic study of limitations in our
workflow for specific test cases.
2 RELATED WORK
Chart analysis is generally divided into smaller tasks
such as chart type classification, data extraction and
optionally, reconstruction or redesign, and summa-
rization. Revision is a system that performs tasks like
identifying chart type, extracting visual elements, and
encoded data by creating feature vectors and identify-
ing geometric structures in pixel space (Savva et al.,
2011). WebPlotDigitizer is another system that pro-
vides both automatic and manual procedures to ex-
tract data from given chart images (Rohatgi, 2011).
However, the tool requires extensive user interaction
for aligning axes to select data points. It works for
simple bars but fails for stacked and grouped bar
charts in giving class information.
Machine learning models have been effectively
used for classification and/or object detection prob-
lems in chart analysis. Beagle is a web-based sys-
tem for classifying charts in scalable vector graphics
format (Battle et al., 2018). Text type classification
has been done using feature vector generated using
the geometric property of text along with mark type
classification using a fine-tuned AlexNet (Poco and
Heer, 2017). FigureSeer uses a similar fine-tuning ap-
proach (Siegel et al., 2016). A convolutional neural
network (CNN) model used for chart classification,
can also used for object detection, e.g., for chart ob-
jects such as bars in the source image (Choi et al.,
2019). ChartSense uses GoogleNet for chart clas-
sification for line, bar, pie, scatter charts, map, and
table types (Jung et al., 2017). ChartSense further
uses the connected components method to extract bar
objects, using the x-axis as a baseline in the image.
While this method works for simple bar charts, the
charts with bars of multiple series (e.g., grouped bars)
get incorrectly identified as belonging to the same se-
ries. The existing methods using object detection-
based approach have not been shown to work for all
subtypes of bar charts, e.g., stacked bars, for which
training data is currently unavailable.
Text detection is important for chart inference.
Automated data extraction for bar charts has been
done by identifying graphical components and text
regions independently (Al-Zaidy and Giles, 2015).
Chart data is further extracted using inference.
Chart analysis has been used for applications of
automated question-answer systems. PlotQA is one
such solution for reasoning over scientific plots that
uses a more accurate neural network for object de-
IMPROVE 2021 - International Conference on Image Processing and Vision Engineering
18

tection for visual elements, such as bars (Methani
et al., 2020). However, manual drawing of bounding
boxes around bars fails for complex bar types, such
as stacked bars. Hence, we use the method that ex-
ploits spatial locality using second-order tensor fields
for corner detection (Sreevalsan-Nair et al., 2020) in
our proposed system. While PlotQA is an example
of an approach where data is extracted, an alterna-
tive approach for chart question answering (CQA)
is through the use of Transformers for answering
questions from charts directly, e.g., Structure-based
Transformer using Localization, STL-CQA (Singh
and Shekhar, 2020).
Textual summary of a chart is a relevant task for
its interpretation. While its relevance may appear
counter-intuitive as the charts are visual summary of
data, its text summarization is useful for the visually
impaired users to read its images, usually embedded
in documents. Linguistic constructs have been used
to generate a chart summary with the help of seman-
tic graph representation (Al-Zaidy et al., 2016). Three
types of features have been selected from charts,
namely, salience, trend, and rank, that encode details
like increasing or decreasing trend, any specific col-
ored bar showing highly prominent detail. However,
we have found the summary output of the system to
have a limited description. Summaries, especially for
bar charts, have also been generated by calculating
differences using existing attributes in chart images
and providing the core message represented by the se-
lected chart (Demir et al., 2008). The iGRAPH-Lite
system generates a short summary explaining the vi-
sual description of the chart itself but does not provide
insight into the information provided by visualization
using the chart (Ferres et al., 2007).
3 PROPOSED WORKFLOW &
IMPLEMENTATION
We propose a workflow that extracts data from a given
chart image, BarChartAnalyzer, which has seven
main components (Figure 1), namely, chart subtype
classification, chart image annotation, canvas extrac-
tion, tensor field computation, text recognition, data
table extraction, and chart summarization.
Chart Subtype Classification (C1). Data is repre-
sented using different chart types based on the num-
ber of variables and user requirements. For exam-
ple, scatter plots and bar chart representations visu-
ally encode the data differently, which require dif-
ferent approaches for chart analysis. In the case of
bar charts, there are subtypes available in the design
space, namely, simple bars, grouped bars, stacked
bars, and of different orientations, depending on de-
sign requirements. Since the process of data extrac-
tion from a given chart image depends on its chart
type, identifying both the type and subtype informa-
tion is the first step of our workflow.
Image classification is a widely studied problem in
computer vision, and it has been done using different
CNN-based classification models such as AlexNet,
GoogleNet. These models were trained and tested for
a set of natural images provided during the ImageNet
challenge (Deng et al., 2009). The natural images
contain characteristics other than the shape of the ob-
ject as well, like texture, finer edges, color gradients,
etc. However, compared to natural images, the chart
images are sparser and more structured with repeat-
ing patterns. Hence, the models that work for natural
images do not work effectively for chart images.
The chart objects such as bars, scatter points, and
lines are distinguishable based on their shape and ge-
ometry, unlike objects found in natural images. The
chart subtypes for bar charts also have similar geom-
etry through chart objects. Overall, contour-based
techniques for chart subtype classification are inef-
ficient. Some of the pre-trained models have been
used for chart type classification of images by impos-
ing certain constraints, e.g., training with a small im-
age corpus; however, the classification outcomes have
low accuracy. The classifier in ChartSense has used
GoogleNet (Jung et al., 2017) and has been trained
on different chart types. This model classifies sub-
types, such as grouped and simple bars, also, since
the features are similar in both subtypes. However,
other subtypes of our interest, namely, stacked bar
charts, have not been explored. On the other hand,
mark-based chart classification has been used (Poco
and Heer, 2017), where the classifier is trained to rec-
ognize specifically five mark types: bars, lines, areas,
scatter plot symbols, and other type. This classifier
is limited to identify the chart type without extension
to subtypes. Thus, we explore all bar chart subtypes,
including the stacked bar charts and histograms, that
have not been explored at all in the state-of-the-art.
Our classifier is inspired by the VGGNet (Visual
Geometry Group Network) architecture (Simonyan
and Zisserman, 2015), which is widely used for object
detection and segmentation tasks on image databases,
such as KITTI (Chen, 2015), an image benchmark
dataset for road-area and ego-lane detection (Fritsch
et al., 2013). We choose the VGGNet architecture
as it is efficient in feature extraction from images,
and addresses the issue of depth in convolutional net-
works. It is also simple to implement for a new model,
with the flexibility of adding more VGG blocks. The
BarChartAnalyzer: Digitizing Images of Bar Charts
19

Figure 2: (Left) The architecture diagram of our CNN-based classifier for identifying bar chart subtypes. (Right) Human-
guided annotation of the chart image, where the chart canvas is used for object detection.
VGGNet architecture has a stack of convolutional lay-
ers (Figure 2) that generalizes the deep learning tasks.
Our CNN model is a combination of the convolu-
tional, pooling, and fully connected layers. The con-
volutional layers are responsible for extracting fea-
tures by convolving images using kernels or filters.
Our classifier uses max-pooling to reduce computa-
tion by reducing the spatial size by half. The tailing
layers in our classifier are the fully connected layers
that take the results of the pooling/convolutional layer
and assign it a label/class. Our classifier identifies the
bar chart subtype of an input image. This classifica-
tion also results in checking if the given image is of
bar chart type, as the workflow downstream accepts
only bar charts, rejecting the others.
Our chart image dataset consists of images of
seven different subtypes of bar charts, namely, sim-
ple, grouped/clustered, and stacked bar charts of hor-
izontal and vertical orientations and histograms. For
training our CNN model, the training dataset consists
of images of these seven subtypes, and additionally
an “other” category. The “other” category of im-
ages consists of scatter plots, line and pie chart im-
ages, which are commonly found charts, that are not
bar chart subtypes. Histograms are included as one
of the subtypes of bar charts since some of the plot-
ting tools, e.g., Google sheets and Microsoft Excel®,
use bar charts for histogram plots. Also, we observe
that the geometry of bins in histograms is the same
as columns/bars in the bar charts. Our CNN-based
classifier requires input images of fixed size for train-
ing; hence, we first resize the images in the dataset
to 200 × 200 size. The image resizing and classifier
implementation has been done using Python imag-
ing (PIL) and Keras libraries, respectively. Our CNN
model for chart sub-type classification is novel in its
application for classifying bar chart subtypes. Our
classifier assigns class labels to an input image speci-
fying the bar chart subtype and its orientation, except
in the case of histograms, e.g., “horizontal grouped
bar”, “vertical stacked bar”.
Image Annotation (C2) and Canvas Extraction
(C3). Image annotation is usually performed to
prepare training datasets for computer vision-related
problems like object detection, segmentation, etc.
The idea behind image annotation is to provide la-
bels to different regions of interest (ROI) in the im-
ages. These predefined labels are used to detect and
extract regions of interest. As this task requires con-
textual labels and appropriate associations between
labels and ROIs, human-guided annotation of images
is a straightforward image annotation approach.
For chart images, manual marking and annota-
tion of bounding boxes for ROIs have been widely
used (Choi et al., 2019; Methani et al., 2020). Differ-
ent labels are decided for components of chart images
based on their role in the visualization, such as canvas,
x-axis, y-axis, x-labels, y-labels, legend, title, x-title,
and y-title. We use LabelImg (Tzutalin, 2015) as a
tool to mark and annotate bounding boxes for ROIs
of a chart image. LabelImg is a Python tool with a
graphical user interface (GUI) for interactively select-
ing an image, drawing a bounding box for an ROI, an-
notating the ROI, and labeling the ROI. We use the la-
bel Canvas for the ROI that contains the chart objects
such as bars, lines, or scatter points and is defined as
chart canvas, which is one of the chart image compo-
nents (Sreevalsan-Nair et al., 2020). The annotation
is generated as an XML file that is processed to ex-
tract the canvas region as well as for text localization.
The former is used for chart extraction (C3), and the
latter for text detection (C5). Figure 2 (right) shows a
sample annotated bar chart.
The canvas extraction step (C3) includes image
preprocessing methods to remove the remaining ele-
ments other than chart objects such as gridlines, over-
laid legends, etc. The subsequent step (C4) on ten-
sor field computation is sensitive to the presence of
these extraneous elements, which lead to erroneous
results. Image processing techniques marker-based
watershed segmentation and contour detection algo-
rithm have been used to remove such components in
the chart canvas effectively (Sreevalsan-Nair et al.,
2020). These steps also fill hollow bars, as required,
since the tensor field is computed effectively for filled
bars. Highly pixelated edges in aliased images lead
to uneven edges in each bar object. This issue is ad-
IMPROVE 2021 - International Conference on Image Processing and Vision Engineering
20

dressed by using the contour detection method to add
a fixed-width border to bars (Sreevalsan-Nair et al.,
2020). Overall, we perform these steps to extract a
chart canvas containing chart objects used in C4.
Tensor Field Computation (C4). Tensor fields have
been widely used to exploit geometric properties of
objects in natural images (Medioni et al., 2000) us-
ing structure tensor and tensor voting. We use local
geometric descriptor as a second-order tensor for ten-
sor vote computation (Sreevalsan-Nair and Kumari,
2017) that further leads to corner detection in case
of bars for a given bar chart. Structure tensor T
s
at
a pixel provides the orientation of the gradient com-
puted from the local neighborhood, computed as:
T
s
= G
ρ
∗ (G
T
G), where G =
h
∂I
∂x
∂I
∂y
i
is the gradient tensor at the pixel with intensity I; con-
volved (using ∗ operator) with Gaussian function G
with zero mean and standard deviation ρ. The tensor
vote cast at x
i
by x
j
using a second-order tensor K
j
in
d-dimensional space is, as per the closed-form equa-
tion (Wu et al., 2016): S
i j
= c
i j
R
i j
K
j
R
0
i j
,
where R
i j
= (I
d
− 2r
i j
r
T
i j
); R
0
i j
= (I
d
−
1
2
r
i j
r
T
i j
)R
i j
,
I
d
is the d-dimensional identity matrix; unit vector of
direction vector r
i j
=
ˆ
d
i j
, with d
i j
= x
j
− x
i
; σ
d
is the
scale parameter; and c
i j
= exp
−
σ
−1
d
.kd
i j
k
2
2
. The
gradient T
g
can be used as K
j
(Moreno et al., 2012).
Anisotropic Diffusion: As the tensor votes T
v
in nor-
mal space have to encode object geometry in tan-
gential space, we perform anisotropic diffusion to
transform T
v
to tangential space (Sreevalsan-Nair and
Kumari, 2017; Sreevalsan-Nair et al., 2020). The
eigenvalue decomposition of the two-dimensional T
v
yields ordered eigenvalues, λ
0
≥ λ
1
, and correspond-
ing eigenvectors v
0
and v
1
, respectively. Anisotropic
diffusion of T
v
using diffusion parameter δ, is:
T
v-ad
=
1
∑
k=0
λ
0
k
.v
k
v
T
k
, where λ
0
k
= exp
−
λ
k
δ
.
Diffusion parameter value (δ = 0.16) is widely
used (Wang et al., 2013; Sreevalsan-Nair et al., 2020).
Saliency Computation: The saliency of a pixel
to belong to geometry features of line- or
junction/point-type is determined by the eigen-
values of T
v-ad
(Sreevalsan-Nair et al., 2020). We get
the saliency maps at each pixel of an image of its
likelihood for being a line- or junction-type feature,
C
l
and C
p
, respectively, C
l
=
λ
0
−λ
1
λ
0
+λ
1
and C
p
=
2λ
1
λ
0
+λ
1
,
using eigenvalues of T
v-ad
of the pixel, such that,
λ
0
≥ λ
1
. The pixel with C
p
≈ 1.0 is referred to as a
critical point or degenerate point in the parlance of
tensor fields. Our goal is to find all the critical points
in the chart canvas in the C4 step.
DBSCAN Clustering: The critical points of chart
image computed from tensor field computation form
sparse clusters at the corners of each bar (Sreevalsan-
Nair et al., 2020). These pixels are localized us-
ing density-based clustering, DBSCAN (Ester et al.,
1996), and cluster centroids are computed by adjust-
ing hyperparameters of DBSCAN clustering to spe-
cific chart types. These cluster centroids are treated
as corners of the bar. Using the positional layout or
arrangement of these corner points based on the spe-
cific chart type and subtype, we heuristically compute
the height of each bar in pixel space.
Text Recognition (C5) and Information Aggrega-
tion for Data Extraction (C6). The data we have ex-
tracted from the chart image, using tensor field com-
putation, is in the image (or pixel) space. However,
the extracted data has to be in the data space for ac-
curately summarizing, and optionally, reconstructing
the chart. Hence, to transform the data from the pixel
space to the data space, we now combine the data in
pixel space with the text information in the image.
We perform text detection to get x-axis and y-axis la-
bels and compute the scale factor between the pixel
and data spaces. The recognition of other textual el-
ements, namely, plot title, legend, x-axis, and y-axis
titles, also plays a crucial role in analyzing chart im-
age, e.g., the information is used in summary (C7).
Tesseract-OCR is known for its popularity in text
detection and recognition (Smith, 2007). It works ef-
fectively with scanned document images with a clean
background with regular font, plain layout, and single
uniform color. However, Tesseract fails for text im-
ages with different colors, sizes, orientations, curvy
fonts, and different languages, along with interfer-
ences or issues in the text, such as low resolution, ex-
posure, noise, motion blur, out-of-focus, varying illu-
mination, etc. Here, chart images may have text with
numerical characters, small text font size, formatting,
and blurry appearance. Yet, few of these cases are
solved by improving image resolution, varying orien-
tations in text regions like axis labels and chart title in
a chart image are falsely recognized. Also, Tesseract
tends to incorrectly detect non-textual elements, such
as arrows, color boxes in legend, etc., in the image.
We explore the use of deep-learning-based OCR,
namely Character Region Awareness for Text Detec-
tion, CRAFT (Baek et al., 2019) for effective text area
detection, including arbitrarily-oriented text. This ap-
proach is designed for relatively complex text in im-
ages, and it works by exploring each character region
and considering the affinity between characters. A
CNN designed in a weakly-supervised manner pre-
dicts the character region score map and the affinity
score map of the image. The character region score
BarChartAnalyzer: Digitizing Images of Bar Charts
21
is used to localize individual characters and affinity
scores to group each character to a single instance.
So, the instance of text detected is not affected by its
orientation and size. The text orientation is inferred
from the detected text boxes and is then rotated to hor-
izontal orientation for the extraction.
The CRAFT text detection model can be followed
by a unified framework for scene text recognition that
fits all variants of scenes, called the scene text recog-
nition framework, STR (Baek et al., 2019). Being
a four-stage framework consisting of transformation,
feature extraction, sequence modeling, and predic-
tion, STR resembles the combination of computer vi-
sion tasks such as object detection and sequence pre-
diction task, and hence, uses a convolutional recurrent
neural network (CRNN) for text recognition. We find
that the CRAFT model, along with the STR frame-
work, works efficiently to retrieve labels and titles of
the chart image better than Tesseract OCR.
In our workflow, we transform the data extracted
in pixel space to data space and add appropriate tex-
tual information for the variable name and bar width
to extract the data table in C6. For both stacked and
grouped bar charts, we identify class or series infor-
mation using the legend to add to the extracted data ta-
ble. However, BarChartAnalyzer can only be used to
distinguish bars and stacked segments differentiated
based on color, but those differentiated using texture
will not give correct output with our workflow.
Chart Summarization (C7). Today chart images
are increasingly used in mass media and other print
media for knowledge dissemination. However, such
information encoded in the graph remains inaccessi-
ble to the visually impaired. While we aim to retrieve
the data table from the chart image, the users with the
need to access the encoded information may not find
this data table useful. Instead, the brief, significant
details of this data and/or chart itself are useful. Thus,
our next step is to generate a summary of the chart im-
age based on its retrieved data table and the chart im-
age, thereby allowing the user to know enough about
the chart image before having the option to access the
data table to learn more about the chart.
An effective summary should be accurate and con-
cise for readers to consume. We present a well-built
sentence structure to generate a summary of bar charts
using the data table retrieved from the chart image in a
way that captures the core information of the data ta-
ble. The sentence structure is heuristically produced
based on features identified from the extracted data.
Based on this sentence structure produced, the sum-
mary for the intended graph image is generated. The
features of the chart used in summary depend on its
type and subtype. For the histogram type chart, we
Describe
titles & chart type
Is the
chart subtype
is histogram?
Extracted
data table
Describe binwidth,
range and mode
Is the
chart image
a plot of ordered
attributes?
Yes
No
Compute best fit
distribution and
describe it
No
Is the
chart subtype
is simple bar?
Yes
Yes
No
Is the
data in
sorted order?
Yes
Describe legends,
range and
standard deviation
No
Compute Spearman
correlation, describe
if value > 0.5
Describe any single
item creating an
exception in trend
Describe data
range & mean
Describe trends in
graph, if any
Figure 3: The proposed flow chart of sentence structure for-
mation for chart summary generation in text format (C7).
focus on features like the type of distribution, range,
and mode. For bar charts with categorical variables,
we check for ordinal variable type, e.g., age, date, day,
month, and year in the image, and extract the variable-
based trend patterns in the chart image. Apart from
these, we consider the statistical descriptors, such
as the range of attributes, correlation between them,
standard deviations, and mean values based on cases
mentioned in our proposed flowchart (Figure 3). We,
thus, generate the chart summary using the template
abstracted in the flowchart.
4 EXPERIMENTS & RESULTS
In C1 of the BarChartAnalyzer, we have trained the
CNN model for classification using 1000 images be-
longing to eight types of charts, namely, the seven
subtypes of bar charts and a complement set, “oth-
ers”, consisting of chart images of line charts, scatter
plots, and pie charts. The training set excludes im-
ages for charts with textured, hollow, or hand-drawn
bar objects. The training accuracy for our classi-
fier is currently at 85%. For testing, we have used
a dataset of 50 chart images each from these eight
types. For experiments, we generated a dataset that
IMPROVE 2021 - International Conference on Image Processing and Vision Engineering
22
Corner DetectionText Detection
Input Chart Images
A
C
B
Reconstrcted Chart
from Extracted Data
D
E
Text Summary
The plot depicts a Horizontal Simple Bar Graph
illustrating In general, how satisfied are you
with your job?. The plot is having Percent of
Respondents on x-axis. The Percent of
Respondents has an overall decreasing trend
from very satisfie to very
dissatisfied
A
C
B
D
E
The plot depicts a Histogram with the bins
ranging from 0.0 to 10.0 with 1.68 bin width.
The mode of a histogram is 2.0 with a
frequency of 200. The frequency distributio
histogram is the norm with following
parameters loc=0.00, scale=1.00.
A
C
B
D
E
The plot depicts a Vertical Grouped Bar Graph
illustrating Employed Workers by Gender for
Select Jobs. The plot is between Employed on
y-axis over Job on the x-axis for women, and
men. The list of 'Job' values is actor,
bartender, dentist, engi ineer, scientist, and
scientist. The 'women' range from 0.0 to
232592.19, with a standard deviation of
76529.27. The 'men' range from 30206.07 to
397559.66, with a standard deviation of
123926.7. The categories 'women' and 'men'
are positively correlated by 0.66 Spearman
rank correlation. All except for bartender 'men'
is greater than 'women'
The plot depicts a Vertical Stacked Bar Graph
for brand c, brand b, and brand a. The list of
'X-axis' values is jan, feb, mar, apr, june, jul,
aug, and aug. The 'brand c' range from 0.0 to
80.42, with a standard deviation of 30.2. The
'brand b' range from 0.0 to 80.42, with a
standard deviation of 30.33. The 'brand a'
range from 0.0 to 89.32, with a standard
deviation of 38.0. The categories 'brand c' and
'brand a' are positively correlated by 0.56
Spearman rank correlation. The categories
'brand b' and 'brand a' are positively correlated
by 0.61 Spearman rank correlation
(i)
(ii) (iii)
(iv)
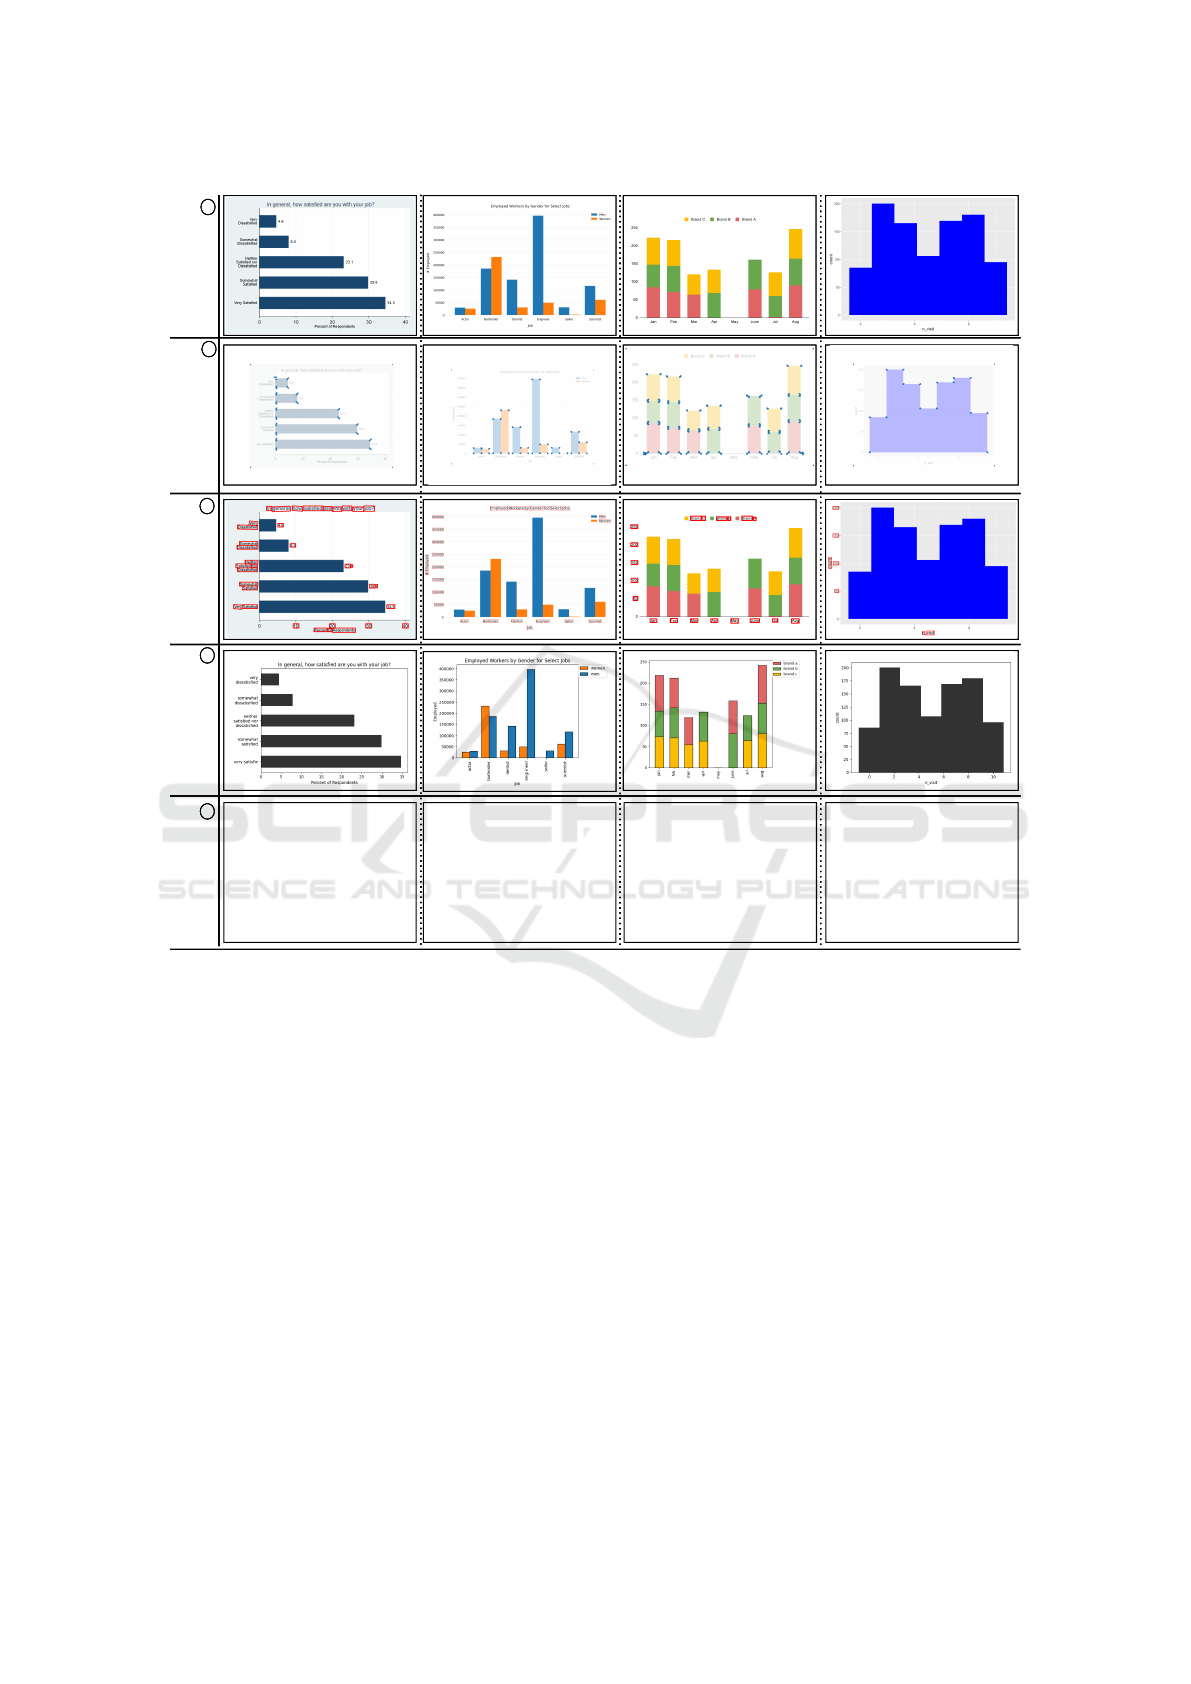
Figure 4: The key steps in our BarChartAnalyzer workflow of corner detection (C4), text detection (C5), data extraction (C6),
chart reconstruction, and chart summary (C7) of the source input chart images. We observe the ordering of the series could
be reversed in (ii) the grouped and (iii) stacked bar charts, even though the data is extracted accurately.
includes bar chart images of these eight types from
two sources, namely images downloaded from the in-
ternet and synthetically generated images. The latter
is from bar charts generated using Python plotting li-
brary, matplotlib from known data tables.
The results from the BarChartAnalyzer for a subset of
our experiments are shown in Figure 4. The images
are first classified, and only those of bar charts and
its subtypes pass through the BarChartAnalyzer. The
source images are given in Figure 4(A). The tensor
field analysis on extracted canvas detects the corner of
the bars using critical points identified by the saliency
value calculation. The results of pixels identified by
corner detection are shown in Figure 4(B). The criti-
cal points are detected at the top and bottom corners
of bars and at the bar segment junctions in the stacked
bar chart. The histogram displays the distribution of
such points at the junction where the transition be-
tween bins occurs. The visualization of critical points
at corners also guides us in deciding the hyperparam-
eters for DBSCAN, e.g., distance (eps), minPts.
The OCR based text detection model (Baek et al.,
2019) works with 0.95 F1 score on ICDAR 2013
dataset. The model fails to detect certain text compo-
nents during testing, as shown in Figure 4(C, ii). Our
workflow addresses this limitation while performing
data extraction based on pixel scaling and the in-
tervals retrieved from the detected text/values. Our
reconstructed charts in Figure 4(D) can be visually
compared with the original images in Figure 4(A).
Color is an important property of the images of
the multi-series bar charts like grouped and stacked
bar, as color is a visual encoding of the metadata of
the series. In such cases, color represents the identity
BarChartAnalyzer: Digitizing Images of Bar Charts
23
nMAE=0.009, MAPE=0.89% nMAE=0.011, MAPE=1.07% nMAE=0.025, MAPE=6.55% nMAE=0.021, MAPE=2.26%
nMAE=0.003, MAPE=0.33%
nMAE=0.006, MAPE=0.61%
nMAE=0.008, MAPE=6.51%
nMAE=0.005, MAPE=0.52%
nMAE=0.004, MAPE=0.53%
nMAE=0.020, MAPE=12.65%
nMAE=0.051, MAPE=51.88%
nMAE=0.040, MAPE=38.62%
nMAE=0.012, MAPE=1.38%
nMAE=0.006, MAPE=0.65%
nMAE=0.014, MAPE=1.20%
nMAE=0.002, MAPE=0.18%
(i)
(ii) (iii) (iv)
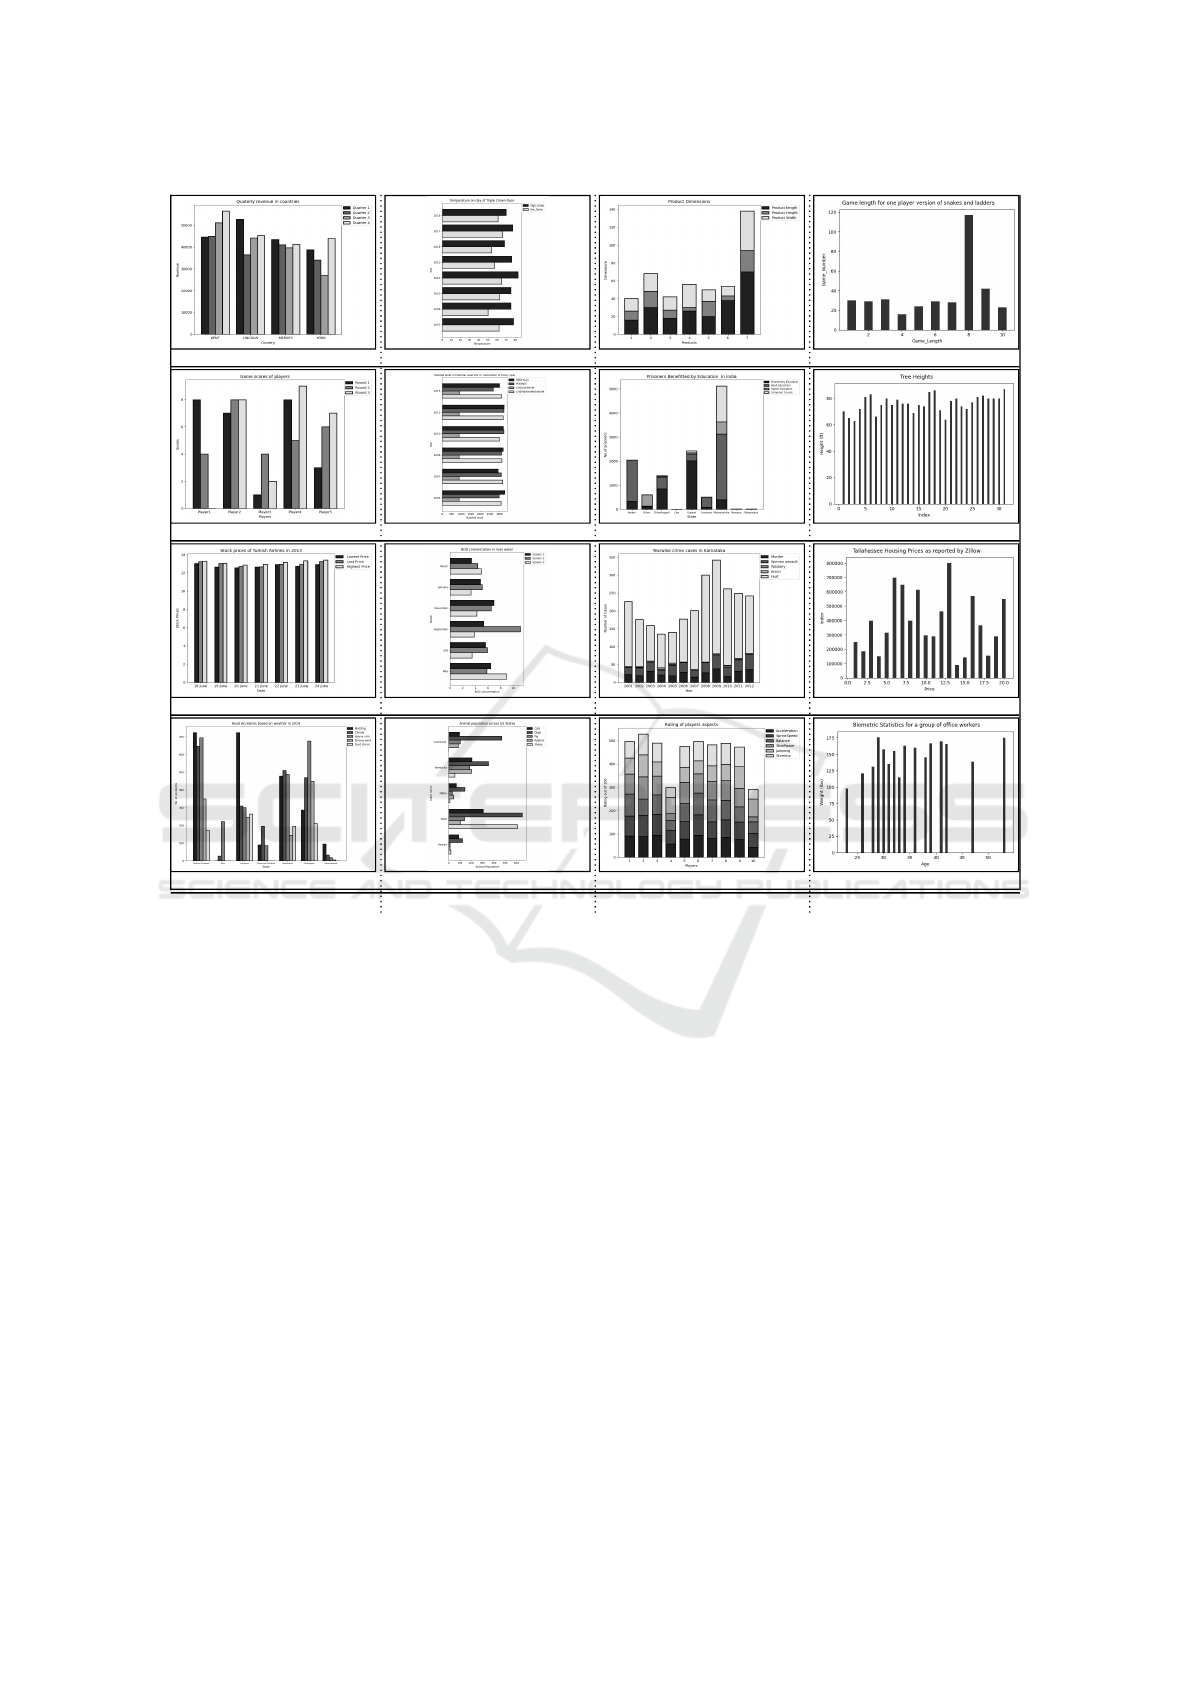
Figure 5: Reconstruction of synthetically generated bar chart images with their error evaluation in normalized mean absolute
error (nMAE) and mean absolute percentage error (MAPE).
of the class or series the data item belongs to. But,
in the case of simple bar charts and histograms, the
use of color is cosmetic. Our algorithm preserves the
source color value only in the case of it being a visual
encoding, where we use the color value identified in
the legend for the bars during reconstruction. In the
cases where color is not used as a visual encoding for
the chart, we use a default color value, i.e., black, dur-
ing reconstruction. Thus, color is preserved in recon-
struction for charts in Figure 4(ii, iii), but not in Fig-
ure 4(i, iv). However, even where color is preserved,
the order of rendering the series is not guaranteed to
be preserved, as shown in Figure 4(ii, iii), as ordering
of the classes or series is not an important property in
the multi-series bar charts.
Evaluation. The premise of our work is to extract
data from images of charts that do not have accom-
panying data tables, i.e., the ground truth. Hence,
to compare the extracted data with source informa-
tion, we run our algorithm on images of charts gen-
erated using the plotting library, e.g., matplotlib,
from known data tables. While our algorithm works
well with such synthetically generated images ow-
ing to their high resolution and fidelity, they are use-
ful in computing exact numerical errors in the ex-
tracted data table. The extracted data achieved by
mapping pixel location of cluster center of degener-
ate points and text location extracted using OCR. We
observe that the extracted values have numerical pre-
cision errors predominantly. Hence, to compare the
difference between the extracted values, we compute
the normalized Mean Absolute Error (nMAE), and
the Mean Absolute Percentage Error (MAPE) for the
synthetic images (Figure 5), which are bounded in
[0,1]. MAPE is commonly reported in a percentage
format. We observe that nMAE captures our perfor-
mance better than MAPE, as it does not augment nu-
merical precision errors as much as MAPE. MAPE
is augmented in the case of missing extracted data
IMPROVE 2021 - International Conference on Image Processing and Vision Engineering
24
Corner DetectionText Detection
Input Chart Images
A
C
B
Reconstrcted Chart
from Extracted Data
D
E
Text Summary
The plot depicts a Horizontal Stacked Bar
Graph illustrating Male age structure. The plot
is having Population, millions on x-axis for 14 o
years a, 15 64 years i, and older 65 and years.
The list of 'Y-axis' values is united states,
brazil, russia, japan, mexico, germany, and
germany. The '14 o years a' range from 5.63
to 29.61, with a standard deviation of 8.64.
The '15 64 years i' range from 20.41 to 91.49,
with a standard deviation of 21.93. The 'older
65 and years' range from 3.4 to 15.11, with a
standard deviation of 3.8. The categories '14 o
years a' and '15 64 years i' are positively
correlated by 0.89 Spearman rank correlation.
The plot depicts a Horizontal Simple Bar Graph
illustrating Fatalities in filght accidents. The
plot is between Flight Id on y-axis over
Fatalities on the x-axis. The Flight Id with the
highest Fatalities 112.04 is '2'. The Flight Id
with the lowest Fatalities 2.72 is '4'. The mean
Fatalities of Flight Id is 39.18.
The plot depicts a Vertical Simple Bar Graph
illustrating Percentage of United States Women
in the Labor Force. The plot is between
Percentage of Women on y-axis over Year on
the x-axis. The Percentage of Women has an
overall increasing trend from 1956 to 2012.
The plot depicts a Histogram with the bins
ranging from 3 to 43 with 4.87 bin width. The
mode of a histogram is 23 with a frequency of
397. The frequency distribution of histogram is
the norm with following parameters loc=0.00,
scale=1.00.
(i)
(ii)
(iii)
(iv)
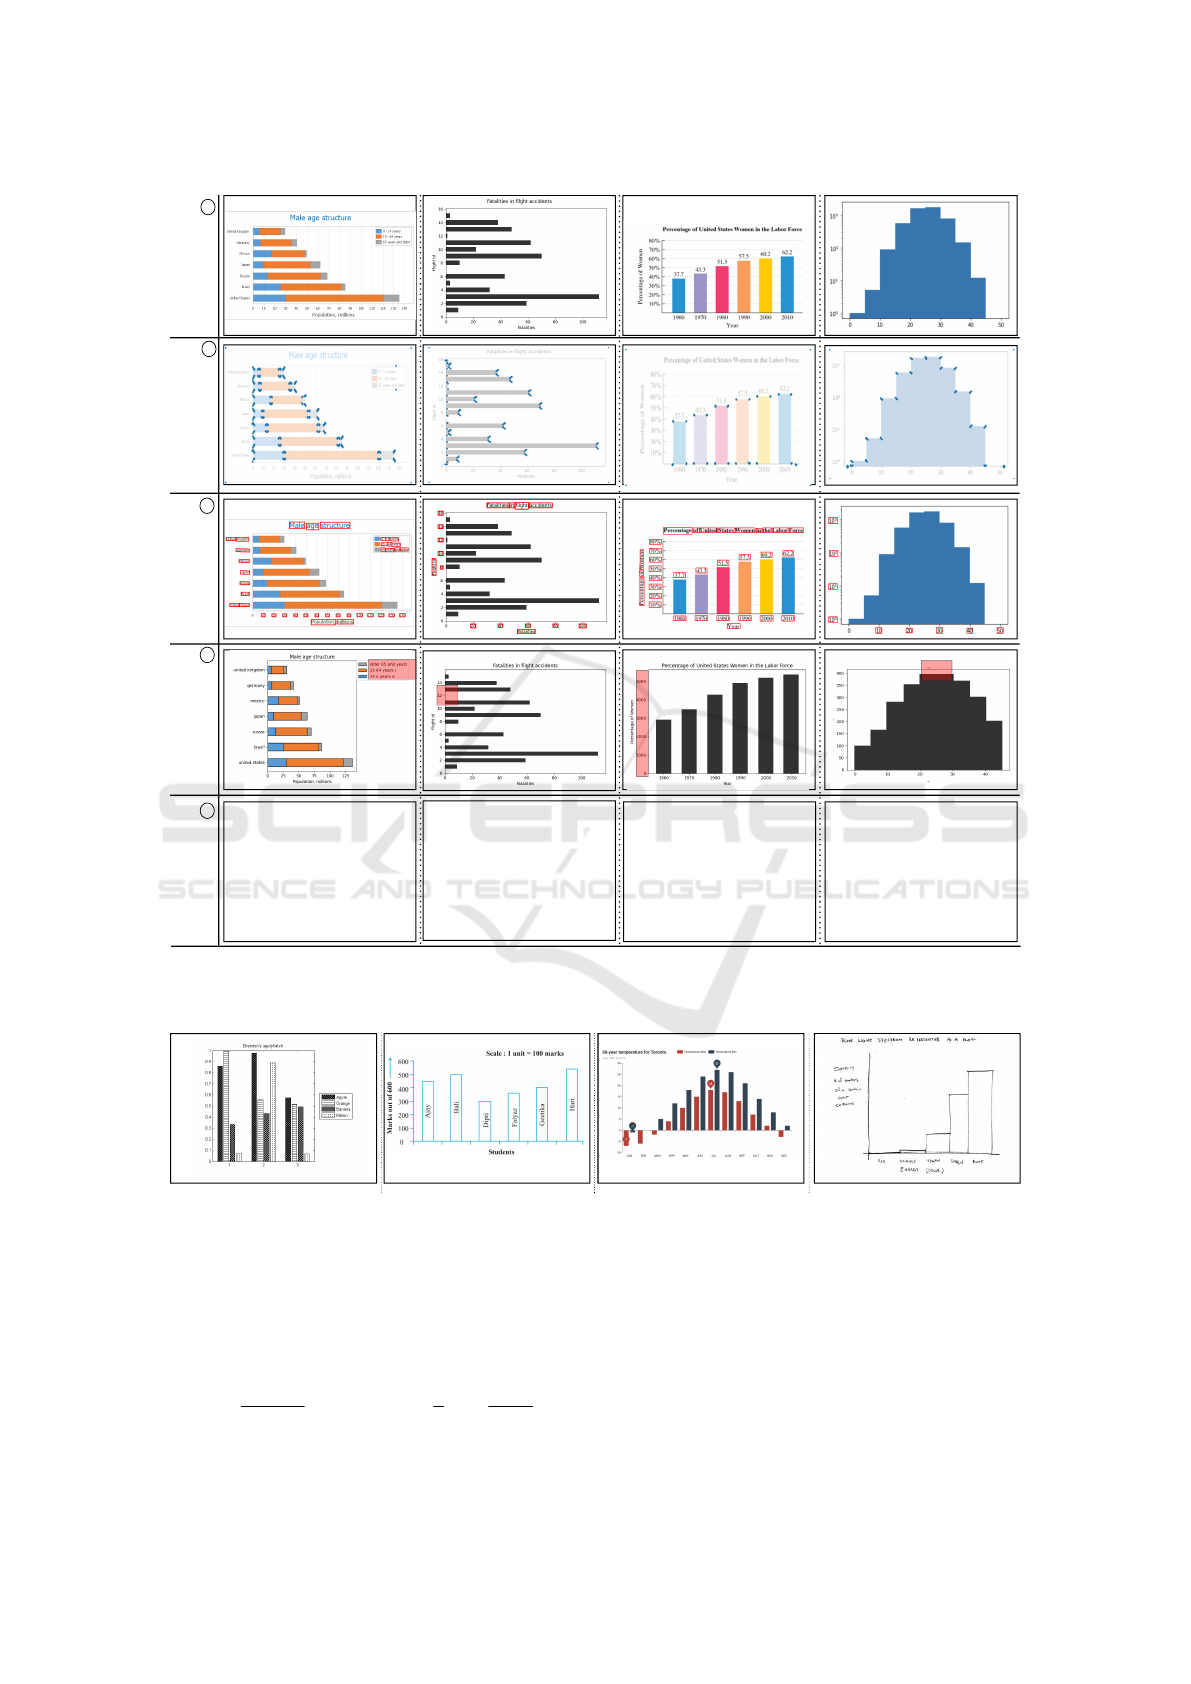
Figure 6: Examples of bar chart images that give erroneous results in BarChartAnalyzer. The errors in the chart reconstruction
are indicated using red translucent boxes in row D.
(a) Textured grouped bar (b) Hollow bars with text inside (c) Bar chart with graphics (d) Hand drawn bar chart
Figure 7: Bar charts generated in different design spaces, which are known to not work with our chart analysis workflow,
BarChartAnalyzer.
in grouped bar charts (Figure 5(ii)) and stacked bar
charts (Figure 5(iii)) owing to relatively short bars or
bar segments. For N data items with source data value
x
i
and its corresponding extracted value x
(e)
i
,
nMAE=
N
∑
i=1
|x
i
−x
e
i
|
N
∑
i=1
x
i
; and MAPE =
1
N
.
N
∑
i=1
x
i
−x
(e)
i
x
.
In our representative examples in Figure 5, we ob-
serve relatively low nMAE values. Histograms are
not included in this analysis as the source, and ex-
tracted data in its case is a frequency table, different
from a data table in the case of bar charts.
BarChartAnalyzer achieves near-perfect accuracy
for high-resolution bar chart images, created with
BarChartAnalyzer: Digitizing Images of Bar Charts
25

standard or minimal formatting available commonly
across all plotting libraries. The morphological
methods for image preprocessing in C3 in BarChar-
tAnalyzer improve data extraction accuracy from
low-fidelity images. The aggregated accuracy for
PlotQA (Methani et al., 2020) for CQA is 22%, and
STL-CQA (Singh and Shekhar, 2020) achieves near-
perfect accuracy, but with synthetic datasets. How-
ever, comparing our work with the CQA algorithms is
not a fair comparison, as the goals are different, even
though there are overlapping outcomes. Accuracy-
based comparison is not a complete exercise in itself.
Limitations. In a limited number of cases,
our system suffers from errors in detection, specif-
ically when DBSCAN clustering does not distin-
guish small/insignificant height differences between
bars/bins (Sreevalsan-Nair et al., 2020). We have
identified two such cases. The first case is of false
negatives when bars are close to the baseline, which
is the x-axis and y-axis for column and bar orienta-
tions, respectively (Figure 6(D, ii)). The second case
is when heights of adjacent bins in a histogram have
relatively small height differences, and the extracted
data does not capture the differences (Figure 6(D,
iv)). This error is also manifested as missing values in
grouped and stacked bar charts when the bars or bar
segments are relatively short (Figure 5(ii),(iii)).
The text recognition model (Baek et al., 2019)
identifies text with F1 score of 0.93 on ICDAR 2013
dataset. This recognition model misidentifies and
confuses the alphabet ’O’ or ’o’, irrespective of the
case, as the numeral ’0’ and vice versa in chart im-
ages. Also, the model has gaps in handling special
characters, such as $,%,£, sign(-), and cannot han-
dle superscript symbols, e.g., degrees, and exponents
(Figure 6(C, iii)). These shortcomings affect the ac-
curacy of extracted data scale (Figure 6(C, i)). The
inaccurate results in text recognition also manifest as
errors in the textual summary of the source image.
Some of these errors in text detection are shown in
the reconstructed chart in Figures 6(D, i) and (D, iii).
Thus, the key drawback in our BarChartAnalyzer
is in the false positives for corner detection in rela-
tively low-fidelity images, owing to aliasing and sub-
sequent pixelation. Also, our classification model
cannot handle variants of bar charts with textures in
the bars or hollow bars. Our workflow fails for chart
canvas extraction for such special test cases, e.g., im-
ages shown in Figure 7. Even though not consid-
ered a best practice, bars may be created with text or
bar value written inside each bar, as shown in Fig-
ure 7(b). BarChartAnalyzer also fails for another test
case where the data extraction process cannot identify
negative bars, as shown in Figure 7(c). The text recog-
nition model fails to identify text written in the hand-
drawn chart shown in Figure 7(d). One of the draw-
backs in our methodology, just as is the case with the
state-of-the-art, lies in human-guided canvas extrac-
tion and interactive hyperparameter setting for DB-
SCAN for clustering corner points.
5 CONCLUSIONS
As a next step, such a subtype-based analysis can be
extended to other chart types, such as scatter plots.
Our workflow requires user interaction for tasks such
as image annotation for canvas extraction and set-
ting hyperparameters of DBSCAN. We are consider-
ing methods to make the workflow more automated.
We currently use tensor field computation on the chart
images, which can be made more robust to separate
chart objects from the source image. As VGGNet
has been widely used for object detection tasks, our
goal is to improve our classifier to automate the can-
vas extraction step to reduce user dependency. Super-
resolution algorithms may be explored as an addi-
tional component in our algorithm to improve the ac-
curacy of both OCR and object detection, especially
for severely aliased images.
In summary, we propose a workflow BarChart-
Analyzer using standard image processing techniques
and deep learning models to perform the critical task
of chart image digitization and summarization for bar
charts. BarChartAnalyzer is novel in handling seven
different bar chart subtypes. Our contributions in-
clude the mapping between pixel space data and the
data space using the text detection model. We intro-
duce the chart type- and structure-based templatized
text summarization for the data extracted from the
chart image. The summarization achieved from our
system has the potential of being used in a language
processing module, such as gtts in Python, to gener-
ate an audio summary of the given chart image for the
visually impaired audience. As discussed, our work-
flow has limitations of the dependency of workflow
on the image fidelity, object size, training dataset, a
variety of chart images, etc. Overall, our work is a
step towards chart image digitization.
ACKNOWLEDGEMENTS
This work has been funded by the Machine In-
telligence and Robotics Center (MINRO) grant to
the International Institute of Information Technol-
ogy Bangalore (IIITB) by the Government of Kar-
nataka. The authors are grateful for the discussion
IMPROVE 2021 - International Conference on Image Processing and Vision Engineering
26

with T. K. Srikanth, IIITB; Sindhu Mathai of Azim
Premji University; Vidhya Y. and Supriya Dey of Vi-
sion Empower; Neha Trivedi, XRCVC; Vani, Push-
paja, Kalyani, and Anjana of Braille Resource Center,
Matruchayya, that has shaped this work. The authors
are thankful for the helpful comments from anony-
mous reviewers.
REFERENCES
Al-Zaidy, R., Choudhury, S., and Giles, C. (2016). Auto-
matic summary generation for scientific data charts.
In WS-16-01, volume WS-16-01 - WS-16-15, pages
658–663, United States. AI Access Foundation.
Al-Zaidy, R. A. and Giles, C. L. (2015). Automatic extrac-
tion of data from bar charts. In Proceedings of the
8th International Conference on Knowledge Capture,
K-CAP 2015, pages 1–4, New York, NY, USA. Asso-
ciation for Computing Machinery.
Baek, J., Kim, G., Lee, J., Park, S., Han, D., Yun, S.,
Oh, S. J., and Lee, H. (2019). What is wrong with
scene text recognition model comparisons? dataset
and model analysis. volume abs/1904.01906, pages
4714–4722.
Baek, Y., Lee, B., Han, D., Yun, S., and Lee, H. (2019).
Character region awareness for text detection. In 2019
IEEE/CVF Conference on Computer Vision and Pat-
tern Recognition (CVPR), pages 9357–9366.
Battle, L., Duan, P., Miranda, Z., Mukusheva, D., Chang,
R., and Stonebraker, M. (2018). Beagle: Automated
extraction and interpretation of visualizations from the
web. In Proceedings of the 2018 CHI Conference on
Human Factors in Computing Systems, CHI ’18, page
1–8, New York, NY, USA. Association for Computing
Machinery.
Burns, R., Carberry, S., and Elzer, S. (2009). Modeling Rel-
ative Task Effort for Grouped Bar Charts. In Proceed-
ings of the Annual Meeting of the Cognitive Science
Society, volume 31.
Chen, T. (2015). Going deeper with convolutional neural
network for intelligent transportation. PhD thesis, Ph.
D. dissertation, Dept. Elect. Comput. Eng., Worcester
Polytech. Institute.
Choi, J., Jung, S., Park, D. G., Choo, J., and Elmqvist, N.
(2019). Visualizing for the non-visual: Enabling the
visually impaired to use visualization. In Computer
Graphics Forum, volume 38, pages 249–260. Wiley
Online Library.
Demir, S., Carberry, S., and McCoy, K. F. (2008). Generat-
ing textual summaries of bar charts. In Proceedings of
the Fifth International Natural Language Generation
Conference, INLG ’08, page 7–15, USA. Association
for Computational Linguistics.
Deng, J., Dong, W., Socher, R., Li, L.-J., Li, K., and Fei-Fei,
L. (2009). ImageNet: A large-scale hierarchical im-
age database. In 2009 IEEE conference on computer
vision and pattern recognition, pages 248–255. IEEE.
Ester, M., Kriegel, H.-P., Sander, J., and Xu, X. (1996).
A density-based algorithm for discovering clusters in
large spatial databases with noise. In Proceedings of
the Second International Conference on Knowledge
Discovery and Data Mining, KDD’96, page 226–231.
AAAI Press.
Ferres, L., Verkhogliad, P., Lindgaard, G., Boucher, L.,
Chretien, A., and Lachance, M. (2007). Improving
accessibility to statistical graphs: The igraph-lite sys-
tem. In Proceedings of the 9th International ACM
SIGACCESS Conference on Computers and Accessi-
bility, Assets ’07, page 67–74, New York, NY, USA.
Association for Computing Machinery.
Fritsch, J., Kuehnl, T., and Geiger, A. (2013). A new per-
formance measure and evaluation benchmark for road
detection algorithms. In 16th International IEEE Con-
ference on Intelligent Transportation Systems (ITSC
2013), pages 1693–1700. IEEE.
Jung, D., Kim, W., Song, H., Hwang, J.-i., Lee, B., Kim,
B., and Seo, J. (2017). Chartsense: Interactive data
extraction from chart images. In Proceedings of the
2017 CHI Conference on Human Factors in Comput-
ing Systems, CHI ’17, page 6706–6717, New York,
NY, USA. Association for Computing Machinery.
Medioni, G., Tang, C.-K., and Lee, M.-S. (2000). Ten-
sor Voting: Theory and Applications. Proceedings of
RFIA, Paris, France, 3.
Methani, N., Ganguly, P., Khapra, M. M., and Kumar, P.
(2020). PlotQA: Reasoning over Scientific Plots. In
The IEEE Winter Conference on Applications of Com-
puter Vision, pages 1516–1525.
Moreno, R., Pizarro, L., Burgeth, B., Weickert, J., Gar-
cia, M. A., and Puig, D. (2012). Adaptation of ten-
sor voting to image structure estimation. In Laidlaw,
D. H. and Vilanova, A., editors, New Developments
in the Visualization and Processing of Tensor Fields,
pages 29–50, Berlin, Heidelberg. Springer Berlin Hei-
delberg.
Poco, J. and Heer, J. (2017). Reverse-Engineering Visu-
alizations: Recovering Visual Encodings from Chart
Images. In Computer Graphics Forum, volume 36,
pages 353–363. Wiley Online Library.
Rohatgi, A. (2011). Webplotdigitizer.
Savva, M., Kong, N., Chhajta, A., Fei-Fei, L., Agrawala,
M., and Heer, J. (2011). Revision: Automated clas-
sification, analysis and redesign of chart images. In
Proceedings of the 24th Annual ACM Symposium on
User Interface Software and Technology, UIST ’11,
page 393–402, New York, NY, USA. Association for
Computing Machinery.
Siegel, N., Horvitz, Z., Levin, R., Divvala, S., and Farhadi,
A. (2016). Figureseer: Parsing result-figures in re-
search papers. In Leibe, B., Matas, J., Sebe, N.,
and Welling, M., editors, Computer Vision – ECCV
2016, pages 664–680, Cham. Springer International
Publishing.
Simonyan, K. and Zisserman, A. (2015). Very Deep Con-
volutional Networks for Large-Scale Image Recogni-
tion. In Bengio, Y. and LeCun, Y., editors, 3rd In-
ternational Conference on Learning Representations,
BarChartAnalyzer: Digitizing Images of Bar Charts
27

ICLR 2015, San Diego, CA, USA, May 7-9, 2015,
Conference Track Proceedings.
Singh, H. and Shekhar, S. (2020). STL-CQA: Structure-
based Transformers with Localization and Encoding
for Chart Question Answering. In Proceedings of the
2020 Conference on Empirical Methods in Natural
Language Processing (EMNLP), pages 3275–3284.
Smith, R. (2007). An overview of the Tesseract OCR en-
gine. In Ninth international conference on document
analysis and recognition (ICDAR 2007), volume 2,
pages 629–633. IEEE.
Sreevalsan-Nair, J., Dadhich, K., and Daggubati, S. C.
(2020). Tensor Fields for Data Extraction from Chart
Images: Bar Charts and Scatter Plots. In Hotz, I., Ma-
sood, T. B., Sadlo, F., and Tierny, J., editors, Topolog-
ical Methods in Visualization: Theory, Software and
Applications (to appear). Springer-Verlag.
Sreevalsan-Nair, J. and Kumari, B. (2017). Local Geo-
metric Descriptors for Multi-Scale Probabilistic Point
Classification of Airborne LiDAR Point Clouds, pages
175–200. Springer Cham, Mathematics and Visual-
ization.
Tzutalin (2015). Labelimg. https://github.com/tzutalin/
labelImg.
Wang, S., Hou, T., Li, S., Su, Z., and Qin, H. (2013).
Anisotropic Elliptic PDEs for Feature Classification.
Visualization and Computer Graphics, IEEE Transac-
tions on, 19(10):1606–1618.
Wu, T.-P., Yeung, S.-K., Jia, J., Tang, C.-K., and Medioni,
G. (2016). A Closed-Form Solution to Tensor
Voting: Theory and Applications. arXiv preprint
arXiv:1601.04888.
IMPROVE 2021 - International Conference on Image Processing and Vision Engineering
28
