
Data Mining on the Prediction of Student’s Performance at the High
School National Examination
Daiane Rodrigues, Murilo S. Regio, Soraia R. Musse and Isabel H. Manssour
Pontifical Catholic University of Rio Grande do Sul, PUCRS, School of Technology, Porto Alegre, RS, Brazil
Keywords:
Educational Data Mining, Students’ Performance, National Exam Education, Logistic Regression.
Abstract:
The High School National Exam (ENEM) is the major Brazilian exam to measure the knowledge of high
school students. Since it is also used as a criterion to enter public and private universities, there is an interest
in identifying the indicators that have the most influence in obtaining good performance. This work presents
a prediction model for the participant’s performance, which allows us to identify the features that best explain
their exam results. For this work, we used open data provided by the Ministry of Education and the Logistic
Regression technique. The predictive model allows us to infer the student’s performance with an accuracy
of 74%. Also, since we are using a statistical model of easy interpretation and implementation, instead of a
complex Machine Learning technique, school managers could use the results without a deep understanding of
the used mining technique.
1 INTRODUCTION
The National High School National Exam (ENEM),
created in 1998 in Brazil, is a test carried out annu-
ally by the National Institute of Educational Studies
and Research An
´
ısio Teixeira (INEP), linked to the
Ministry of Education (MEC)
1
. The test is carried out
by students who are finishing high school, those who
will finish high school soon, and those who finished
high school in previous years, trying to evaluate their
performance at the end of high school and enabling
access to undergraduate courses.
The federal government, within the National Open
Data Policy
2
and through the Ministry of Education,
provides the information made available by the can-
didate at the time of registration, as well as the candi-
date’s grade on the exam. The microdata available is
an important source of information to know the pro-
file of the students who took the exam.
Since the grade score obtained from ENEM is em-
ployed as an entry criterion in public and private uni-
versities, there is a great interest in identifying the
characteristics of students who achieve high perfor-
mance. With that, it is possible to determine which
participants will have a lower probability of high per-
1
http://portal.inep.gov.br/web/guest/enem
2
http://www.planalto.gov.br/ccivil 03/ Ato2015-2018/
2016/Decreto/D8777.htm
formance, which allows for the creation of public
policies directed towards those students.
Therefore, this work aims is to build a model ca-
pable of identifying those features and, hence, pre-
dict which participants will have a high performance
on the test, based solely on the information provided
during registration. To build the model we used
the Logistic Regression technique, and we explored
ENEM’s open data made available by the INEP
3
. This
way, we are able to identify the student’s features
that highly influenced their performance on the exam.
Our method’s results achieved a higher accuracy than
most methods proposed in the literature, and it is the
first work to address multiple years of data from the
ENEM exam as far as we know. Furthermore, the
advantage of using a statistical model instead of a
Machine Learning technique is the easy interpreta-
tion and reproduction of the result obtained by the
constructed model. Also, the model can be used in
new exam applications without needing to retrain the
model. As the output of the technique provides the
weights for each variable in the model, school man-
agers can use the model’s output to build a calcula-
tor that shows the probability of high performance in
ENEM, as well as compare the difference between the
weights of each variable.
The remainder of this paper is organized as fol-
3
http://portal.inep.gov.br/web/guest/microdados
92
Rodrigues, D., Regio, M., Musse, S. and Manssour, I.
Data Mining on the Prediction of Student’s Performance at the High School National Examination.
DOI: 10.5220/0010408000920099
In Proceedings of the 13th International Conference on Computer Supported Education (CSEDU 2021) - Volume 1, pages 92-99
ISBN: 978-989-758-502-9
Copyright
c
2021 by SCITEPRESS – Science and Technology Publications, Lda. All rights reserved

lows: Section 2 addresses some important concepts
and related works. The used methodology is pre-
sented in Section 3, and the predictive model with the
achieved results is described in Section 4. The last
section presents our final remarks and future work.
2 BACKGROUND AND RELATED
WORK
The educational, social, and economical situation of
the students, and how they interact with each other,
are investigated to understand how the public poli-
cies can influence these issues (Ferreira and Gignoux,
2008). The student’s socioeconomic characteristics
affect their academic performance, thus forming a vi-
cious cycle of inequalities in education since those
who can invest in education came from a family that
could also afford a good education. Society recog-
nizes that there is a wage reward to those who invest
more in their education, which makes so the parents
need to invest more and more monetarily in a better
academic formation for their children (Kornrich and
Furstenberg, 2013). However, it does not matter how
relevant the economic situation of the student’s family
is, other factors must be considered, for example, gen-
der, race, and geographical region, which, due to his-
torical inequalities, may influence the student’s per-
formance on the exam (Ferreira and Gignoux, 2008).
The creation of automatic models that can help
predict the student’s performance is important to iden-
tify in advance profiles prone to underperform on the
exam, allowing the school to intervene, like seeking
out public policies that minimize inequality (Mac-
fadyen and Dawson, 2010). To create such models it’s
necessary to reach out to techniques such as statistical
methods and data mining algorithms. In the following
sections, we address some concepts that were impor-
tant in the development of this work, as well as some
related work in the literature.
2.1 Relative Risk
The Relative Risk (RR) is a descriptive measure that
provides information about the impact of a specific
variable in the event of interest, which in this work is
the performance on the ENEM exam, comparing the
risk of different categories of a variable and allowing
to find a possible causal relationship (Jaeschke et al.,
1995). In the scope of this work, for example, it is
measured how bigger is the risk of a male student
achieving higher performance on the exam when in
comparison to a female student. The calculation of
the RR is given by the ratio between two incidences,
where we take the individuals belonging to the event
of interest and then we divide the percentage of those
individuals who share the same category in a given
variable by the percentage of the ones who share a
different category in the same variable. Thus, consid-
ering the previous example, to obtain the RR of the
gender variable, we would need to divide the percent-
age of the female students who achieved high perfor-
mance by the percentage of male students who got the
same performance.
2.2 Logistic Regression
The Logistic Regression is a multivariate technique
appropriated for different situations since, from ex-
planatory features (continuous or discreet), it is pos-
sible to study the effect of such features in the pres-
ence (1) or absence (0) of a feature (Hosmer and
Lemeshow, 2000). Thus, through the Logistic Re-
gression, we can calculate the probability of an event
occurring, as shown in Equation 1.
π =
e
(β
0
+
∑
k
j=1
β
j
X
j
)
1 + e
(β
0
+
∑
k
j=1
β
j
X
j
)
. (1)
In this equation, π is the probability of the event oc-
curring and β
j
are the coefficients associated with
each variable X
j
.
The regression coefficients and their standard er-
ror are computed with the maximum likelihood esti-
mation method, which maximizes the probability of
obtaining the observed group of data through the es-
timated model. The Logistic Regression model has
a pre-condition of needing low correlation between
the predictor features because the model is sensible to
collinearity (Hair et al., 2006).
2.3 EDM and Related Work
The research area, called Educational Data Mining
(EDM), focuses on developing methods that seek to
extract insights using data collected in educational en-
vironments. Its main objective is to understand the
student, how they learn, and then develop methods
to help their academic trajectory. Prediction is one
of EDM’s branches, and the challenge it addresses is
the creation of methods for identifying relationships
between features and an event of interest, as, for ex-
ample, school evasion, so the students susceptible to
such event receive the appropriate help before it hap-
pens. Many works in the literature address prediction
using educational data, but we will highlight four of
them: two that are similar to our work, addressing the
prediction of the student’s performance on the ENEM
exam, and two that address the prediction of student’s
Data Mining on the Prediction of Student’s Performance at the High School National Examination
93

performance in courses, that have different objectives
from ours, but employ a similar methodology.
The work proposed in (Jha et al., 2019) makes
a predictive performance analysis of online course
students. The authors compare the performance of
Machine Learning algorithms using different sets of
features. The techniques explored were: Distributed
Random Forest (DRF), Gradient Boosting Machine
(GBM), Deep Learning (DL), and Generalized Linear
Model (GLM). Their proposed methodology uses 50
features, with 8 of those referring to demographic in-
formation, which made this type of information less
likely to stand out from the rest. The authors note
that these demographic features, such as the student’s
genre, age, and region, were not very relevant in their
context compared to other information such as the stu-
dent’s interactions in the virtual environments or the
student’s assessment scores. When evaluating the us-
age of the demographic features, they pointed out that
the Area Under the Curve (AUC) when using all 50
features was about 0.01 greater than when discarding
the 8 demographic features.
Our work, similar to what was done in (Jha et al.,
2019), analyzes the usage of demographic informa-
tion to predict the student’s performance, but we focus
solely on this type of information instead of using ex-
tra information like the grade on a specific test. The
student’s performance on a single test would be ex-
tremely valuable for our model, but it would make it
less useful since it would only be applicable after the
exam, as the grades are being published. We believe
that our model’s greatest value is to be used before
the exam, where schools can take action to try and
help the students. By analyzing the model proposed
by (Jha et al., 2019), the model is only applicable af-
ter the student already spent a considerable amount of
time in the course, so it cannot help the student early
on. Moreover, the authors do not clarify which fea-
tures are present in the final model, so it is not clear
which factors have a greater impact on the student’s
performance. Since in our work we focus on the un-
derstanding of which social-economic features influ-
ence more the student’s performance, we have chosen
a technique that can easily measure these probabili-
ties, this way, any school that wishes to compute the
probability of a particular student achieving high per-
formance in the exam, it can do so with relative ease.
The EDM application proposed in (Gonz
´
alez-
Marcos et al., 2019) analyzes the academic perfor-
mance of students in the fourth year of Bachelor in
Mechanical Engineering and students in the first year
of the master’s degree in Industrial Engineering. In
their work, they gathered data related to communica-
tion, time, resources, information, documentation, be-
havioral assessment, as well as the grades in the first
half of the course and used it as predictive features
for their model. The authors discuss the existence of
a possibility of using the model to identify “weaker”
students, those with a higher risk of not finishing the
course, so that action may be taken to address the situ-
ation before the student withdraws or underperforms.
The work proposed by (Stearns et al., 2017) ana-
lyzes data from the ENEM exam applied in 2014 to
predict the student’s final grade on the math exam.
The authors used two regression techniques based on
Decision Trees, testing the algorithms AdaBoost and
Gradient Boosting. In their experiments, the Gradi-
ent Boosting algorithm had the best performance with
an R
2
of 35%, then 35% of the final grade variability
could be explained by the model proposed. Although
their model did not achieve high predictive capabili-
ties, through their results, they were able to show that
social-economic features help to explain the student’s
performance on the math exam, but they do not dis-
cuss which features specifically they used.
In their work, (de Castro Rodrigues et al., 2019)
explore the data from the 2017 ENEM exam. They
analyzed how the familiar income relates to other fea-
tures on their dataset, leading to the selection of 48
features chosen by how strongly they related to fa-
miliar income. Their final selection consists of six
features: Schooling of the father or male guardian;
Schooling of the mother or female guardian; Has a
computer in their residence; Occupation of the father
or male guardian; Occupation of the mother or female
guardian; Took the exam seeking a scholarship.
Their model then predicted if the student would
get a final grade of at least 550, since, according to
the authors, it would be a grade good enough so the
student could get into a public university. They em-
ployed the Learn K-Nearest Neighbor KNN, Support
Vector Machine (SVM), Artificial Neural Network
(ANN), and Na
¨
ıve Bayes approach. On their tests, the
ANN approach achieved the best discriminatory re-
sults, with an accuracy of 99%. Furthermore, to look
for unknown patterns and rules in the dataset, they
applied a rule-based Data Mining method, and one
of the rules they found was that, in a certain region,
students that did not repeat a year in high school had
a final grade greater than 450. However, the authors
do not make it clear why they started with a selection
based on the student’s familiar income, and they also
do not explore the difference in importance between
the features of the final model. When comparing the
AUC achieved by each of their approaches, it is inter-
esting that the KNN algorithm got the best result, with
97.5%, followed by the Na
¨
ıve Bayes approach, which
got 87.5%, and the ANN approach, achieving only
CSEDU 2021 - 13th International Conference on Computer Supported Education
94

80.4%, and finally the SVM approach with 79.1%.
In their work, (Gomes et al., 2020) explore the
data from the 2011 ENEM exam and select 53
features for their model, encompassing information
about the student, special needs they require, the stu-
dent’s school, and the student’s family socioeconomic
situation. They use these features to build two Re-
gression Tree models, using all features for one and
pruning the second. The pruning algorithm selected
only 7 features for the model, those being: School the
student attended (e.g., public, private); Student’s fam-
ily monthly income; Took the exam seeking a schol-
arship; The state where the student resides; Took the
exam to obtain a Secondary Education certificate; The
student’s gender; Finished high school or not.
Their model tried to predict the student’s aver-
age in the natural science tests. The authors chose
to standardize the ground truth to a mean of 500 and
a standard deviation of 100, thus predicting values in
the interval (400, 600). When comparing their model
performance, the authors pointed out that the pruned
model has a 7.87% higher relative error, at 75.35%,
than the non-pruned version, at 67.48%. However the
pruned model has more interpretability value since it
has only 15 leaves while the non-pruned version has
2342 leaves. Given the results achieved with the non-
pruned model, which used most of the features avail-
able, the authors concluded that the microdata avail-
able is not able to explain the students’ performance
and argue that more psychological questions could
significantly improve predictive analysis of the data.
In this work, we will differ from (Stearns et al.,
2017; de Castro Rodrigues et al., 2019; Gomes et al.,
2020) by not only exploring different samples, bal-
anced and unbalanced, for the training and testing
processes but also by using samples from differ-
ent years to assess the predictive capabilities of our
model, which guarantees that the results obtained can
also be applied in other years of the ENEM exam.
Furthermore, we will also differ from their work by
thoroughly exploring the model’s features, since by
choosing the Logistic Regression technique to model
the data, we can easily present, clearly and concisely,
how the features that made into the model relate to the
student’s performance. Thus, we also make it possible
that school managers interested in applying the model
to their students before the exam can easily use and
understand the model without needing to learn and
understand complex models and techniques.
Figure 1: Systematic used for data mining.
3 METHODOLOGY
For the creation of the model, we started from the
method proposed by (Selau and Ribeiro, 2009), which
makes use of a system for the creation of prediction
models which is constituted by the following steps:
Defining the target Audience, Selection of the Sam-
ple, Preliminary Analysis, Model Creation, Model
Selection and Implantation. In this work, we replaced
the last two steps with an evaluation step, as is repre-
sented in the Figure 1.
First, we defined the model’s target audience as
the students whose performance we are interested in
predicting. In the second step, we defined our sam-
ple size and our train and test sets. After, we started
the preliminary analysis, variable pre-selection, and
category clustering. In the next step, we followed a
selection process to create the final model. Finally,
in the evaluation step, we applied evaluation metrics
to measure the model’s predictions. In the following
section, we will address in detail each of these steps
followed for the model’s creation.
4 MODELLING
In this work, we used data collected on the INEP’s
website from the exams applied in the years 2017 and
2018. In the initial stage, we used data from 2018 for
both the creation and testing processes of our model.
Then, to assess whether the model could be applied
using data from the exam in other years, we conducted
more tests but using data of the participants from the
2017 exam.
For the creation of the model, collection, and min-
ing of the data, we used the R language, version 3.5.1.
It is important to note that even though we described
the criteria used to select the sample of the 2018 exam
data, which was used in the model construction, the
same criteria were applied for the selection of the sec-
ond test sample from the 2017 exam. Next, we will
present, in details, each step taken for the creation of
the prediction model.
4.1 Defining the Target Audience
The model’s target audience was selected based on the
following requirements: (i) the student finished all of
the objective tests and the essay; (ii) the student is a
Regular Education Student, that is, the student is not
part of programs like Special Education or Young and
Adult Education; (iii) the student didn’t mark the op-
tion to do the exam for “training” purposes; (iv) the
student was completing high school in the same year
Data Mining on the Prediction of Student’s Performance at the High School National Examination
95

of the exam. Following these restrictions, we arrived
at a population of 1, 181, 386 students for the creation
process of our model. Then, we used the Boxplot
graph for a visual analysis over the distribution of
the final grade to identify potential outliers. Using
this method, we identified that grades below 288 and
grades above 760 are considered outliers. Thus, we
ended up removing 5, 324 (around 0.5%) observations
from our population.
We defined our answer variable as “the student
achieved a high performance on the exam”. Thus,
we separated our sample into two groups: the high
performing students and the average performing stu-
dents. We selected the third quartile (top 25% of the
highest grades) as the threshold for defining what is
considered a “high performance” in the exam. Thus
if a student got a final score of at least 584, we con-
sidered it a high-performing student. It is impor-
tant to note that we considered the “final score” to
be the average score between the four objective tests
(Human Sciences and their Technologies, Languages,
Codes and their Technologies, Nature Sciences and
their Technologies, and Mathematics and their Tech-
nologies) and the essay.
4.2 Selecting the Sample
When calculating the sample size, we stipulated the
criterion where at least 20 observations were selected
from each category of tested features (Hair et al.,
2006). We took balanced samples, randomly select-
ing 100, 542 students, half with an average perfor-
mance and half with a high performance, which is
enough sample size to ensure a representative sam-
ple of the population. The sample balancing was ap-
plied to avoid influencing the evaluation metrics of the
models since, because of the way our variable answer
was defined, our population consists of 25% obser-
vations of high-performing students, thus if we only
predicted the students as having an average perfor-
mance, then our model would still achieve an accu-
racy of 75%. And lastly, we randomly separated 80%
of our sample for development and 20% for test.
The features tested in the model are derived from
the student’s information filled in during registra-
tion or built from those raw features, like, for ex-
ample, per capita income. Following this process,
we started with 90 features, including personal infor-
mation about the student, the school’s data, the stu-
dent’s requests for specialized or specific assistance,
the place where the test was applied, and the socioe-
conomic questionnaire.
Due to the high number of features available,
we started the selection using RR, which measures
the risk associated with each category of the predic-
tor features against the answer variable. When this
percentage is too different, it means that the vari-
able will be important for the model. Instead, if
the percentage is similar, it tells us that the variable
will not have a discriminatory effect. After comput-
ing the RR, we grouped the categories according to
their RR, classifying them into 7 categories (Jaeschke
et al., 1995),which are: Terrible, for coefficients be-
tween (0, 0.5]; Very Bad, when between (0.5, 0.67];
Bad, when between (0.67, 0.9]; Neutral, when be-
tween (0.9, 1.1]; Good, when between (1.1, 1.5];
Very Good, when between (1.5, 2]; Excellent when
between (2, ∞].
Of the 90 initial features, we took out 51 because
their RR did not indicate a good predictive capability,
50 of those being related to requests for specialized or
specific resources, such as, for example, a braille test.
The RR was also used as a mean to cluster the cat-
egories since some features contained very few obser-
vations in each category, which could make the pre-
dictions not very robust (Lewis, 1992). We clustered
the categories of 30 features according to their RR
magnitude, including the Residence Federation Unit,
and the remaining features had already only 2 cate-
gories. With this, 39 features proceeded to the next
step of the creation of our model.
4.3 Creating the Model
First, we used the Stepwise selection method for a
new evaluation of the features. This method applies
the Logistic Regression and selects a set of variables
for the model automatically. Using this method, we
removed 7 features from our model:(i) State where the
student was born;(ii) Nationality;(iii) Hires a house-
keeper;(iv) Amount of bedrooms in the house; (v)
Amount of owned dishwashers;(vi) Owns a vacuum
cleaner;(vii) Amount of owned color TVs. After this
process, we reevaluated the model and noticed that
some variables coefficients were not significant any-
more, so we applied the RR again to regroup the cat-
egories. Then, we applied the Stepwise method again
to verify the new groups created, where only a sin-
gle variable, which referred to the student owning a
cellphone, was removed.
We used Logistic Regression as our modeling
technique after selecting the features. Since it al-
lows us to easily interpret the relationship between the
student’s features and their performance, we chose it
over other Machine Learning techniques. This way, in
addition to deriving how the student’s features relate
to their performance, any school manager can use, in-
terpret and understand those results without the need
CSEDU 2021 - 13th International Conference on Computer Supported Education
96

for a deep understanding of the used data mining tech-
niques.
Since one of the assumptions of the Logis-
tic Regression is the non-multicollinearity, we used
Cramer’s V
2
test as an additional test to guarantee that
there is no correlation between the features. We used
correlations greater than 0:25 as the threshold, which
is considered a high correlation (Akoglu, 2018). Af-
ter applying the test, we excluded 22 features from the
model, which are presented in Table 1.
Therefore, the final model is constituted of 9 fea-
tures, and all their coefficients have statistical rele-
vance (p − value < 0.01). We present in Table 2 the
features used on the final model, along with how they
relate to achieving high performance on the ENEM
exam. The coefficient’s magnitude indicates if in-
dividuals of the observed category have a higher or
lower probability of achieving high performance in
the exam than the reference category (ref ). For ex-
ample, we can see in Table 2 that studying in a public
school implies a lower probability, with a coefficient
of –2.1, of achieving high performance on the exam
when compared to studying in a private school, which
has a reference category. However, students who own
a clothes dryer are more likely, with a coefficient of
0.1, to achieve a high performance than students who
do not own a dryer, which has the reference category.
By analyzing the features and their coefficients
in Table 2, we infer that features such as owning a
dryer joined the model because they reflect the stu-
dent’s family income. We deduce that the same ap-
plies to the amount of refrigerators the student owns,
since students that declared not owning or owning a
single refrigerator have a lower probability, with a
coefficient of –0.2, of achieving a high performance
than students which declared owning more than one
refrigerator, which represents the reference category.
The variable representing the Federation Unit where
the student resides was defined by creating groups of
states, where students that do not reside within the
states of SP, RJ, MG, ES, DF, or SC were less likely
to achieve a high performance than students that re-
side in those states. Of the 6 states mentioned, 5 of
those were amongst the 8 largest Brazilian GDPs in
2019, except for ES, which was at the 14
t
h position.
In Figures 2 and 3, we present the concentra-
tions of the students, which achieved high perfor-
mance on the features of the final model in each cat-
egory. The figures consolidate the obtained results
from the model, showing that the difference between
the categories’ coefficients reflect the difference in
the performance of the students present in these cate-
gories. The most influential variable (the coefficient
with the highest absolute value) was the school type,
Table 1: Multicollinearity - Unselected Features.
Feature Description
Attention Deficit indicator
Per Capita income
Type of high school
Operating situation of the school
Schooling of the father or male guardian
Schooling of the mother or female guardian
Occupation of the father or male guardian
Occupation of the mother or female guardian
Number of residents in the residence
Familiar income
Number of bathrooms in the residence
Amount of cars owned
Amount of motorcycles owned
Amount of freezers owned
Amount of washing machines owned
Amount of microwaves owned
Amount of DVD-players owned
Has pay TV in their residence
Has landline in their residence
Has a computer in their residence
Has internet access in their residence
Type of school attended in high school
Table 2: Final model features.
Feature Description Coef
Public school −2.1
Municipal school −1.6
Private or federal school ref
Chosen Spanish for the foreign language exam −0.8
Chosen English for the foreign language exam ref
Rural school −0.5
Urban school ref
Younger than 17 years old −0.5
At least 17 years old ref
Declared as black, brown, yellow or indigenous −0.34
Declared as white or didn’t declare a race ref
Resides in the state: PI, CE, MS, BA, MT, MA,
PE, TO, PB, RO, AC, AL, PA, AM, SE, AP, RR
−0.3
Resides in the state: GO, RN, PR, RS −0.1
Resides in the state: SP, RJ, MG, ES, DF, SC ref
Male 0.2
Female ref
Owns either a single refrigerator or none −0.2
Owns at least two refrigerators ref
Owns a clothes dryer 0.1
Does not own a clothes dryer ref
where those who studied at public schools will have
a lower probability of achieving high performance
on the exam when compared to those who studied
in private or federal schools. We corroborate these
results in Figure 2, which shows that only 13:99%
of state school and 24:53% of municipal school stu-
dents achieved a high performance, while 61:68% of
private school students got similar results. Also, al-
though women represented the majority (58:1%) of
candidates, only 22:8% of the candidates achieved
high performance on the exam while 27:9% of men
achieved similar results (Figure 3).
Data Mining on the Prediction of Student’s Performance at the High School National Examination
97
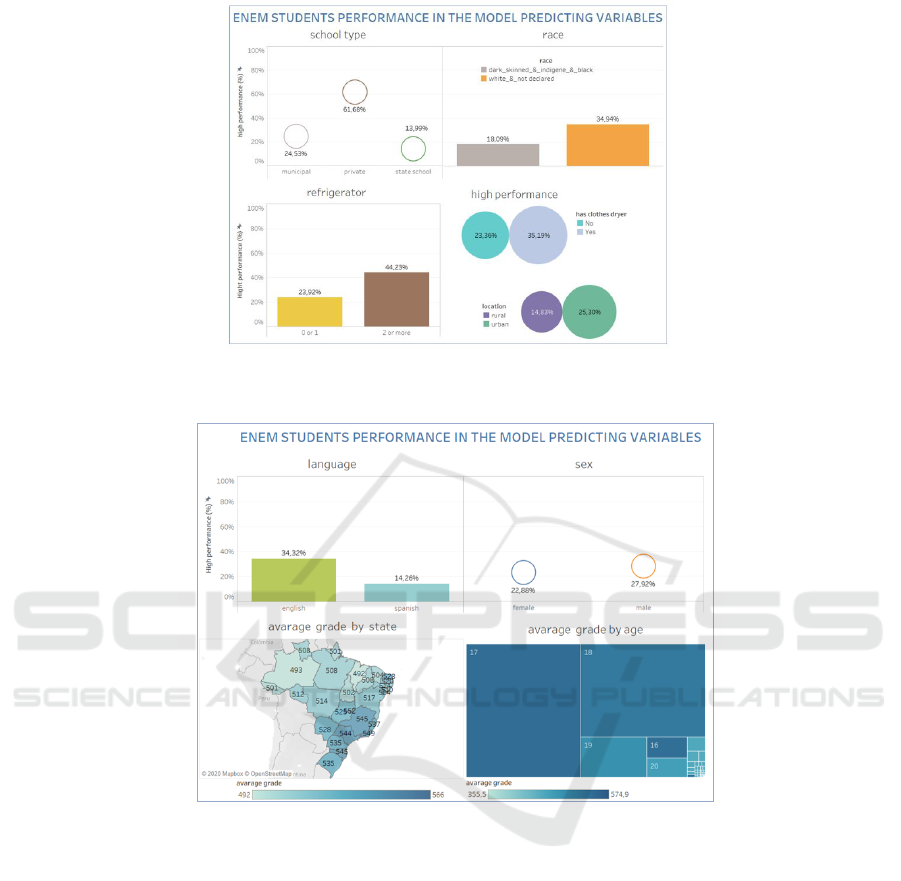
Figure 2: Panel presenting the features referring to the students’ school type, their race, if they own a refrigerator, if they own
a clothes dryer, and where their school is located.
Figure 3: Panel presenting the features referring to the students’ chosen foreign language, their genre, and also the average
final grade by state and by age.
4.4 Model Evaluation
After creating the model, we measured its predictive
ability to evaluate how it performs in the develop-
ment and test samples. Moreover, to assess both the
model’s robustness and whether it can be applied in
other instances of the problem, we applied the model
on the data collected from the ENEM exam of 2017.
We used two samples from 2017, one which was bal-
anced, with 100, 875 students, and another which was
unbalanced, with 101.203 students, using the same
criteria of the sample made for the year of 2018, as
described in Subsection 4.1.
For evaluation metrics, we used the Kolmogorov-
Smirnov (KS) test for two independent features, and
also other measures like accuracy and Receiver Op-
erating Characteristics (ROC) curve (Siddiqi, 2012).
The results of our experiments are presented in Ta-
ble 3. We achieved a KS higher than 40% and an
accuracy higher than 70% in all of our tested sam-
ples, which are satisfactory results according to spe-
cialists (Selau and Ribeiro, 2009). The Area Under
the Curve (AUC), calculated based on the ROC curve,
presented a measure higher than 0.7 in all samples,
which is also considered acceptable (Sicsu, 2010).
These results allow us to infer that the model has good
predictive capabilities, being able to predict which
students will achieve high performance on the exam.
Moreover, our results showed evidence that the model
can be applied to data from different years of the exam
without losing performance.
CSEDU 2021 - 13th International Conference on Computer Supported Education
98

Table 3: Performance of the model in different samples.
Sample KS Accuracy ROC
2018 Analysis 46.6% 73.1% 80.0%
2018 Test 43.5% 73.4% 80.1%
Balanced 2017 Test 46.2% 73.0% 79.9%
Unbalanced 2017 Test 46.3% 76.2% 80.0%
5 CONCLUSIONS
This paper presents an application of EDM to pre-
dict students’ performance on the ENEM exam.
Through the evaluated data, the proposed model
showed promising results in predicting the student’s
performance on the exam. The final model allows us
to infer which features enhance students’ probability
of being in the high-performing group in the ENEM
exam results. With this, we are able to observe that
students who, e.g., are a white male, studied in a pri-
vate school, did not study in a rural area, amongst a
few other features, are more likely to achieve a better
score on the exam.
This way, educational managers can use the pro-
posed model to identify students who are more likely
to not achieve a desirable performance on the test with
minimal effort, just applying the logistic regression
formula with the weights assigned by the model. The
model can alert teachers about the students’ possible
difficulties before the exam is taken. Moreover, it also
allows a deeper understanding of which portion of the
population belongs to this group, thus encouraging
new public policies to minimize the inequalities.
During data analysis, we can see that many fea-
tures are quite correlated to each other. For future
work, we intend to analyze how they relate by ex-
ploring different mining techniques, such as Decision
Trees. Thus, we will evaluate those relations creat-
ing new features and measuring their impact on the
model. Since our main goal is to assist educational
managers in identifying students who will not achieve
high performance in the exam, we also intend to cre-
ate an easy-to-use calculator with the model’s results,
explaining how anyone could compute the model.
ACKNOWLEDGEMENTS
The results of this work were achieved in cooperation
with Hewlett Packard Brasil LTDA. using incentives
of Brazilian Informatics Law (Law n
o
8.2.48 of 1991).
This work was financed in part by the Coordenac¸
˜
ao
de Aperfeic¸oamento de Pessoal de NivelSuperior –
Brasil (CAPES) – Finance Code 001.
REFERENCES
Akoglu, H. (2018). User’s guide to correlation coefficients.
Turkish journal of emergency medicine, 18(3):91–93.
Elsevier.
de Castro Rodrigues, D., de Lima, M. D., da Conceic¸
˜
ao,
M. D., de Siqueira, V. S., and Barbosa, R. M. (2019).
A data mining approach applied to the high school na-
tional examination: Analysis of aspects of candidates
to brazilian universities. In EPIA Conference on Arti-
ficial Intelligence, pages 3–14. Springer.
Ferreira, F. H. and Gignoux, J. (2008). The measurement of
inequality of opportunity: Theory and an application
to Latin America. The World Bank.
Gomes, C., Amantes, A., and Jelihovschi, E. (2020). Apply-
ing the regression tree method to predict student’ sci-
ence achievement. Trends in Psychology. doi, 109788.
Gonz
´
alez-Marcos, A., Olarte-Valent
´
ın, R., Mer
´
e, J. B. O.,
and Alba-El
´
ıas, F. (2019). Predicting students’ perfor-
mance in a virtual experience for project management
learning. In CSEDU (1), pages 665–673.
Hair, J. F., Black, W. C., Babin, B. J., Anderson, R. E.,
and Tatham, R. L. (2006). Multivariate data analysis,
volume 87. Prentice hall Upper Saddle River, NJ, 6th
edition.
Hosmer, D. W. and Lemeshow, S. (2000). Applied logistic
regression. Wiley, 2nd edition.
Jaeschke, R., Guyatt, G., Shannon, H., Walter, S., Cook,
D., and Heddle, N. (1995). Basic statistics for clini-
cians: 3. assessing the effects of treatment: measures
of association. CMAJ: Canadian Medical Association
Journal, 152(3):351.
Jha, N. I., Ghergulescu, I., and Moldovan, A.-N. (2019).
Oulad mooc dropout and result prediction using en-
semble, deep learning and regression techniques. In
CSEDU (2), pages 154–164.
Kornrich, S. and Furstenberg, F. (2013). Investing in
children: Changes in parental spending on children,
1972–2007. Demography, 50(1):1–23. Springer.
Lewis, E. M. (1992). An introduction to credit scoring. Fair,
Isaac and Company.
Macfadyen, L. P. and Dawson, S. (2010). Mining LMS
data to develop an “early warning system” for edu-
cators: A proof of concept. Computers & Education,
54(02):588–599. Elsevier.
Selau, L. P. R. and Ribeiro, J. L. D. (2009). Uma sistem
´
atica
para construc¸
˜
ao e escolha de modelos de previs
˜
ao de
risco de cr
´
edito. Gest
˜
ao e produc¸
˜
ao, 16:398–413.
Sicsu, A. L. (2010). Credit Scoring: desenvolvimento,
implantac¸
˜
ao, acompanhamento. Blucher.
Siddiqi, N. (2012). Credit risk scorecards: developing
and implementing intelligent credit scoring, volume 3.
John Wiley & Sons.
Stearns, B., Rangel, F. M., Rangel, F., de Faria, F. F.,
Oliveira, J., and Ramos, A. A. d. S. (2017). Scholar
performance prediction using boosted regression trees
techniques. In ESANN.
Data Mining on the Prediction of Student’s Performance at the High School National Examination
99
