
A Holistic Machine Learning-based Autoscaling Approach for
Microservice Applications
Alireza Goli
1 a
, Nima Mahmoudi
1 b
, Hamzeh Khazaei
2 c
and Omid Ardakanian
1 d
1
University of Alberta, Edmonton, AB, Canada
2
York University, Toronto, ON, Canada
Keywords:
Autoscaling, Microservices, Performance, Machine Learning.
Abstract:
Microservice architecture is the mainstream pattern for developing large-scale cloud applications as it allows
for scaling application components on demand and independently. By designing and utilizing autoscalers for
microservice applications, it is possible to improve their availability and reduce the cost when the traffic load
is low. In this paper, we propose a novel predictive autoscaling approach for microservice applications which
leverages machine learning models to predict the number of required replicas for each microservice and the
effect of scaling a microservice on other microservices under a given workload. Our experimental results show
that the proposed approach in this work offers better performance in terms of response time and throughput
than HPA, the state-of-the-art autoscaler in the industry, and it takes fewer actions to maintain a desirable
performance and quality of service level for the target application.
1 INTRODUCTION
Microservice is the most promising architecture for
developing modern large-scale cloud software sys-
tems (Dragoni et al., 2017). It has emerged through
the common patterns adopted by big tech companies
to address similar problems, such as scalability and
changeability, and to meet business objectives such as
reducing time to market and introducing new features
and products at a faster pace (Nadareishvili et al.,
2016). Traditional software architectures, such as
monolithic architecture, are not capable of accommo-
dating these needs efficiently (Dragoni et al., 2017).
Companies like SoundCloud, LinkedIn, Netflix, and
Spotify have adopted the microservice architecture in
their organization in recent years and reported success
stories of using it to meet their non-functional require-
ments (Calc¸ado, 2014; Ihde and Parikh, 2015; Mauro,
2015; Nadareishvili et al., 2016).
In the microservice paradigm, the application
is divided into a set of small and loosely-coupled
services that communicate with each other through
a message-based protocol. Microservices are au-
a
https://orcid.org/0000-0002-0376-9750
b
https://orcid.org/0000-0002-2592-9559
c
https://orcid.org/0000-0001-5439-8024
d
https://orcid.org/0000-0002-6711-5502
tonomous components which can be deployed and
scaled independently.
One of the key features of the microservice archi-
tecture is autoscaling. It enables the application to
handle an unexpected demand growth and continue
working under pressure by increasing the system ca-
pacity. While different approaches have been pro-
posed in the literature for autoscaling of cloud ap-
plications (Kubernetes, 2020; Fernandez et al., 2014;
Kwan et al., 2019; Lorido-Botran et al., 2014; Qu
et al., 2018), most related work is not tailored for the
microservice architecture (Qu et al., 2018). This is be-
cause a holistic view of the microservice application
is not incorporated in most related work; hence each
service in the application is scaled separately with-
out considering the impact this scaling could have on
other services. To remedy the shortcoming of existing
solutions, a more effective and intelligent autoscaler
can be designed for microservice applications, a di-
rection we pursue in this paper.
We introduce Waterfall autoscaling (hereafter re-
ferred to as Waterfall for short), a novel approach
to autoscaling microservice applications. Waterfall
takes advantage of machine learning techniques to
model the behaviour of each microservice under dif-
ferent load intensities and the effect of services on
one another. Specifically, it predicts the number of re-
quired replicas for each service to handle a given load
190
Goli, A., Mahmoudi, N., Khazaei, H. and Ardakanian, O.
A Holistic Machine Learning-based Autoscaling Approach for Microservice Applications.
DOI: 10.5220/0010407701900198
In Proceedings of the 11th International Conference on Cloud Computing and Services Science (CLOSER 2021), pages 190-198
ISBN: 978-989-758-510-4
Copyright
c
2021 by SCITEPRESS – Science and Technology Publications, Lda. All rights reserved

and the potential impact of scaling a service on other
services. This way, Waterfall avoids shifting load or
possible bottlenecks to other services and takes fewer
actions to maintain the application performance and
quality of service metrics at a satisfactory level. The
main contributions of our work are as follows:
• We introduce data-driven performance models for
describing the behaviour of microservices and
their mutual impacts in microservice applications.
• Using these models, we design Waterfall which is
a novel autoscaler for microservice applications.
• We evaluate the efficacy of the proposed au-
toscaling approach using Teastore, a reference
microservice application, and compare it with a
state-of-the-art autoscaler used in the industry.
2 RELATED WORK
The autoscalers can be categorized based on differ-
ent aspects from the underlying technique to the de-
cision making paradigm (e.g., proactive or reactive)
and the scaling method (e.g., horizontal, vertical, or
hybrid) (Qu et al., 2018). Based on the underly-
ing technique, autoscalers can be classified into five
categories: rule-based methods, application profiling
methods, analytical modelling methods, and machine
learning-based methods.
Application profiling methods measure the appli-
cation capacity with a variety of configurations and
workloads and use this knowledge to determine the
suitable scaling plan for a given workload and con-
figuration. For instance, Fernandez et al. (Fernandez
et al., 2014) proposed a cost-effective autoscaling ap-
proach for single-tier web applications using hetero-
geneous Spot instances (Amazon, 2020). They used
application profiling to measure the processing capac-
ity of the target application on different types of Spot
instances for generating economical scaling policies
with a combination of on-demand and Spot instances.
In autoscalers with analytical modelling, a mathe-
matical model of the system is used for resource esti-
mation. Queuing models are the most common ana-
lytical models used for performance modelling of ap-
plications in the cloud. In applications with more than
one component, such as microservice applications, a
network of queues is usually considered to model the
system. Gias et al. (Gias et al., 2019) proposed a hy-
brid (horizontal+vertical) autoscaler for microservice
applications based on a layered queueing network
model (LQN) named ATOM. ATOM uses a genetic
algorithm in a time-bounded search to find the opti-
mal scaling strategy. The downside of modelling mi-
croservice applications with queuing network models
is that finding the optimal solution for scaling is com-
putationally expensive. Moreover, in queueing mod-
els, measuring the parameters such as service time
and request mix is non-trivial and demands a complex
monitoring system (Qu et al., 2018).
Search-based optimization methods use a meta-
heuristic algorithm to search the state space of system
configuration for finding the optimal scaling decision.
Chen et al. (Chen and Bahsoon, 2015) leveraged a
multi-objective ant colony optimization algorithm to
optimize the scaling decision for a single-tier cloud
application with respect to multiple objectives.
Machine learning-based autoscalers leverage ma-
chine learning models to predict the application per-
formance and estimate the required resources for dif-
ferent workloads. Wajahat et al. (Wajahat et al., 2019)
proposed a regression-based autoscaler for autoscal-
ing of single-tier applications. They considered a set
of monitored metrics to predict the response time of
the application, and based on predictions, they in-
creased or decreased the number of virtual machines
assigned to the application on OpenStack. More-
over, machine learning has been used for workload
prediction in proactive autoscaling. These methods
use time series forecasting models to predict the fu-
ture workload and provision the resources ahead of
time based on the prediction for the future workload.
Coulson et al. (Coulson et al., 2020) used a stacked
LSTM (Hochreiter and Schmidhuber, 1997) model to
predict the composition of the next requests and scale
each service in the application accordingly. Abdul-
lah et al (Abdullah et al., 2020) introduced a proac-
tive autoscaling method for microservices in fog com-
puting micro data centers. They predict the incom-
ing workload with a regression model using different
window sizes and identify the number of containers
required for each microservice separately. The main
problem with these methods is that they can lead to
dramatic overprovisioning or underprovisioning of re-
sources (Qu et al., 2018) owing to the uncertainty of
workload arrivals, especially in the news feed and so-
cial network applications.
3 MOTIVATING SCENARIO
Consider the interaction between three services in
an example microservice application depicted in Fig-
ure 1. Service 1 calls Service 2 and Service 3 to com-
plete some tasks. If Service 1 is under heavy load
(R1), scaling Service 1 would cause an increase in the
load observed by Service 2 (R2) and Service 3 (R3).
If we predict how scaling Service 1 degrades the per-
A Holistic Machine Learning-based Autoscaling Approach for Microservice Applications
191

Service 3
Service 1
Service 2
R1
R2
R3
Figure 1: Interaction of services in an example microservice
application.
formance of Service 2 and Service 3, we can avoid
the shift in the load and a possible bottleneck from
Service 1 to Service 2 and Service 3 by scaling Ser-
vice 2 and Service 3 proactively at the same time as
Service 1.
To further examine the cascading effect of scal-
ing a service in a microservice application on other
services, we conducted an experiment using an ex-
ample microservice application called Teastore (von
Kistowski et al., 2018). Teastore
1
is an emulated on-
line store for tea and tea-related products. It is a
reference microservice application developed by the
performance engineering community to provide re-
searchers with a standard microservice application
that can be used for testing and evaluating research in
different areas such as performance modelling, cloud
resource management, and energy efficiency analy-
sis (von Kistowski et al., 2018). Figure 6 shows ser-
vices in the Teastore application and the relationships
between them. Teastore includes five primary ser-
vices: Webui, Auth, Persistence, Recommender, and
Image.
As can be seen in Figure 6, depending on the
request type, the Webui service may invoke Image,
Persistence, Auth, and Recommender services. We
generate a workload comprising different types of re-
quests so that Webui service calls all of these four ser-
vices. Keeping the same workload intensity, we in-
creased the number of replicas for the Webui service
from 1 to 5 and monitored the request rate of Webui in
addition to the downstream rate of the Webui service
to other services that each has one replica. For the two
services m and n, we define the request rate of service
m, denoted by RR(m), as the number of requests it re-
ceives per second, and the downstream rate of service
m to service n, denoted by DR(m, n), as the number of
requests service m sends to service n per second. For
instance, in Figure 1, RR(Service 1) is equal to R1 and
DR(Service 1, Service 2) is equal to R2.
Figure 2 shows the results of our experiment. The
left plot and right plot show the request rate and to-
tal downstream rate of the Webui service for different
number of replicas, respectively. Error bars indicate
1
https://github.com/DescartesResearch/TeaStore
Figure 2: Request rate and total downstream rate of We-
bui under the same load intensity for different numbers of
replicas.
the 95% confidence interval. As can be seen, scaling
the Webui service leads to an increase in its request
rate, which in turn increases the downstream rate of
the Webui service to other services. Therefore, under
heavy load, scaling the Webui service increases the
load on the other four services.
The cascading effect of microservices on each
other motivates the idea of having an autoscaler that
takes this effect into account and takes action accord-
ingly. Autoscalers that consider and scale different
services in an application independently are unaware
of this relationship, thereby making premature de-
cisions that could lead to extra scaling actions and
degradation in the quality of service of the applica-
tion. In this work, we introduce a novel autoscaler to
address the deficiencies in these autoscalers.
4 PREDICTING PERFORMANCE
This section presents machine learning models
adopted for performance modelling of microservice
applications. These models are at the core of our au-
toscaler for predicting the performance of each ser-
vice and possible variations in performance as a re-
sult of scaling another service. Hence, we utilize two
machine learning models for each microservice which
are described in the following sections.
4.1 Predictive Model for CPU
Utilization
The CPU Model captures the performance behaviour
of each microservice in a microservice application
in terms of CPU utilization. CPU utilization is a
good proxy for estimating the workload of a microser-
vice (Gotin et al., 2018). Therefore, we use the aver-
age CPU utilization of the microservice replicas as the
performance metric for scaling decisions. Depending
CLOSER 2021 - 11th International Conference on Cloud Computing and Services Science
192
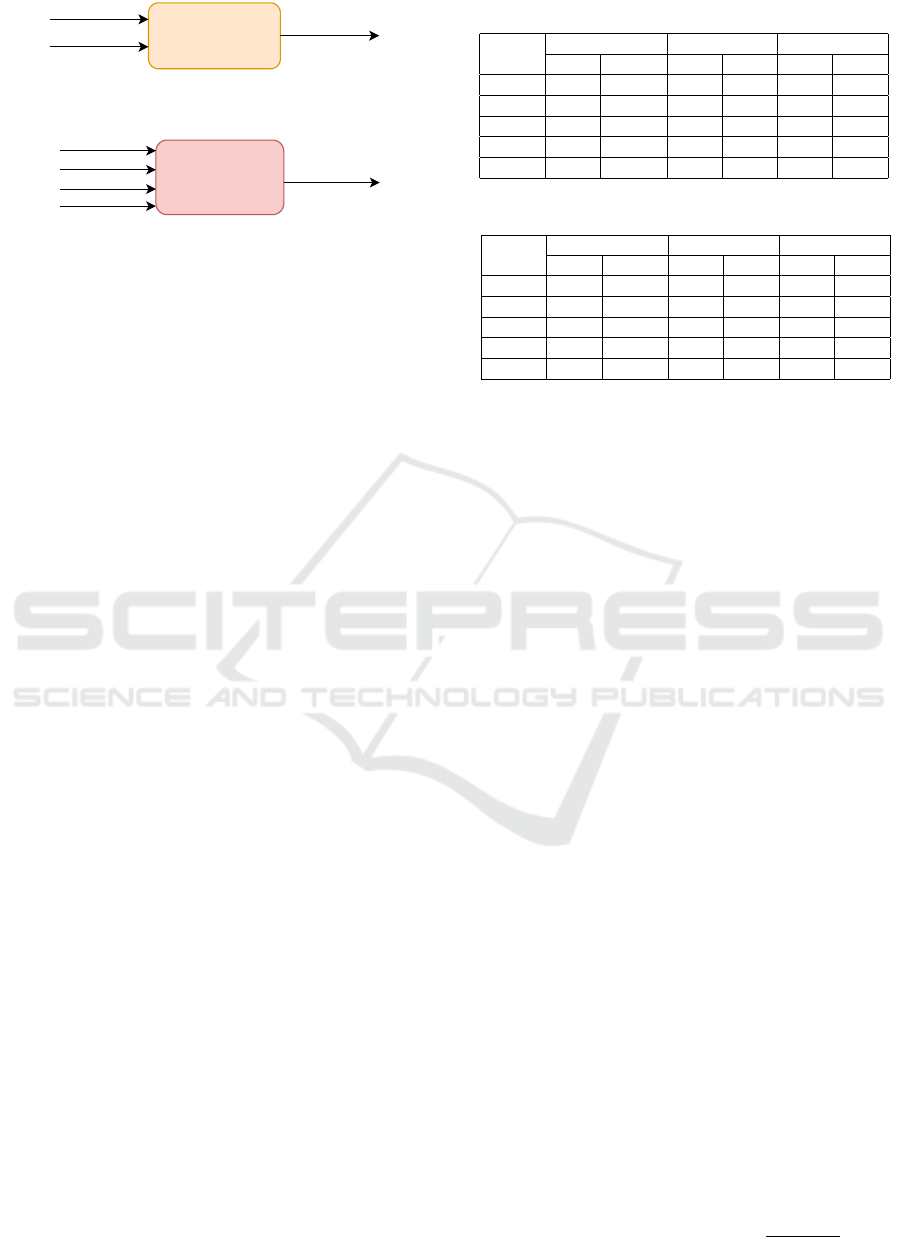
CPU Model
Replica
Request Rate
CPU Utilization
Figure 3: Input features and the predicted value of the CPU
model.
Request Model
Current Replica
New Request Rate
Current Reques Rate
Current CPU Utilization
New Replica
Figure 4: Input features and the predicted value of the re-
quest model.
on the target performance objective, this metric can
be replaced with other metrics, such as response time
and message queue metrics.
As Figure 3 demonstrates, the CPU Model takes
the number of service replicas and the request rate of
service as input features and predicts the service’s av-
erage CPU utilization. In other words, this model can
tell us what would be the average CPU utilization of
service under a specific load.
4.2 Predictive Model for Request Rate
The Request Model predicts the new request rate of
a microservice after scaling and changing the number
of service replicas. As shown in Figure 4, we feed
the current number of service replicas, the current av-
erage CPU utilization of service, the current request
rate of service, and the new number of service replicas
as input features to the Request Model to predict the
new request rate for the service. The current replica,
current CPU utilization, and current request rate de-
scribe the state of the service before scaling. The new
replica and new request rate reflect the state of the ser-
vice after scaling. We use the output of the Request
Model for a given service to calculate the new down-
stream rate of that service to other services. Thus, the
Request Model helps us predict the effect of scaling a
service on other services.
4.3 Model Training Results
We trained CPU Model and Request Model for all mi-
croservices in the Teastore application using datasets
created from collected data. Each dataset was split
into training and validation sets. The training sets
and validation sets contain 80% and 20% of data, re-
spectively. We used Linear Regression, Random For-
est, and Support Vector Regressor algorithms for the
training process and compared them in terms of mean
absolute error (MAE) and R
2
score. Table 1 and Ta-
ble 2 show the results for CPU Model and Request
Model of each microservice, respectively. As can be
Table 1: The accuracy and R
2
score of CPU Model.
Service
Linear Regresson Random Forest SVR
MAE Score MAE Score MAE Score
Webui 4.97 92.21 3.67 96.81 1.43 99.47
Persist 4.12 94.03 3.26 96.31 0.88 99.59
Auth 4.40 94.82 4.26 95.23 1.73 99.11
Recom 2.62 92.94 1.39 97.60 1.38 97.16
Image 3.81 96.87 3.61 96.72 1.54 99.50
Table 2: The accuracy and R
2
score of Request Model.
Service
Linear Regresson Random Forest SVR
MAE Score MAE Score MAE Score
Webui 50.01 97.83 25.67 99.02 32.01 98.70
Persist 71.21 99.50 34.94 99.86 39.36 99.84
Auth 79.23 96.35 47.34 98.74 39.57 98.82
Recom 31.22 94.26 24.49 95.84 20.27 97.17
Image 71.45 98.72 72.48 98.85 42.99 99.43
seen from the results, Support Vector Regressor and
Random Forest provide lower MAE and higher R
2
score for CPU Model and Request Model compared
to Linear Regression.
5 WATERFALL AUTOSCALER
In this section, we present the autoscaler we designed
using the performance models described in Section 4.
We first outline the architecture of Waterfall and dis-
cuss its approach to abstracting the target microser-
vice application. Finally, we elaborate on the algo-
rithm that Waterfall uses to obtain the scaling strategy.
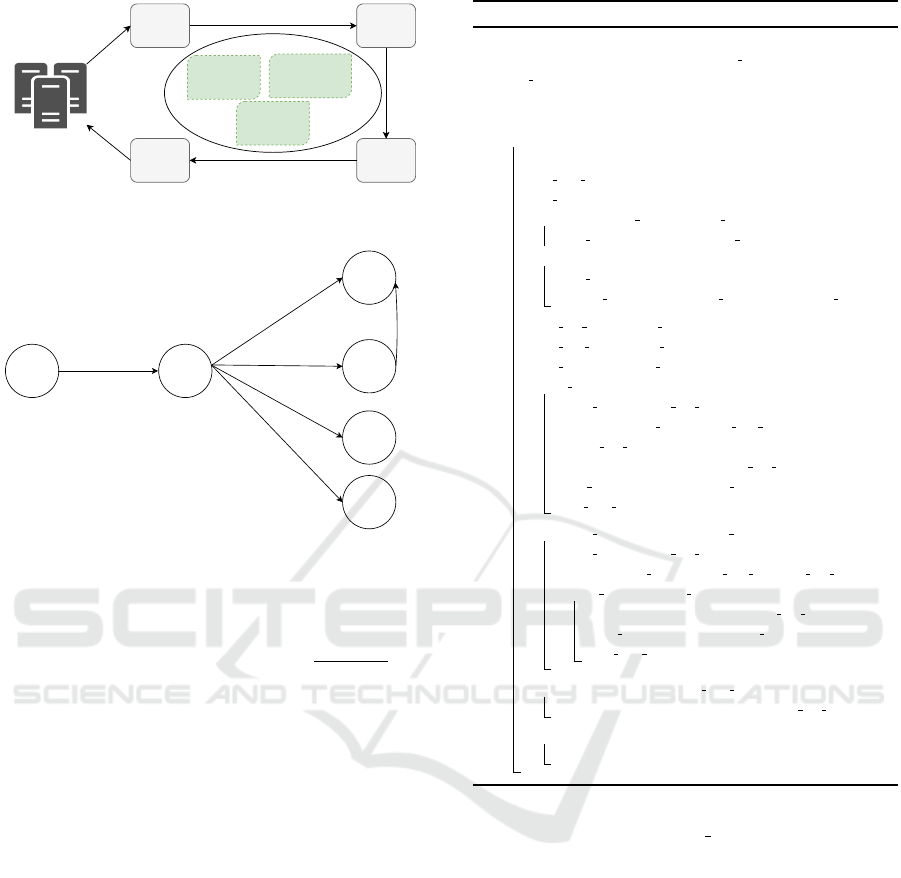
5.1 Architecture and Abstraction
Figure 5 shows the architecture of Waterfall, which
is based on the MAPE-K control loop (Brun et al.,
2009; Kephart et al., 2003; Kephart and Chess, 2003)
with five elements, namely monitor, analysis, plan,
execute, and a shared knowledge base.
Waterfall abstracts the target microservice appli-
cation as a directed graph, which is called microser-
vice graph, hereafter. In the microservice graph,
vertexes represent services, and edges show the de-
pendencies between services. The direction of an
edge determines which service sends request to the
other one. In addition, we assign the following three
weights to each directed edge (m, n) between two mi-
croservices m and n:
• DR(m,n) which is defined in Section 3.
• Request Rate Ratio(m,n) which is defined for
two services m and n as:
Request Rate Ratio(m, n) =
DR(m, n)
RR(n)
(1)
A Holistic Machine Learning-based Autoscaling Approach for Microservice Applications
193
Servers
Monitor
Analysis
Execute
Apply
New Configuration
New Configuration
Get Metrrics
Change
Request
ML Performance
Models
Monitoring Data
Microservice Graph
Plan
Performance Predictions
Metric Data
Figure 5: Architecture of Waterfall autoscaler.
Clients Webui
Persistence
Auth
Image
Recommender
Request Rate Ratio(c,w)
Downstream Rate Ratio(c,w)
DR(w)
Request Rate Ratio(w,p)
Downstream Rate Ratio(w,p)
DR(w,p)
Request Rate Ratio(w,a)
Downstream Rate Ratio(w,a)
DR(w,a)
Request Rate Ratio(w,i)
Downstream Rate Ratio(w,i)
DR(w,i)
Request Rate Ratio(w,r)
Downstream Rate Ratio(w,r)
DR(w,r)
Request Rate Ratio(a,p)
Downstream Rate Ratio(a,p)
DR(a,p)
Figure 6: Teastore microservice graph.
• Downstream Rate Ratio(m,n) which is defined
for two services m and n as:
Downstream Rate Ratio(m, n) =
DR(m, n)
RR(m)
(2)
We calculate these weights for each edge and pop-
ulate the graph using the monitoring data. Figure 6
shows the microservice graph for the Teastore appli-
cation. The microservice graph for small applications
can be derived manually according to service depen-
dencies. There are also tools (Ma et al., 2018) for
extracting the microservice graph automatically.
5.2 Scaling Algorithm
Our proposed algorithm for autoscaling of microser-
vices leverages machine learning models to predict
the number of required replicas for each service and
the impact of scaling a services on the load of other
services. This way, we provide a more responsive au-
toscaler that takes fewer actions to keep the applica-
tion at the desired performance.
At the end of each monitoring interval, Water-
fall initializes the microservice graph weights using
monitoring data and runs the scaling algorithm to
find the new scaling configuration. The steps in the
Waterfall scaling algorithm are summarized in Algo-
rithm 1. The algorithm takes the microservice graph,
start node, and monitoring data as input and provides
Algorithm 1: Autoscaling Algorithm.
Input: Microservice Graph G, Start Node S, Monitoring Data M
Output: New Scaling Configuration New Config
1 New Con f ig ←− initilize with current config
2 queue ←− []
3 queue.append(S)
4 while queue is not empty do
5 service ←− queue.pop(0)
6 req rate updated ←− False
7 req rate ←− getReqRate(G, service)
8 if M[service][
0
Req Rate
0
] == req rate then
9 cpu util ←− M[service][
0
CPU Util
0
]
10 else
11 cpu util ←−
CPU Model(service, new con f ig[service], req rate)
12 curr req rate ←− req rate
13 curr cpu util ←− cpu util
14 curr replica ←− new con f ig[service]
15 if cpu util >= T HRESH then
16 (new replica, pred req rate) ←−
scaleOut(curr replica, curr cpu util,
curr req rate)
17 updateReqRate(G, service, pred req rate)
18 new con f ig[service] ←− new replica
19 req rate updated ←− True
20 else if cpu util < T HRESH ∧curr replica > 1 then
21 (new replica, pred req rate) ←−
scaleIn(curr replica, curr cpu util, curr req rate)
22 if new replica 6= curr replica then
23 updateReqRate(G, service, pred req rate)
24 new con f ig[service] ←− new replica
25 req rate updated ←− True
26 if G[service].hasChild() ∧ req rate updated then
27 updateDownstreamRate(G, service, pred req rate)
28 for each v ∈ G[service].ad jacent() do
29 queue.append(v)
the new scaling configuration as the output. In the be-
ginning, it initializes the New Con f ig with the current
configuration of the system using monitoring data and
starts finding the new configuration.
It traverses the microservice graph using the
Breadth-First Search (BFS) algorithm and starts the
search from the start node. The start node is usually
the front-end service, which is the users’ interaction
point with the application. At each node, the algo-
rithm checks whether the CPU utilization of the ser-
vice is above or below the target threshold and scales
out or scales in the service accordingly.
6 EXPERIMENTAL EVALUATION
In this section, we evaluate the performance of Wa-
terfall autoscaler by comparing Waterfall with HPA,
which is the de facto standard for autoscaling in the
CLOSER 2021 - 11th International Conference on Cloud Computing and Services Science
194

Algorithm 2: Scale Out and Scale In Functions.
1 Function scaleOut(curr replica, curr cpu util, curr req rate):
2 new replica ←− curr replica
3 pred cpu util ←− curr cpu util
4 while pred cpu util > T HRESH do
5 new replica ←− new replica + 1
6 pred req rate ←−
Request Model(service, curr replica,
curr cpu util, curr req rate, new replica)
7 pred cpu util ←− CPU Model(service, new replica,
pred req rate)
8 return (new replica, pred req rate)
9 Function scaleIn(curr replica, curr cpu util, curr req rate):
10 new replica ←− curr replica
11 pred cpu util ←− curr cpu util
12 while pred cpu util < T HRESH do
13 new replica ←− new replica − 1
14 pred req rate ←−
Request Model(service, curr replica,
curr cpu util, curr req rate, new replica)
15 pred cpu util ←− CPU Model(service, new replica,
pred req rate)
16 if pred cpu util < T HRESH then
17 new req rate ←− pred req rate
18 return (new replica + 1, new req rate)
Algorithm 3: Microservice Graph Helper Func-
tions.
1 Function getReqRate(Microservice Graph G, Node service):
2 req rate ←− 0
3 for each (m, n) ∈ G do
4 if n == service then
5 req rate ←− req rate + G[m][n][
0
DR
0
]
6 return req rate
7 Function updateReqRate(Microservice Graph G, Node service,
new req rate):
8 for each (m, n) ∈ G do
9 if n == service then
10 G[m][n][
0
DR
0
] ←−
new req rate ∗ G[m][n][
0
ReqRateRatio
0
]
11 Function updateDownstreamRate(Microservice Graph G,
Node service, new req rate):
12 for each (m, n) ∈ G do
13 if m == service then
14 G[m][n][
0
DR
0
] ←− new req rate ∗
G[m][n][
0
DownstreamRateRatio
0
]
industry. First, we elaborate on the details of our ex-
perimental setup. After that, we present and discuss
our experimental results for the comparison of Water-
fall and HPA in terms of different metrics.
Table 3: Resource request and limit of Teastore services.
Service Name CPU Memory
Webui 1200mCore 512MB
Persist 900mCore 512MB
Auth 900mCore 512MB
Recom 800mCore 512MB
Image 1100mCore 512MB
6.1 Experimental Setup
6.1.1 Microservice Application Deployment
We created a Kubernetes
2
cluster as the container
orchestration system with one master node and
four worker nodes in the Compute Canada Arbutus
Cloud
3
. Each node is a virtual machine with 16 vCPU
and 60GB of memory running Ubuntu 18.04 as the
operating system. We deployed each microservice in
the Teastore application as a Kubernetes deployment
exposed by a Kubernetes service. We imposed con-
straints on the amount of resources available to each
pod. Table 3 shows the details of CPU and memory
configuration for each pod.
6.1.2 Load Generation
We used Jmeter
4
, an open-source tool for load test-
ing of web applications, to generate an increasing
workload with a length of 25 minutes for the Teast-
ore application. This workload is a common browsing
workload that represents the behaviour of most users
when visiting an online shopping store. It follows a
closed workload model and includes actions like vis-
iting the home page, login, adding product to cart, etc.
Jmeter acts like users’ browsers and sends requests se-
quentially to the Teastore front-end service using a set
of threads. The number of threads controls the rate at
which Jmeter sends requests to the front-end service.
We deployed Jmeter on a stand-alone virtual machine
with 16 vCPU and 60GB of memory running Ubuntu
18.04 as the operating system.
6.2 Results and Discussion
To compare the behaviour and effectiveness of Wa-
terfall autoscaler with HPA, we applied the increas-
ing workload described in the previous section to the
front-end service of the Teastore application for 25
minutes. Figures 7-11 show the average CPU utiliza-
tion and replica count for each service in the Teast-
ore application throughout the experiment. The red
2
Kubernetes: https://kubernetes.io/
3
Compute Canada Cloud: https://computecanada.ca/
4
Jmeter: https://jmeter.apache.org/
A Holistic Machine Learning-based Autoscaling Approach for Microservice Applications
195
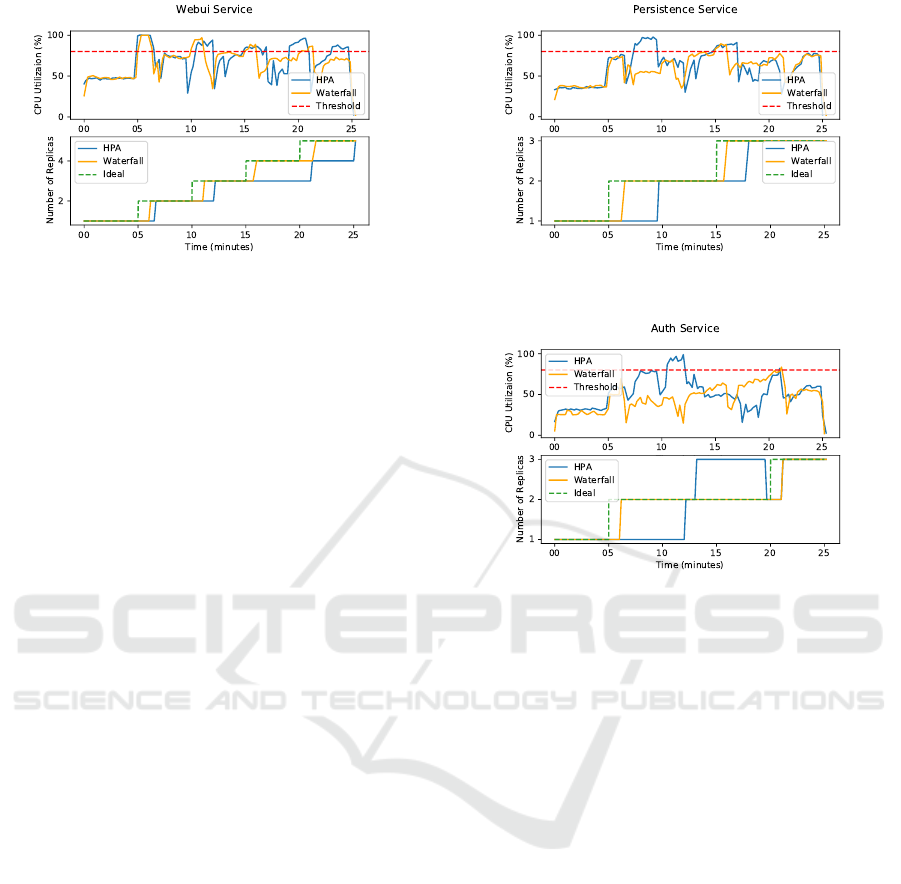
Figure 7: The CPU utilization and number of replicas for
the Webui service.
dashed line in CPU utilization plots denotes the CPU
utilization threshold that both autoscalers use as the
scaling threshold. The green dashed line in each ser-
vice’s replica count plot shows the ideal replica count
for that service at each moment of the experiment.
The ideal replica count is the minimum number of
replicas for the service which is enough to handle the
incoming load and keep the CPU utilization of the
service below the threshold. According to Figures 7-
11, HPA scales a service whenever the service’s aver-
age CPU utilization goes above the scaling threshold.
However, Waterfall scales a service in two different
situations: 1) the CPU utilization of the service goes
beyond the scaling threshold; 2) the predicted CPU
utilization for the service exceeds the threshold due
to scaling of another service.
As Figure 7 shows, for the Webui service, both au-
toscalers increase the replica count when the CPU uti-
lization is above the threshold with some delay com-
pared to the ideal state. According to Figure 6, as
Webui is the front-end service and no other internal
services depend on it, scaling of other services does
not compromise the performance of the Webui ser-
vice. Hence, all Waterfall’s scaling actions for the
Webui service can be attributed to CPU utilization.
As can be seen in Figure 8, we observe that Wa-
terfall scales the Persistence service around the 6
th
minute, although the CPU utilization is below the
threshold. We attribute this scaling action to the deci-
sion for scaling the Webui service in the same mon-
itoring interval that leads to an increase in the CPU
utilization of Persistence service as Webui service de-
pends on Persistence service. In contrast, as we can
see in Figure 8, the HPA does not scale the Persis-
tence service at the 6
th
minute. Consequently, a short
while after the 6
th
minute, when the second replica
of Webui service completes the startup process and is
ready to accept traffic, the CPU utilization of Persis-
tence service increases and goes above the threshold.
The other scaling action of Waterfall for Persistence
Figure 8: The CPU utilization and number of replicas for
the Persistence service.
Figure 9: CPU utilization and number of replicas for Auth
service.
service after the 15
th
minute is based on CPU utiliza-
tion.
Results for the Auth service shown in Figure 9
suggest that the increase in the replica count of Auth
around the 6
th
minute is based on the prediction for
the impact of scaling of the Webui service, as the
CPU utilization of Auth is below the threshold during
this time. On the other hand, we can see that at 6
th
minute, the HPA does not increase the replica count
for Auth service. Therefore, after adding the second
replica of Webui, the CPU utilization of Auth reaches
the threshold. The other scaling action of Waterfall
for Auth after the 20
th
minute is based on the CPU
utilization.
According to the Image service results in Fig-
ure 10, Waterfall scales the Image service around the
11
th
minute. This scaling action is due to scaling the
Webui service that depends on Image service from
two to three replicas in the same monitoring interval.
However, HPA does not scale the Image service si-
multaneously with Webui causing an increase in the
CPU utilization of the Image service. For Waterfall,
as Figure 10 shows, there is a sudden increase in the
CPU utilization of Image service right before the time
that the second replica of Image service is ready to ac-
cept traffic. This sudden increase in CPU utilization
CLOSER 2021 - 11th International Conference on Cloud Computing and Services Science
196
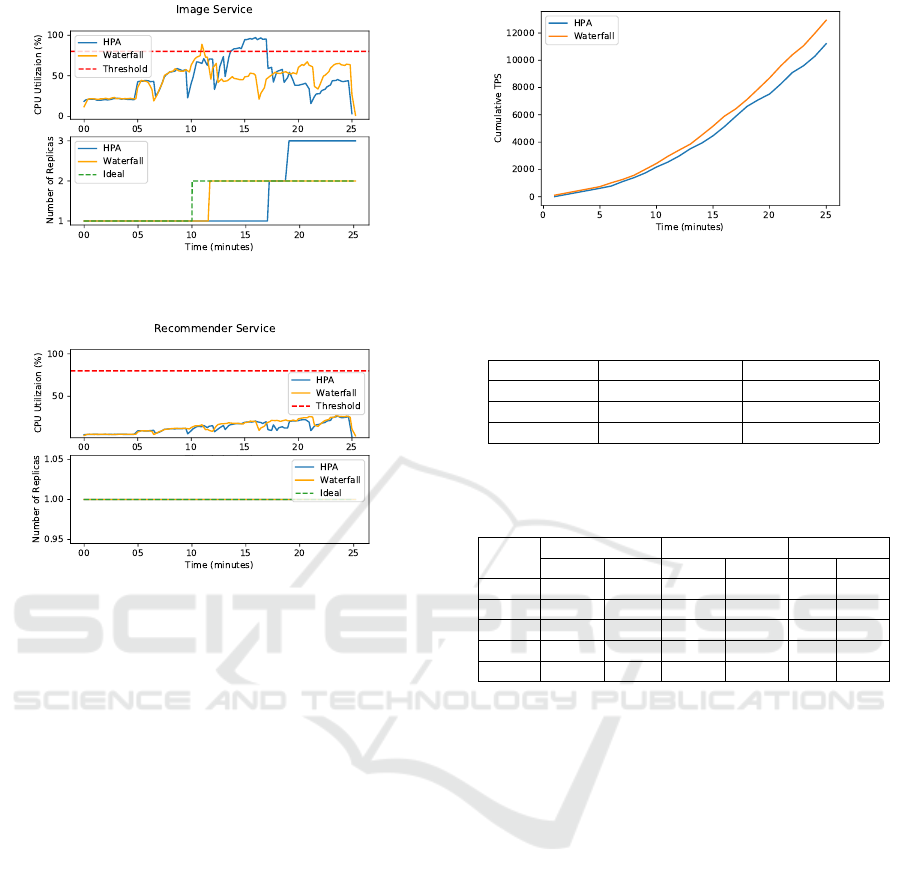
Figure 10: The CPU utilization and number of replicas for
the Image service.
Figure 11: The CPU utilization and number of replicas for
the Recommender service.
of Image service is because of the time difference be-
tween the time that Webui and Image services com-
plete the startup process and reach the ready state.
During the interval between these two incidents, the
Webui service has three replicas; therefore, its down-
stream rate to Image service increases while the sec-
ond replica of the Image service is not ready yet.
For the Recommender service, as Figure 11 illus-
trates, during the whole time of the experiment, the
CPU utilization is below the threshold. Consequently,
there is no scaling action for both autoscalers.
Putting the results of all services together, we can
see that the Waterfall autoscaler predicts the effect of
scaling a service on downstream services and scale
them proactively in one shot if it is necessary. There-
fore, it takes fewer actions to maintain the CPU uti-
lization of the application below the threshold. For
example, around the 6
th
minute, we can see from Fig-
ures 7, 8, and 9 that Waterfall autoscaler scales the
Persistence and Auth services along with Webui in the
same monitoring interval. However, HPA scales these
services separately in different monitoring intervals.
To quantify the effectiveness of Waterfall com-
pared to HPA, we evaluate both autoscalers in terms
of several metrics. Figure 12 shows the total number
of transactions executed per second (TPS) for Water-
Figure 12: Cumulative Transaction Per Second (TPS) of
Waterfall and HPA autoscalers.
Table 4: Comparison of Waterfall and HPA autoscalers in
terms of performance metrics.
# HPA Waterfall
Total Request 727270.0 ± 12369.95 796867.4 ±4594.77
TPS 484.55 ±8.23 530.93 ±3.06
Response Time 20.47 ±0.36 18.67 ±0.11
Table 5: Comparison of Waterfall (WF) and HPA in terms
of CPU>threshold(T), overprovision, and underprovision
time.
Service
CPU >T Underprovision Overprovision
HPA WF HPA WF HPA WF
Webui 31% 16% 54% 15.33% 0% 0%
Persist 16% 4% 28.66% 7.33% 0% 0%
Auth 6.33% 0.33% 32% 8% 26% 0%
Image 13.33% 0.33% 28% 6% 24% 0%
Recom 0% 0% 0% %0 0% 0%
fall and HPA throughout the experiment. It can be
seen that Waterfall has a higher cumulative TPS than
HPA thanks to timely scaling of services.
We repeated the same experiment five times and
calculated the average of the total number of served
requests, TPS, and response time for both autoscalers
over these runs. Table 4 shows the results along with
the 95% confidence interval. It can be seen that TPS
(and the total number of served requests) is 9.57%
higher for Waterfall than HPA. The response time for
Waterfall is also 8.79% lower than HPA.
Additionally, we have calculated CPU>threshold
(T), underprovision, and overprovision time for both
autoscalers and presented them in Table 5. It can be
seen that for all services except the Recommender
service, both autoscalers have a nonzero value for
CPU>T. However, CPU>T is less for Waterfall in
all services. Moreover, Waterfall yields a lower un-
derprovision time and zero overprovision time for all
services. Despite the overprovisioning of HPA for
two services, we observe that Waterfall still provides
a higher TPS and better response time; we attribute
this to the timely and effective scaling of services by
the Waterfall autoscaler.
A Holistic Machine Learning-based Autoscaling Approach for Microservice Applications
197

7 CONCLUSION
We introduced Waterfall, a machine learning-based
autoscaler for microservice applications. While nu-
merous autoscalers consider different microservices
in an application independent of each other, Waterfall
takes into account that scaling a service might have an
impact on other services and can even shift the bottle-
neck from the current service to downstream services.
Predicting this impact and taking the proper action in
a timely manner could improve the application per-
formance as we corroborated in this study. Our eval-
uation results show the efficacy and applicability of
our approach. In future work, we plan to explore the
feasibility of adding vertical scaling to the Waterfall
autoscaling approach.
REFERENCES
Abdullah, M., Iqbal, W., Mahmood, A., Bukhari, F., and
Erradi, A. (2020). Predictive autoscaling of microser-
vices hosted in fog microdata center. IEEE Systems
Journal.
Amazon (2020). Amazon ec2 spot instances. https://aws.
amazon.com/ec2/spot/. Accessed: 2020-10-25.
Brun, Y., Serugendo, G. D. M., Gacek, C., Giese, H.,
Kienle, H., Litoiu, M., M
¨
uller, H., Pezz
`
e, M., and
Shaw, M. (2009). Engineering self-adaptive systems
through feedback loops. In Software engineering for
self-adaptive systems, pages 48–70. Springer.
Calc¸ado, P. (2014). Building products at soundcloud—part
i: Dealing with the monolith. Retrieved from:
https://developers. soundcloud. com/blog/building-
products-at-soundcloud-part-1-dealing-withthe-
monolith. Accessed: 2020-10-25.
Chen, T. and Bahsoon, R. (2015). Self-adaptive trade-
off decision making for autoscaling cloud-based ser-
vices. IEEE Transactions on Services Computing,
10(4):618–632.
Coulson, N. C., Sotiriadis, S., and Bessis, N. (2020).
Adaptive microservice scaling for elastic applications.
IEEE Internet of Things Journal, 7(5):4195–4202.
Dragoni, N., Giallorenzo, S., Lafuente, A. L., Mazzara,
M., Montesi, F., Mustafin, R., and Safina, L. (2017).
Microservices: yesterday, today, and tomorrow. In
Present and ulterior software engineering, pages 195–
216. Springer.
Fernandez, H., Pierre, G., and Kielmann, T. (2014). Au-
toscaling web applications in heterogeneous cloud in-
frastructures. In 2014 IEEE International Conference
on Cloud Engineering, pages 195–204. IEEE.
Gias, A. U., Casale, G., and Woodside, M. (2019).
Atom: Model-driven autoscaling for microservices.
In 2019 IEEE 39th International Conference on Dis-
tributed Computing Systems (ICDCS), pages 1994–
2004. IEEE.
Gotin, M., L
¨
osch, F., Heinrich, R., and Reussner, R.
(2018). Investigating performance metrics for scaling
microservices in cloudiot-environments. In Proceed-
ings of the 2018 ACM/SPEC International Conference
on Performance Engineering, pages 157–167.
Hochreiter, S. and Schmidhuber, J. (1997). Long short-term
memory. Neural computation, 9(8):1735–1780.
Ihde, S. and Parikh, K. (2015). From a mono-
lith to microservices + rest: the evolution of
linkedin’s service architecture. Retrieved from:
https://www.infoq.com/presentations/linkedin-
microservices-urn/. Accessed: 2020-10-25.
Kephart, J., Kephart, J., Chess, D., Boutilier, C., Das, R.,
Kephart, J. O., and Walsh, W. E. (2003). An architec-
tural blueprint for autonomic computing. IBM White
paper, pages 2–10.
Kephart, J. O. and Chess, D. M. (2003). The vision of auto-
nomic computing. Computer, 36(1):41–50.
Kubernetes (2020). Kubernetes hpa. https://kubernetes.io/
docs/tasks/run-application/horizontal-pod-autoscale/.
Accessed: 2020-10-25.
Kwan, A., Wong, J., Jacobsen, H.-A., and Muthusamy, V.
(2019). Hyscale: Hybrid and network scaling of dock-
erized microservices in cloud data centres. In 2019
IEEE 39th International Conference on Distributed
Computing Systems (ICDCS), pages 80–90. IEEE.
Lorido-Botran, T., Miguel-Alonso, J., and Lozano, J. A.
(2014). A review of auto-scaling techniques for elas-
tic applications in cloud environments. Journal of grid
computing, 12(4):559–592.
Ma, S.-P., Fan, C.-Y., Chuang, Y., Lee, W.-T., Lee, S.-J., and
Hsueh, N.-L. (2018). Using service dependency graph
to analyze and test microservices. In 2018 IEEE 42nd
Annual Computer Software and Applications Confer-
ence (COMPSAC), volume 2, pages 81–86. IEEE.
Mauro, T. (2015). Adopting microservices at net-
flix: Lessons for architectural design. Retrieved
from https://www. nginx. com/blog/microservices-at-
netflix-architectural-best-practices. Accessed: 2020-
10-25.
Nadareishvili, I., Mitra, R., McLarty, M., and Amundsen,
M. (2016). Microservice architecture: aligning prin-
ciples, practices, and culture. ” O’Reilly Media, Inc.”.
Qu, C., Calheiros, R. N., and Buyya, R. (2018). Auto-
scaling web applications in clouds: A taxonomy and
survey. ACM Computing Surveys (CSUR), 51(4):1–
33.
von Kistowski, J., Eismann, S., Schmitt, N., Bauer, A.,
Grohmann, J., and Kounev, S. (2018). Teastore: A
micro-service reference application for benchmark-
ing, modeling and resource management research. In
2018 IEEE 26th International Symposium on Mod-
eling, Analysis, and Simulation of Computer and
Telecommunication Systems (MASCOTS), pages 223–
236. IEEE.
Wajahat, M., Karve, A., Kochut, A., and Gandhi, A. (2019).
Mlscale: A machine learning based application-
agnostic autoscaler. Sustainable Computing: Infor-
matics and Systems, 22:287–299.
CLOSER 2021 - 11th International Conference on Cloud Computing and Services Science
198
