
Does Fractal Enterprise Model Fit Operational Decision Making?
Victoria Klyukina
1
, Ilia Bider
1,2
and Erik Perjons
1
1
DSV, Stockholm University, Stockholm, Sweden
2
ICS, Tartu University, Tartu, Estonia
Keywords: Decision-making, Enterprise Modelling, Fractal Enterprise Model, FEM.
Abstract: The paper reports on testing suitability of using a so-called Fractal Enterprise Model (FEM) in operational
decision making. The project in which the testing has been done aimed at identifying areas for cost reduction
improvements in a support department of a European branch of an international high-tech concern. The idea
was to use modeling of the department’s operational activities on the intermediate level of details, just enough
to identify the areas that need attention or provide an opportunity for cost reduction. FEM connects enterprise
business processes with assets that are used in and are managed by these processes. It also allows to split a
process into subprocesses in order to reach an intermediate level of details. The split is done by using a special
type of assets called stock, which, for example, could be a stock of orders or a stock of parts to be used in an
assembly process. The experience from the project shows that the level of details that has been achieved by
using FEM is sufficient to understand the activities being completed by the department and identify possible
ways for improvements. Furthermore, two generic patterns that can help to identify some areas of improve-
ment have been established; these can be used in other projects.
1 INTRODUCTION
1.1 Motivation
According to (Hoverstadt, 2013) modern organiza-
tions have become so complex that no one in the man-
agement of an organization fully understand how it
operates. The paper also states that for Enterprise Ar-
chitecture to be taken seriously, it should provide the
business with models that the management under-
stands. As a model always simplify the reality, the
type of models to be employed depends on the task at
hand. More specifically, it depends on in what type of
decision-making the model should be used, and in
which decision-making phase. For example, a model
that is suitable for a strategy decision, such as sug-
gested in (Hoverstadt & Loh, 2017), might not be
suitable for decision-making related to improvement
of a particular process.
The need to have different models for different
kind of business-related decision-making and their
phases requires understanding of which modelling
techniques are suitable for building models for these
different purposes. There is a range of modelling
techniques used in practice, like IDEF0 (NIST, 1993),
BPMN (OMG, 2013) or ArchiMate (The open group,
2020), each of them focusing on some aspects of an
organization, e.g. processes, resources, goals, while
disregarding others. The decision of which technique
to use is not always easy to make as the priorities of
different stakeholders participating in the decision-
making project may differ. For example, the model-
ers engaged in a project might insist on using a tech-
nique with which they are familiar, even if it might
not constitute the best fit with the modelling purpose.
In theory, a fit can be checked by analysing
whether a modelling technique has concepts im-
portant for a particular type of decision making. How-
ever, if a modelling technique employs high-level ab-
stract concepts, such test might be positive for any
purpose, but it would not guarantee suitability or use-
fulness for a specific purpose. The final test comes
only from using a particular modelling technique in a
real decision-making context. As the saying goes “the
proof of the pudding is in the eating”.
This paper is devoted to answering a particular
question of whether a so-called fractal enterprise
modelling (FEM) technique (Bider et al., 2017) is
suitable for employing in operational decision-mak-
ing. To answer this question, FEM was used in a busi-
ness case that gave an opportunity to test this tech-
nique for the operational decision-making.
Klyukina, V., Bider, I. and Perjons, E.
Does Fractal Enterprise Model Fit Operational Decision Making?.
DOI: 10.5220/0010407306130624
In Proceedings of the 23rd International Conference on Enterprise Information Systems (ICEIS 2021) - Volume 2, pages 613-624
ISBN: 978-989-758-509-8
Copyright
c
2021 by SCITEPRESS – Science and Technology Publications, Lda. All rights reserved
613

At the operational level, decisions are related to a
short-term planning for the implementation of guide-
lines set by the upper planning levels, and they con-
cern the preparation of detailed instructions for oper-
ational execution (Ayora et al., 2015). Models used in
operation research, such as Process Diagrams, Math-
ematical models and Operational models, are focused
on processes as subjects of investigation to capture
relevant activities as detailed as they are needed for a
particular task (Jacobs et al., 2011; Weske, 2007).
In this work, we concentrate on the operational
decisions within the current business model, i.e. deci-
sions that are not connected to changing what, how
and for whom an enterprise creates value. Such oper-
ational decisions may include streamlining business
processes, outsourcing or relocating some parts of the
business operation, introducing more efficient/effec-
tive methods to complete operational activities, in-
cluding changing equipment or software systems.
Note that the operational decision-making includes
various phases, one of which is finding potential areas
where improvement can be made to produce the de-
sirable effect. This work concerns only operational
decision-making related to this phase.
1.2 Project Overview
The project aimed at investigating opportunities for
improvement in an EMEA (i.e. Europe, Middle East
and Africa) branch of an international high-tech busi-
ness concern. The business concern provides test
measurement products and related services to other
high-tech organizations. The project started by a re-
quest from the department director of the internal
Business Support and Services (BSS) department
whose prime responsibility is sales support and man-
aging supply chain activities. The BSS department is
entrusted with the task of relieving sales and service
departments from administrative work. Thereby,
these departments could concentrate on their core
businesses, i.e. increasing sales, and providing effi-
cient high-quality calibration and repair of products.
As a result, BSS completes the activities in business
processes that belong to other departments, while
having no total responsibility for these processes. The
staff of the BSS department is distributed across sev-
eral European countries residing in sales and services
headquarters of these countries.
The background of the request that triggered the
project is the exposure of EMEA branch to a signifi-
cant economic decline that requires adjustment of the
operational cost. Several alternatives to achieve cost
reduction were considered, such as changing respon-
sibility structure or relocating the staff to a lower-
wage country. Our task has been to suggest a set of
alternatives for organizational changes based on mod-
eling of operational activities of the BSS department.
We assumed that modelling of BSS’s operational ac-
tivities on an intermediate level of details would be
reasonable for the task, i.e. sufficient for identifying
opportunities for improvements. More details, which
might be needed for analysis of the opportunities and
implementation of the final decision, could be added
later.
Fractal Enterprise Model (FEM) (Bider et al.,
2017) has a form of a directed graph with two types
of nodes, processes and assets, where the arrows
(edges) from assets to processes show which assets
are used in which processes and arrows from pro-
cesses to assets show which processes help to have
specific assets in "healthy" and working order. The
arrows are labeled with meta-tags that show in what
way a given asset is used, e.g. as workforce, reputa-
tion, infrastructure, etc., or in what way a given pro-
cess helps to have the given assets “in order”, i.e. ac-
quire, maintain or retire.
FEM is aimed at showing the relationships be-
tween business processes through different types of
assets used in the processes. It does not have means
for representing individual activities in the process
and their detailed sequence as is the custom for the
workflow-based notations, e.g. BPMN (OMG, 2013).
Nevertheless, FEM allows to represent a business
process as a set of subprocesses through using a spe-
cial type of assets called stock. A typical stock asset
is a stock of parts that are used in an assembly pro-
cess. Other examples of stock assets are a list of or-
ders or customer complaints that need to be handled.
Hence, a stock asset differs from other types of assets
used in a process in it being depleted by instances
(runs) of the process. Each process instance consumes
one or more entities from the stock, thus the stock
needs to be constantly filled with new entities by
some other business process(es). The latter pro-
cess(es) is connected with the stock asset by a relation
of type acquire. Using acquire-asset-stock chain we
can connect casually related (sub)processes based on
the result from one (sub)process being used in another
(sub)process.
The decomposition of the company’s business
processes into subprocess helped us to identify and
understand subprocesses completed by the BSS de-
partment. In particular, we could identify which par-
ticular subprocesses the BSS department is carrying
ICEIS 2021 - 23rd International Conference on Enterprise Information Systems
614

out within business processes controlled by other de-
partments. These subprocesses could be analyzed
without further decomposing them into individual ac-
tivities.
During the analysis of decompositions, we have
identified two patterns of recurring situations that
points to areas for potential improvement. One pat-
tern is a subprocess that deals exclusively with virtual
information. In such a situation, the members of staff
who handle the subprocess have no explicit connec-
tion to a physical location, as they can do it from any
place on the earth. The handling of the subprocesses
could be moved to another location, and even out-
sourced. This type of situations constitutes our first
pattern for identifying opportunities for organiza-
tional change that might lead to cost reduction im-
provements.
Another pattern that has emerged is a subprocess
that converts a virtual document from one form into
another and includes the usage of a diverse set of IT
tools. This situation gives an indication of interoper-
ability issues that require attention. Either the IT tools
need to be integrated, or a new integrated IT system
should be employed, so that the tasks of manually
moving information from one system into another be-
come automated.
Based on the analysis of detailed FEM model, the
management was presented with a set of potential ar-
eas for improvement, which are currently under con-
sideration. On the whole, our experience of using
FEM for analysis of operational activities to identify
potential areas for improvement could be considered
as positive. We could get the level of detail that is
needed for our purpose without diving too deep in
how the processes are conducted. We have also iden-
tified some patterns of areas for improvement that can
be used in other projects of a similar kind. Based on
the results achieved in the project, we can give a pos-
itive answer to the question posed in Section 1.1 and
in the title of this paper.
The rest of the paper is structured in the following
way. In Section 2, we give an overview of FEM, so
that the reader does not need to look for it in other
works. In addition, we position the project inside a
wider research program, of which the project is a part.
In Section 3, we give an overview of the company and
business activities of the support department. In Sec-
tion 4, we present examples of models that decom-
pose the company’s business processes in subpro-
cesses connected via acquire-asset-stock chains. In
Section 5, we use these models for identifying poten-
tial areas of improvement. In Section 6, we summa-
rize our experience and present lessons learned. In
Section 7, we discuss our findings. Section 8 includes
concluding remarks and areas for future research.
2 BACKGROUND
2.1 Overview of FEM
In this section, we repeat the main principles of build-
ing Fractal Enterprise Models (FEM) already pub-
lished in a number of other works, especially in
(Bider et al., 2017). FEM includes three types of ele-
ments: business processes (more exactly, business
process types), assets, and relationships between
them, see Fig. 1 in which a fragment of a model is
presented. The fragment is related to the business case
analyzed in this paper, and it will be explained in de-
tail later. In this section, Fig. 1 is used for illustrating
the FEM concepts. Note that processes in FEM can
be presented on different levels of granularity. For ex-
ample, on the highest level the whole company can be
presented as one process. In Fig.1, an intermediate
level of granularity has been chosen.
Graphically, a process is represented by an oval,
an asset is represented by a rectangle (box), while a
relationship between a process and an asset is repre-
sented by an arrow. We differentiate two types of re-
lationships in the fractal model. One type represents
a relationship of a process “using” an asset; in this
case, the arrow points from the asset to the process
and has a solid line. The other type represents a rela-
tionship of a process changing the asset; in this case,
the arrow points from the process to the asset and has
a dashed line. These two types of relationships allow
tying up processes and assets in a directed graph.
In FEM, a label inside an oval names the given
process, and a label inside a rectangle names the
given asset. Arrows are also labeled to show the type
of relationships between the processes and assets. A
label on an arrow pointing from an asset to a process
identifies the role the given asset plays in the process,
for example, workforce, and infrastructure. A label
on an arrow pointing from a process to an asset iden-
tifies the way in which the process affects (i.e.
changes) the asset. In FEM, an asset is considered as
a pool of entities capable of playing a given role in a
given process. Labels leading into assets from pro-
cesses reflect the way the pool is affected, for exam-
ple, the label acquire identifies that the process
can/should increase the pool size.
Note that the same asset can be used in multiple
processes playing the same or different roles in them,
Does Fractal Enterprise Model Fit Operational Decision Making?
615
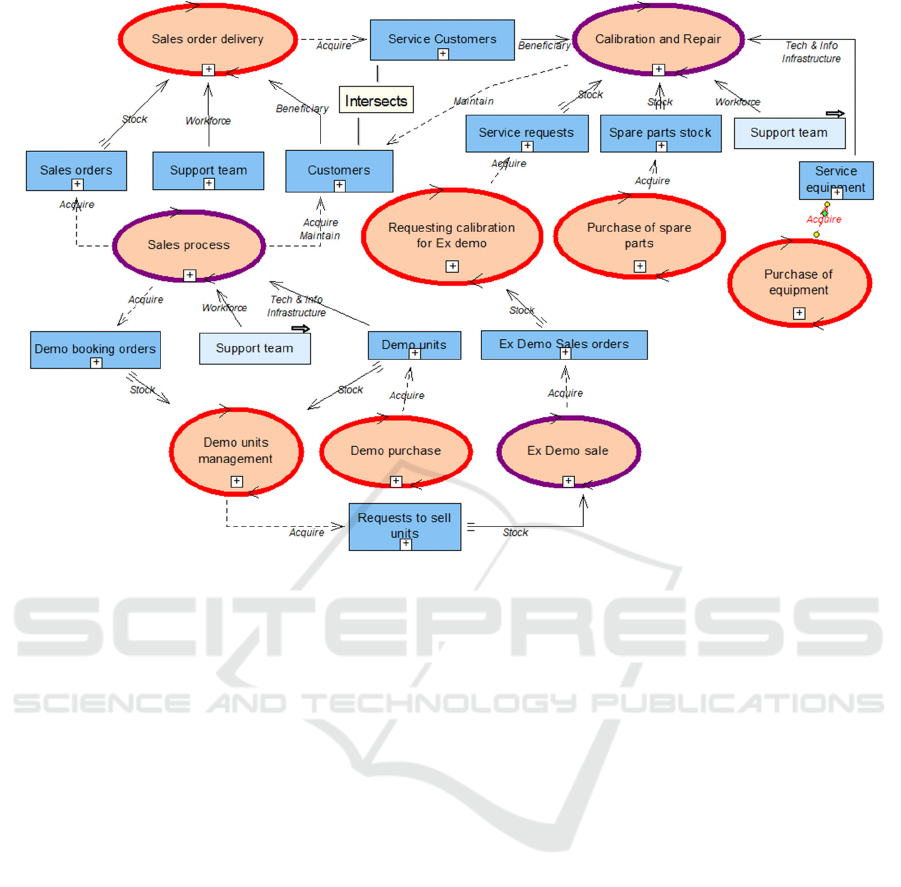
Agenda for border coloring: Red – BSS is responsible for the process; Purple – another department of EMEA is
responsible for the process; Black - a third party is responsible for the process.
Figure 1: A fragment of a FEM for the business case.
which is reflected by labels on the corresponding ar-
rows. It is also possible that the same asset plays mul-
tiple roles in the same process. In this case, several
labels can be placed on the arrow between the asset
and the process. Similarly, a process could affect mul-
tiple assets, each in the same or in different ways,
which is represented by the corresponding labels on
the arrows. Moreover, it is possible that a single pro-
cess affects a single asset in multiple ways, which is
represented by having two or more labels on the cor-
responding arrow.
When there are too many arrows leading to the
same process or asset, several copies can be created
for this process or asset in the diagram. In this case,
the shapes for copies have a bleaker color than the
original, see asset Support team in Fig. 1 that appears
in three places.
In FEM, different styles can be used for shapes to
group together different kinds of processes, assets,
and/or relationships between them. Such styles can
include dashed or double lines, or lines of different
thickness, or colored lines and/or shapes. For exam-
ple, a special start of an arrow notifies that the relation
is of the stock type (see the arrows in Fig. 1). Another
example of styles used in this project, is the color of
borders of processes and assets which identify which
department is responsible for each process and asset.
Labels inside ovals (which represent processes)
and rectangles (which represent assets) are not stand-
ardized. They can be set according to the terminology
accepted in the given domain, or be specific for a
given organization. Labels on arrows (which repre-
sent the relationships between processes and assets)
are standardized. This is done by using a relatively
limited set of abstract relations, such as, workforce or
acquire, which are clarified by the domain- and con-
text-specific labels inside ovals and rectangles. Stand-
ardization improves the understandability of the mod-
els.
While there are a number of types of relationships
that show how an asset is used in a process (see ex-
ample in Fig. 1), there are only three types of relation-
ships that describe how an asset is managed by a pro-
cess – Acquire, Maintain and Retire.
To make the work of building a fractal model
more systematic, FEM uses archetypes (or patterns)
for fragments from which a particular model can be
built. An archetype is a template defined as a frag-
ment of a model where labels inside ovals (processes)
and rectangles (assets) are omitted, but arrows are la-
belled. Instantiating an archetype means putting the
ICEIS 2021 - 23rd International Conference on Enterprise Information Systems
616

fragment inside the model and labelling ovals and
rectangles; it is also possible to add elements absent
in the archetype, or omit some elements that are pre-
sent in the archetype.
FEM has two types of archetypes, process-assets
archetypes and an asset-processes archetype. A pro-
cess-assets archetype represents the kinds of assets
that can be used in a given category of processes. The
asset-processes archetype shows the kinds of pro-
cesses that are aimed at changing the given category
of assets. The whole FEM graph can be built by alter-
native application of these two archetypes in a recur-
sive manner representing self-similar patterns on dif-
ferent scales, fractals. The term fractal in the name of
our modelling technique points to the recursive nature
of the model
Hereby, we finish a short overview of the standard
FEM. The reader who wants to know more about the
model and why it is called fractal are referred to
(Bider et al., 2017) and the later works related to
FEM.
2.2 Research Approach
The research presented in this paper belongs to the
Design Science (DS) paradigm (Hevner et al., 2004;
Bider et al., 2013), which focuses on looking for ge-
neric solutions for problems. These problems could
be known, or unknown. The result of a DS research
project can be a solution of a problem in terminology
of (Bider et al., 2013), or artifact in terminology of
(Hevner et al., 2004); alternatively, the result can be
in form of "negative knowledge" stating that a certain
approach is not appropriate for solving certain kind of
problems (Bider et al., 2013). Note that from the
knowledge acquisition perspective, it does not really
matter whether the answer on the question posed in
the previous section would be positive or negative.
This research is part of a broader undertaking con-
nected to FEM. Initially, FEM has been developed as
a means for finding all or the majority of the processes
that exist in an organization. The result of this re-
search produced more than a solution to the original
problem, as FEM includes not only relations between
the processes, but produces a map of assets usage and
management in the organization. Therefore, it be-
came clear that it would be worthwhile to look for
other problems/challenges that could be solved using
FEM while extending FEM when necessary. One ex-
ample of a specific application of FEM is using FEM
for business model innovation, which belong to the
area of strategic decision-making, see, for example,
(Bider & Perjons, 2018).
From the point of view of classification of DS op-
portunities introduced in (Anderson et al., 2012) and
adopted in (Bider et al., 2013), see Fig. 2, we use ex-
aptation (in terminology of (Anderson et al., 2012))
or transfer (in terminology of (Bider et al., 2013)),
which amounts to extending the known solutions to
new problems, including adapting solutions from the
other fields/domains. According to both (Bider et al.,
2013) and (Anderson et al., 2012), exaptation pro-
vides a research opportunity.
As far as this particular project is concerned, it can
be classified as a practitioner reflections project.
(Mott, 1996). In this project, the authors functioned
as practitioners, i.e. business analysts. The research
conclusions when answering the question from Intro-
duction are based on the reflection from own practice.
Figure 2: The Application Domain Maturity/Solution Ma-
turity matrix adopted from (Anderson et al., 2012).
3 BUSINESS CASE
Our project has been conducted in an international
high-tech business concern. The business concern
produces and sells test measurement equipment to
their clients, most of which are teleoperators or pro-
viders of equipment for teleoperators. The business
concern also provides services related to the test
measurement equipment. There are three major
branches of the global organizations: USA, Asia and
EMEA (Europe/Middle East/Africa). These days,
EMEA, which has been in the center of our investiga-
tion, is challenged by the competitive environment. It
has been exposed to a significant economic decline
and urgently needs a solution that will help retaining
a leading position in the industry. In particular,
the question of how to minimize the operational costs
Does Fractal Enterprise Model Fit Operational Decision Making?
617
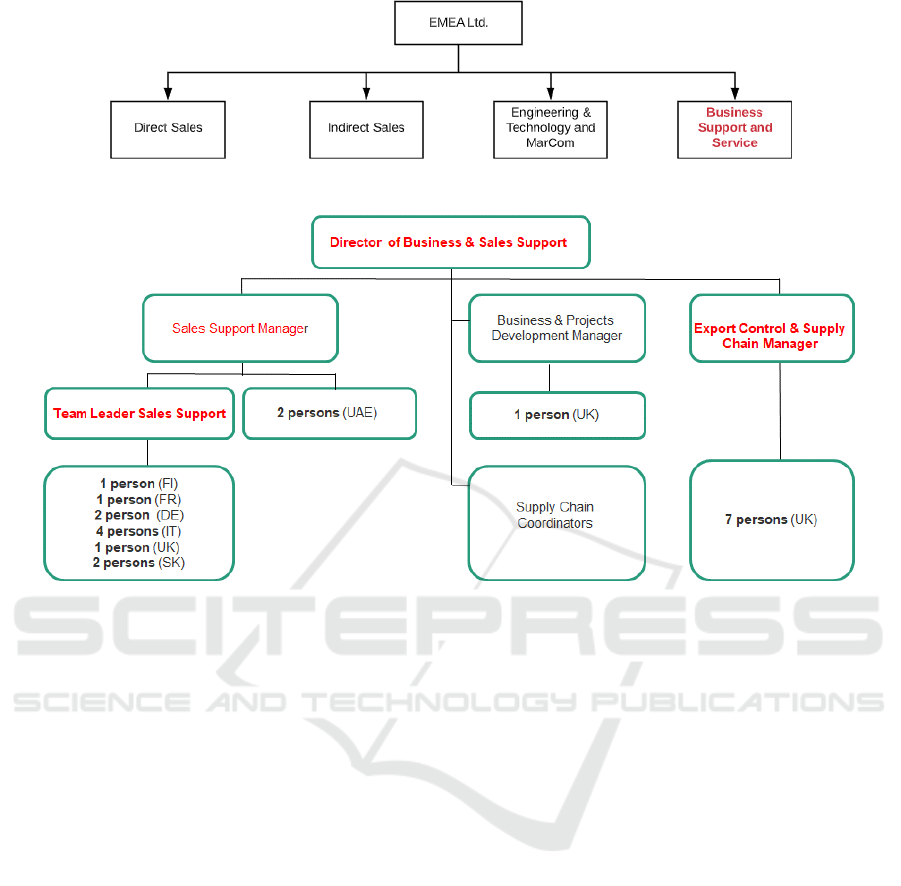
Figure 3: EMEA structure in relation to BSS.
Figure 4: BSS formal organization (from the case documentation).
while maintaining the quality of service of the EMEA
Business Support and Service (BSS) department has
been raised.
The core activities of EMEA related to our project
are presented in the form of four boxes in Fig. 3. The
last box is marked with a red font to highlight activi-
ties that are entrusted to the BSS department, the de-
partment with which we have cooperated during our
project. Some examples of activities included in this
box, according to EMEA documentation, are as fol-
lows:
─ Sales and Service Support. This activity is aimed
at unloading sales staff and technical service per-
sonal from paperwork and other formalities related
to the customer orders for equipment and service.
It ensures that other departments (i.e. the Sales and
the Service departments) can concentrate on their
primary activities, e.g. generating customer orders
or performing service and calibration. This activity
includes Purchasing of products from the factories
(see the next activity) and Customer Support as its
parts.
─ Purchasing. The activity takes care of any purchase
within the company, such as products for custom-
ers, equipment, spare parts, etc. It includes Export
Control and Shipping as its parts.
─ Export Control and Shipping (i.e. Supply Chain).
This activity is aimed at ensuring export and im-
port compliance with the government regulations
and smooth physical movement of products and
equipment between relevant parties, e.g. produc-
tion plants, country offices, customers.
─ Demo and Loan. This activity is aimed at supply-
ing sales with demonstration units of company
products to be tested by customers, and later can
be sold to customer with reduced prices. It includes
paper work and Purchasing and Export Control
and Shipping as its parts.
The formal organization of BSS is presented in Fig.
4, which also shows that the staff of BSS is distributed
through the whole Europe. The red font in Fig 3 iden-
tifies managers with whom we cooperated during the
project.
Considering the range of activities completed by
BSS and their interweaving with the activities of
other departments, choosing what to change and the
scale of changes have become a challenge for the
management team. Our project was started in an at-
tempt to assist their decision-making. Beside the au-
thors of the paper, the BSS director and other key em-
ployees of BSS participated in the project. The latter
included Export Control and Supply Chain manager,
ICEIS 2021 - 23rd International Conference on Enterprise Information Systems
618
Sales Support manager and team leader. The project
lasted over the period of 8 months (September 2019 -
April 2020) and included multiple detailed interviews
with key persons based on which the models of BSS
activities were built.
The goal of the project was to assist the BSS man-
agement with operational decision making by sug-
gesting alternatives for restructuring that might lead
to cost reduction.
4 UNDERSTANDING BSS
ACTIVITIES
4.1 Processes in Which BSS
Participates
Fig. 1 presents a partial model of EMEA business ac-
tivities in which BSS participate. That part includes
two primary processes, that is, processes that deliver
value to customers, Sales order delivery and Calibra-
tion and Repair, and assets that are needed for the
process instances of this processes to run smoothly.
In addition, Fig. 1 features a number of management
processes aimed at having the assets in order. The
most important of these processes is Sales process
that provides Sales order delivery with both new Cus-
tomers and new Sale orders. This process in its own
turn require assets, one of which is Demo units, which
are examples of the company products that can be
borrowed by customers for testing. These need to be
sold after half a year in order to renew the stock of
demo units. This is done by a special sales process
called Ex Demo sale.
Fig.1 uses a special coloring scheme to show for
which processes BSS is responsible. The red border
means that BSS is responsible for the process that has
this border color. The purple border means that some
other EMEA department is responsible for the pro-
cess. The processes in which BSS participate, but
might not be responsible for, are identified by asset
Support team being used in it. As follows from Fig.
1, BSS is responsible for one primary process, Sales
order delivery, and participates in two other im-
portant processes, Calibration and Repair process (a
primary process), and Sales process. Besides, BSS is
responsible for many supporting processes, some of
them being depicted in Fig. 1.
While Fig. 1 provides a good picture of the diver-
sity of tasks completed by BSS it does not provide a
more detailed picture of what BSS does in each pro-
cess and whether the same kind of tasks are present in
many processes in which the BSS staff is engaged on
the daily basis. To better understand these issues, we
have decomposed many of the EMEA business pro-
cess into subprocess. The examples of such decom-
positions will be presented in the next sections.
4.2 Examples of Decomposition of BSS
Processes
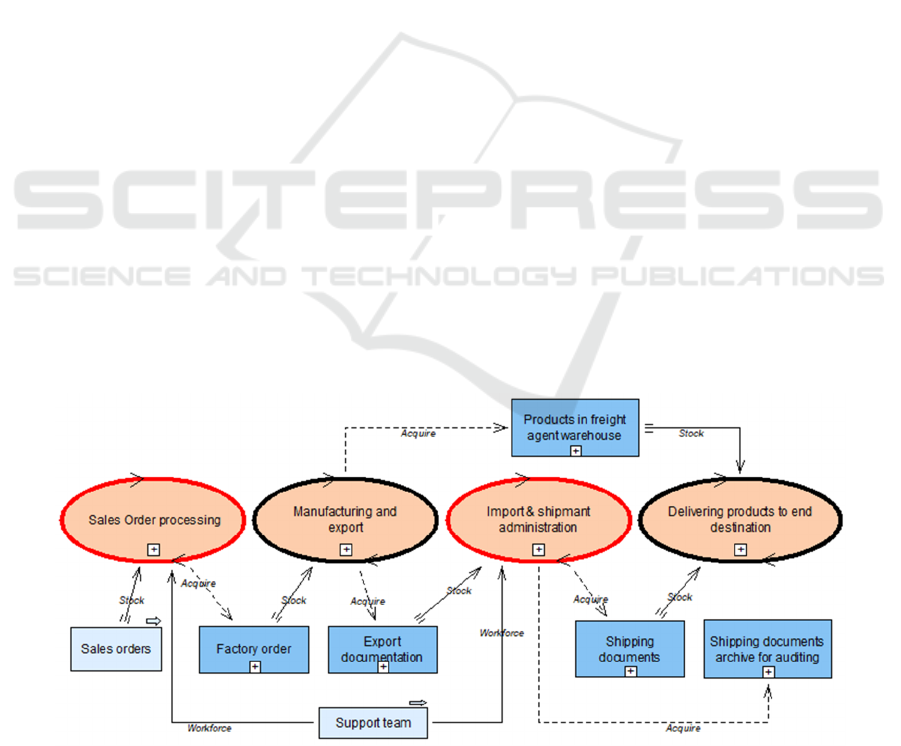
Fig. 5 presents a simplified FEM model of decompo-
sition of business process Sales order delivery from
Fig. 1. Simplification has been made to illustrate the
idea of decomposition without burdening the reader
with too many details. A more detailed model of this
process will be presented in the next section.
Figure 5: Decomposition of Sales order delivery.
Does Fractal Enterprise Model Fit Operational Decision Making?
619
Agenda for border coloring: Red – BSS is responsible for the process; Purple – another department of EMEA is
responsible for the process; Black - a third party is responsible for the process.
Figure 6: Decomposition of Calibration and Repair.
The decomposition features four subprocesses,
two of which are handled by BSS – they have red col-
ored borders, while the other two are handled by par-
ties outside EMEA – they have black colored borders
(see “Agenda for border coloring” in Fig. 1). The sub-
process Manufacturing and export is handled by one
of the factories of the concern, while Delivering prod-
ucts to end destination is handled by a shipping agent.
The connection between the subprocesses is done
through acquire-asset-stock chains. For example,
subprocesses Sales Order processing and Manufac-
turing and export are connected via the asset Factory
order, more precisely via the first subprocess acquir-
ing Factory order that serve as a stock for the second
subprocess.
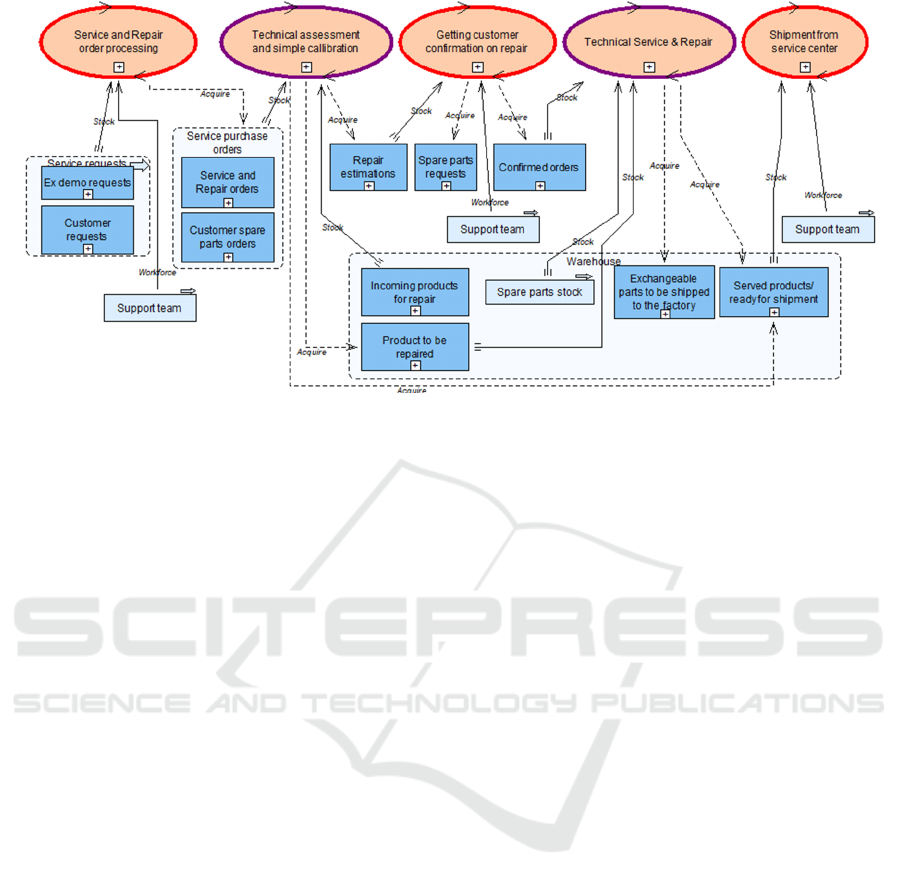
A more complex, but still simplified, model pre-
sented in Fig. 6 decomposes process Calibration and
Repair from Fig. 1. The subprocesses in the model in
Fig. 6 are connected to each other in the same way as
in Fig. 5. In this model subprocesses for which BSS
is responsible (red colored border), are intervened
with the subprocesses for which the EMEA product
service department is responsible which have purple
border coloring.
As we can see from models in Fig. 5 and 6, activ-
ities completed by the BSS team are:
Interwoven with activities completed by others,
i.e. other departments or external partners
Of administrative nature, mostly processing infor-
mation/documents. The larger part of this infor-
mation resides in various IT systems, but it can
also be in the form of PDF documents sent and re-
ceived by email.
5 ANALYZING BSS ACTIVITIES
To better understand the business activities of BSS
and identify the possible areas for improvement, the
models of the type presented in Fig. 5 and 6 were ex-
tended by adding more details. In particular, a more
detailed information on technical and information in-
frastructure has been added to the models. This is il-
lustrated in the example of the enhanced model from
Fig. 5, part of which is presented in Fig. 7.
In Fig. 7, the subprocess Sales order processing is
enriched with the groups of assets belonging to Infor-
mation sources/Databases and IT tools that are used
by the process participants when managing process
instances. By visually representing all systems and in-
formation sources used in the process, Fig. 7 high-
lights the complexity of the process of translating en-
tities from the asset Sales orders into entities of the
asset Factory orders.
Databases and other information sources provide
such information as prices of products and services,
and they also include various types of forms to enable
the transformation of a sales order into a factory or-
der. To such sources belong Customer profile form,
ICEIS 2021 - 23rd International Conference on Enterprise Information Systems
620
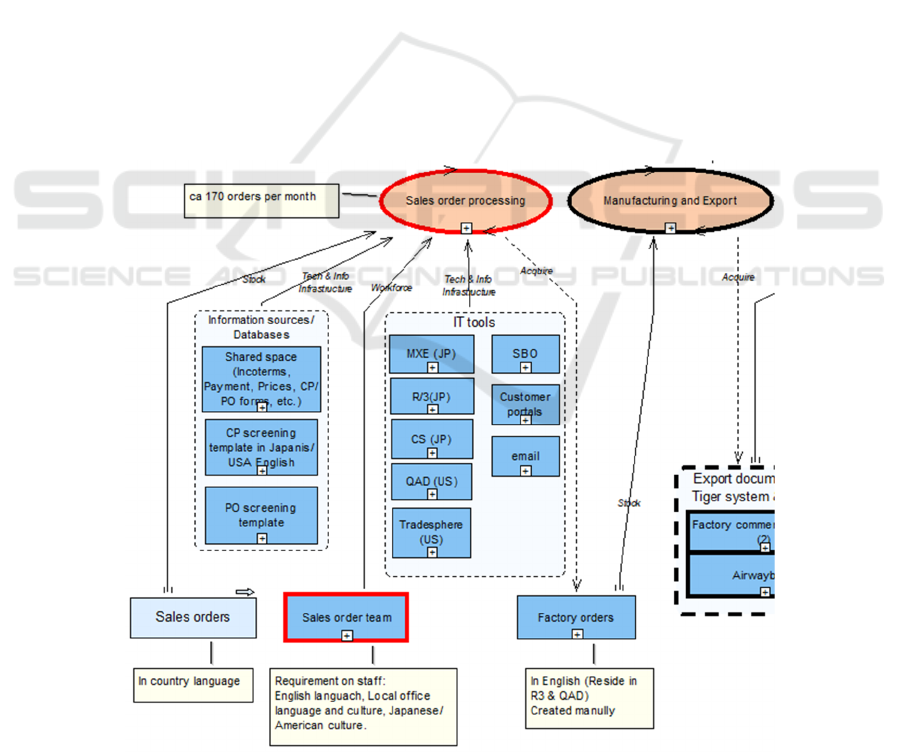
Customer screening form, Purchase order screening
form, Incoterms, Customer credits, Price lists, Quote,
etc. First, all documentation related to a factory order
is created and shared internally using an IT system
called SBO (provided by SAP). Then, these docu-
ments must be shared/uploaded into IT systems used
in a business concern’s production organization, one
of which is situated in Japan and another one in US.
The Japan production uses systems CP, MXE and R3,
and the US production uses systems QAD and
Tradesphere. Besides these systems, email and cus-
tomer portals are often involved in communicating
the information related to a factory order.
The primary cause for complexity of this process
is the employment of multiple disjoint IT systems,
which are not easy to use and which require manually
transferring of information from one system into an-
other. Looking at the model in Fig. 7, it becomes
clearer why the BSS department has been created in
EMEA. Sales people have no time and no desire to
learn and handle all this information sources and IT
systems. They want to concentrate their efforts at get-
ting new orders and new customers, especially, con-
sidering that their salary is based on commission from
sales.
The fragment presented in Fig. 7 is repeated with
some modification in other BSS processes, such as
Purchase of spare parts and Demo purchase from
Fig. 1. To make Sales order processing less complex
something should be done to eliminate manual oper-
ations included in it, especially the ones that consists
of manually moving information from one system
into another. This can be done by integrating systems
employed in the process, in the simplest way by in-
troducing robot integration (e.g. robotic process auto-
mation). An alternative could be acquiring one inte-
grated system which is easy to use. In addition, auto-
mation of some operations, such as translation of the
sales order in a country language into English, could
be considered.
A situation presented in Fig. 7 gave rise to a pat-
tern for potential improvement, which was present in
several BSS processes. This pattern can be defined in
a following manner. If there is a process/subprocess
that:
─ Converts some virtual information/documents
from one form to another without much communi-
cation with the external world,
Figure 7: Part of the enhanced model of Sales order delivery.
Does Fractal Enterprise Model Fit Operational Decision Making?
621

─ And it employs a lot of disjoint IT systems and
other type of tech and information infrastructure,
especially when it is not user friendly and difficult
to handle,
─ And, possibly, it includes manual movement of in-
formation from one system to another,
Then, there is a potential gain to either integrate the
systems, or substantially reduce their number while
automating manual operations, at least partially, dur-
ing this process.
For all BSS processes that fitted this pattern, we
suggested the BSS management to have a closer look
on them and see whether something could be done.
For some of such processes BSS has no control, and
the suggestions would need a decision on the higher
level. For others, BSS could decide on the measures
on their own.
Another pattern that could be derived from Fig. 7
concerns the physical placement of the Sales order
team which is part of the Support team from Fig. 1.
As we can see from the model, they deal with virtual
documents and use IT resources that are available re-
motely. This means that the team can operate from
any location, as long as its members satisfies the re-
quirements listed in the note attached to Sales order
team in Fig. 7.
For all BSS processes that fitted the second pat-
tern, we suggested the BSS management to have a
closer look on them and see whether they would want
to relocate the teams.
6 REFLECTIONS
The following lessons could be drawn from our expe-
rience regarding the usage of FEM in operational de-
cision-making:
1. FEM is an effective tool for understanding activi-
ties performed by a particular business department.
For this purpose, modelling starts with drawing of
a high-level FEM that includes all processes that
the department participates, without showing
much of details, as it is done in Fig. 1. Then, the
processes in which the department participate are
decomposed using acquire-asset-stock chains.
This method is especially suitable for departments
such as BSS, which performed a set of diverse ad-
ministrative activities.
2. Intermediate level of details obtained via FEM
during decomposition seems to be sufficient for
identifying areas that need attention and present
opportunities for improving efficiency or reducing
costs. However, more granulated analysis may be
required for assessing the opportunities, and for
this purpose, a different modeling technique(s)
could be more suitable.
3. FEM is useful for identifying patterns of situations
that require attention and present opportunities for
improvement. Two such patterns have been identi-
fied during the project. One pattern concerns IT in-
tegration/automation. The other one concerns
physical relocation of teams, and, possibly, out-
sourcing. We believe that more patterns can be
identified in the frame of other projects that have a
similar goal to ours.
In the project, we also tested a newly developed tool
for FEM modelling implemented using ADOxx
toolkit (ADOxx.org, 2017), (Bork et al., 2019). Gen-
erally, we were satisfied with the functionality of the
tool but encountered some opportunities for enhance-
ments. In particular, it would be beneficial to subclass
assets and processes according to various dimensions.
For example, assets could be classified in three cate-
gories: tangible, intangible and human. Subclasses
could have different background and/or border colors.
The subclassing needs to be flexible, so that each
modeling project could define its own subclasses and
its own visual way of presenting them. In the version
of the tool we used, it was possible to visualize sub-
classes, but this required manual adjustment of colors
for each asset and/or process.
The subclassing enhancement has been success-
fully introduced in the next version of the tool, and
the tool has been made available for the public
(Fractal Enterprise Model, 2020).
7 DISCUSSION
Summarizing our reflections from Section 6, we can
give a positive answer to the question posed in Intro-
duction of whether FEM is suitable for employing in
operational decision-making. However, we need to
add some limitations on the fitness of FEM for oper-
ational decision-making. Firstly, the use of FEM was
limited to finding areas for potential improvement.
When such area is detected, a more detailed investi-
gation needs to be completed to assess the feasibility
and costs of the suggested change. To what extent
FEM could be useful for such investigation is not
clear at this stage. For example, if a detailed analysis
of the activities involved in the area is required for
decision, then another technique might be more suit-
able.
ICEIS 2021 - 23rd International Conference on Enterprise Information Systems
622

The second limitation concerns a different dimen-
sion of fitness. Besides being suitable for performing
modeling tasks, we need to consider the team engaged
in building the model. In our project, the modelers
where acquainted with FEM, thus the challenge asso-
ciated with learning and applying new tool was not
present in the project. Based on the lessons learned,
we may conclude that for business analysts who have
experience of using FEM, this technique could be
successfully used in operational decision-making.
What other modelling techniques could be used in
the context similar to our project and whether they are
more or less suitable for this task than FEM is an open
question. Answering it is outside the scope of this pa-
per. As we have mentioned in Section 1, answering
such a question usually requires testing of each tech-
nique in a real project. Nevertheless, some presump-
tions can be made based on the logical analysis. For
example, business process modelling techniques,
such as BPMN, may not be suitable, as they are aimed
at depicting details on activities completed and their
ordering, rather than depicting all assets (resources)
used in a process/subprocess. IDEF0 might also be
less suitable than FEM, but in a different way. As it
has been shown in (Bider et al., 2019), there are some
similarities between FEM and IDFE0 which allow
transformation of a FEM model into an IDEF0 model
and vice versa. However, IDEF0 can represent less
types of assets, and, what is more substantial, it pre-
sents them graphically as arrows, which could be dif-
ficult to overview and analyse.
Other general enterprise modelling techniques,
such as ArchiMate (The open group, 2020), could be
suitable, especially for the modelers that have experi-
ence of the techniques. Still they need to be tested in
an appropriate context, i.e. similar to the one we had
in our project to provide with a more definite answer.
8 CONCLUDING REMARKS AND
PLANS FOR THE FUTURE
As it was explained in Section 1, the research goal of
the project was to test whether FEM can be used in
operational decision-making. Besides the research
goal, the project has a practical objection to analyse a
challenging business situation and produce recom-
mendations. Therefore, the research team was pre-
pared to abandon FEM if it proved not to be suitable
for the practical goal.
The possibility of decomposing business pro-
cesses into subprocesses using acquire-asset-stock
chains allowed us to proceed with FEM in the project.
This possibility has been suggested already in (Bider
et al., 2017), but it has never been tested in practice
before. Such decomposition should now be consid-
ered as useful for certain contexts and goals since it
has proved to be useful in the presented project. At
the beginning of the research we were overwhelmed
with the diversity of the activities performed by BSS.
Understanding what the department does and why has
been a challenge. Building an overview model, as
presented in Fig. 1, and decomposing processes in
which BSS participated helped us to comprehend the
complexity, and identify patterns of recurrent situa-
tions related to the BSS business activities.
Note that the concept of stock used in this work is
consistent with the business terminology, e.g. stock of
orders, and with the usage of the term in other mod-
elling techniques, e.g. System Dynamics (Richardson
& Pugh III, 1981), where any kind of reservoir for
storage is modelled as a stock.
The project has identified the needs to extend the
capabilities of our modeling tool in order to provide a
more convenient environment for modelers. Desired
features concern easy to grasp visual presentation of
decomposition, and classification of assets and pro-
cesses according to various dimensions. As was men-
tioned in Section 6, these features have been imple-
mented in the new version of the tool.
Other directions of our work on using FEM in op-
erational decision-making include conducting more
case studies, and starting working on a library of pat-
terns, two of which were identified in the project.
ACKNOWLEDGEMENTS
The authors are grateful to the BSS management team
who spent a lot of time describing their activities and
answering numerous questions. We are also in debts
to Dominik Bork who has created the first version of
the FEM modeling tool and continues helping us in
the further development of the tool.
The work of the second author was partly sup-
ported by the Estonian Research Council (grant
PRG1226).
REFERENCES
ADOxx.org, 2017. ADOxx. [Online] Available at:
https://www.adoxx.org [Accessed March 2019].
Does Fractal Enterprise Model Fit Operational Decision Making?
623

Anderson, J., Donnellan, B. & Hevner, A.R., 2012.
Exploring the Relationship between Design Science
Research and Innovation: A Case Study of Innovation
at Chevron. In Communications in Computer and
Information Science, 286. Springer, pp.116-31.
Ayora, C. et al., 2015. VIVACE: A framework for the
systematic evaluation of variability support in process-
aware information systems. Information and Software
Technology, 57, pp.248–76.
Bider, I., Johannesson, P. & Perjons, E., 2013. Design
science research as movement between individual and
generic situation-problem-solution spaces. In
Baskerville, R., De Marco, M. & and Spagnoletti, P.
Organizational Systems. An Interdisciplinary
Discourse. Springer. pp.35-61.
Bider, I. & Perjons, E., 2018. Defining Transformational
Patterns for Business Model Innovation. In
Perspectives in Business Informatics Research: 17th
International Conference, BIR 2018, Stockholm,
Sweden, LNBIP. Springer, pp.81-95.
Bider, I., Perjons, E., Elias, M. & Johannesson, P., 2017. A
fractal enterprise model and its application for business
development. SoSyM, 16(3), pp.663–89.
Bider, I., Perjons, E. & Johannesson, P., 2019. Using
Ontologies for Comparing Modeling Techniques:
Experience Report. In Advances in Conceptual
Modeling. Springer, LNSC, Vol. 11787, pp.180-90.
Bork, D. et al., 2019. An Open Platform for Modeling
Method Conceptualization: The OMiLAB Digital
Ecosystem. Communications of the Association for
Information Systems, 44.
Fractal Enterprise Model, 2020. FEM toolkit.
[Online] fractalmodel.org Available at: https://www.
fractalmodel.org/fem-toolkit/ [Accessed 27 February
2021].
Hevner, A.R., March, S.T. & and, P.J., 2004. Design
Science in Information Systems Research. MIS
Quarterly, 28(1), pp.75-105.
Hoverstadt, P., 2013. Why Business should take Enterprise
Architecture seriously. In J. Gøtze & A. Jensen-Waud,
eds. Beyond alignment, Systems Volume 3. College
publishing. pp.55-166.
Hoverstadt, P. & Loh, L., 2017. Patterns of Strategy. Taylor
& Francis.
Jacobs, F.R., Berry, W.L., Whybark, D.C. & Vollmann,
T.E., 2011. Manufacturing planning and control for
supply chain management: APICS/CPIM Certification
Edition. McGraw-Hill Education.
Mott, V., 1996. Knowledge comes from practice:
Reflective theory building in practice. In R.W. Rowden,
ed. Workplace learning: Debating five critical
questions of theory and practice. San Francisco, CA:
Jossey-Bass. pp.57-63.
NIST, 1993. Integration definition for function modeling
(IDEF0), Draft Federal Information Processing
Standards, Publication 183, 1993. [Online] Available
at: https://www.idef.com/idefo-function_modeling_
method/ [Accessed 30 October 2020].
OMG, 2013. Business Process Model and Notation
(BPMN), Version 2.0.2, Object Management Group
(OMG), Document formal/2013-12-09, December
2013. [Online] OMG Available at: http://www.
omg.org/spec/BPMN/2.0.2/PDF [Accessed February
2015].
Richardson, G.P. & Pugh III, A.L., 1981. Introduction to
System Dynamics Modeling.
The open group, 2020. ArchiMate® 3.0.1 Specification.
[Online] Available at: https://publications.opengroup.
org/standards/archimate/specifications/c179 [Accessed
30 October 2020].
Weske, M., 2007. Business process management: concepts,
methods, technology. Springer-Verlag.
ICEIS 2021 - 23rd International Conference on Enterprise Information Systems
624
