
Developing Evaluation Metrics for Active Reading Support
Nanna Inie
a
and Louise Barkhuus
b
Department of Computer Science, IT University of Copenhagen, Rued Langaards Vej 7, Copenhagen, Denmark
Keywords:
Reading Support Tools, Digital Reading, Evaluation Metrics, User Experience Design, User Experience
Methodology.
Abstract:
Reading academic literature in digital formats is becoming more and more of a normalcy for students, but
designers of reading support tools do not share common, metrics for evaluating such tools. This paper intro-
duces our work in developing an evaluation form which we call the aRSX (active Reading Support IndeX).
The aRSX-form is a quantitative means for evaluating whether a specific software or hardware tool supports
active, academic reading in a way that resonates with personal user experience and learning preferences - in
other words; whether the tool is practical and pleasant to use for the student who consumes academic litera-
ture. The paper presents the first and second iterations of the aRSX evaluation survey based on a preliminary
exploratory experiment with 50 university students. The paper also describes how the evaluation form can be
developed and used by designers of reading support tools.
1 INTRODUCTION
Academic reading is changing. The content and
amount of what students read, the way they read, and
the platforms they use to consume written content
are highly influenced and changed by the availabil-
ity of novel, digital software and hardware (Hayles,
2012; Pearson et al., 2013; Delgado et al., 2018).
While numerous novel platforms and tools are devel-
oped to support classroom teaching and various forms
of student collaboration and co-working, reading has
not been the subject of similar innovation and sup-
port. Many studies have indicated that performance
deficits between physical and digital platforms have
narrowed in later years (defined as the post 2013)
(Kong et al., 2018), and convenience factors of digital
reading (such as cost, accessibility, and environmental
impact) make many students choose to read on digital
platforms (Vincent, 2016; Mizrachi et al., 2016).
The diversity of digital reading support tools is
surprisingly low (Pearson et al., 2013; Mizrachi et al.,
2016). Digital textbooks are rarely designed to look
different from their physical instances (both are of-
ten distributed as PDFs, a format designed for print-
ing to make a document stable and always look the
same on all devices), and the hardware used to con-
sume digital texts is largely confined to personal lap-
a
https://orcid.org/0000-0002-5375-9542
b
https://orcid.org/0000-0003-1306-249X
tops and, less often, tablets (Mizrachi et al., 2016;
Pearson et al., 2013; Sage et al., 2019). As Pear-
son, Buchanan and Thimbleby found in their work on
developing lightweight interaction tools, existing dig-
ital document formats are “far from ideal”, and both
the software and hardware used for reading often sup-
ports casual reading much better than attentive, close
interpretation of the text (Pearson et al., 2013).
From an educational perspective, this is at best an
under-utilization of the great potential of digital tools
that we could take advantage of. At worst, this may
be a causal factor of the decline in reading abilities
of students from elementary school through college
(Hayles, 2012). In one meta-study of research on dig-
ital versus physical reading, Delgado and colleagues
(Delgado et al., 2018) found that students seem to
have become worse at reading in digital formats, and
suggested that one of the causal factors may be the
shallowing hypothesis, a rationale that states that be-
cause the use of most digital media consists of quick
interactions driven by immediate rewards (e.g. num-
ber of “likes” of a post), readers using digital devices
may find it difficult to engage in challenging tasks,
such as reading comprehension, which requires sus-
tained attention (Delgado et al., 2018; Annisette and
Lafreniere, 2017).
One of the main reasons for student preferences
for physical formats in place of digital has been
found to be the interaction that physical formats af-
Inie, N. and Barkhuus, L.
Developing Evaluation Metrics for Active Reading Support.
DOI: 10.5220/0010406701770188
In Proceedings of the 13th International Conference on Computer Supported Education (CSEDU 2021) - Volume 1, pages 177-188
ISBN: 978-989-758-502-9
Copyright
c
2021 by SCITEPRESS – Science and Technology Publications, Lda. All rights reserved
177

ford (Sage et al., 2019; Rockinson-Szapkiw et al.,
2013; Farinosi et al., 2016; P
´
alsd
´
ottir, 2019). Some
evidence also suggests that the process of interacting
with a computer, specifically, is the main cause of any
performance deficits between paper and screen read-
ing (Pearson et al., 2013).
With this paper, we suggest that rather than look-
ing at differences between physical and digital plat-
forms in a broad sense, we should investigate the user
experience of different tools in more detail. A tablet
is not just a tablet and a computer is not only a com-
puter. A book is not the same as a loose sheet of paper,
and a highlight pen is not the same as a blunt pen-
cil. Different digital document readers can be used
on the same tablet or computer, rendering broad com-
parisons between “digital” and “physical” somewhat
meaningless. Rather, we should try to evaluate which
interface features and interaction formats work well
for different users and their learning preferences.
This paper contributes to the emerging field of
digital reading support tools by suggesting an eval-
uation metric for reading support platforms and tools.
We present the first version of the active Reading Sup-
port indeX, aRSX, a first step towards a standardized
evaluation scheme that can be used by researchers and
developers to, relatively quickly, identify how a read-
ing tool supports usability and user experience. In
addition, such an evaluation tool can be used to in-
dicate “robust moderating factors” which may shed
light on many of the seemingly inconsistent findings
across studies of reading performance in different me-
dia (Delgado et al., 2018).
The paper presents the first and second iterations
of the aRSX, which was developed with intent to ex-
plore the question: How might we evaluate reading
support tools with regards to user experience and per-
sonal learning preferences? We seek to answer this
question by conducting an exploratory experiment
with 50 university students, comparing their evalua-
tion of a paper and a computer-based academic read-
ing medium.
2 BACKGROUND AND RELATED
WORK
The differences in reading performance and learn-
ing outcomes between reading digital and physical
texts have been studied extensively, particularly with
a focus on reading speed and comprehension of text,
e.g. (Singer and Alexander, 2017; Dillon et al., 1988;
Rockinson-Szapkiw et al., 2013; Mangen et al., 2013;
Sage et al., 2019). Interaction with different read-
ing support tools and milieus has been investigated
to a lesser degree, yet with noteworthy exceptions,
e.g. (Freund et al., 2016; Kol and Schcolnik, 2000;
Brady et al., 2018; Wolfe, 2008; Johnston and Fergu-
son, 2020). Research in the area is still attempting to
identify robust moderating factors for why studies of
digital versus analog performance seem to yield con-
flicting results (Delgado et al., 2018).
Meanwhile, large-scale studies of attitudes and
preferences continue to conclude that students
slightly prefer physical formats for focused academic
reading, generally stating they feel like paper-based
reading let them concentrate and remember better
(Mizrachi et al., 2016; P
´
alsd
´
ottir, 2019).
2.1 Active (Academic) Reading
Active reading was first described by Mortimer Adler
in 1940 in the piece How to Read a Book (Adler
and Van Doren, 2014). Active reading means read-
ing while actively thinking and learning, and is often
accompanied by interaction activities such as note-
taking, highlighting and underlining the text (O’Hara,
1996). Pearson et al. list the main interaction fea-
tures of active reading as adding placeholders in the
text (temporary or permanent), creating annotations
in the text, taking notes both in the text and on sep-
arate media, and navigating the text with the help of
indexing (Pearson et al., 2013). Several studies indi-
cate that it is beneficial for “secondary tasks” - such
as annotation or navigation - to be as minimally cog-
nitively demanding as possible in active reading con-
texts (Pearson et al., 2013; DeStefano and LeFevre,
2007).
Active reading is an example of how academic
students read texts, though active reading is not lim-
ited to academic reading. We focus, in this paper, on
academic reading as the type of reading that academic
students perform of texts that they wish to memorize
and learn from, according to the Remember-Know
paradigm, which states that Knowledge which is Re-
membered is typically recalled in close association
with related information pertaining to the learning
episode. It is more vulnerable to fading with time.
Knowledge which is Known is recalled, retrieved, and
applied without any such additional contextual asso-
ciations. By implication, it is assumed that Known
knowledge is indicative of better learning (Tulving,
1985; Conway et al., 1997).
2.2 Reading Support Tools
A reading support tool can be defined as any tool that
can be used by people to read or support the reading
of documents that primarily consist of written text. A
CSEDU 2021 - 13th International Conference on Computer Supported Education
178

reading support tool can can be analog or digital, and
it can be software or hardware. Hardware platforms,
of course, need software to display a text.
Digital readers – such as ePub and PDF readers
– are often not recognized as distinct tools, because
they mainly display content, rather than support the
reader actively, such as by facilitating active knowl-
edge construction in the interaction with the tool (Fre-
und et al., 2016; Sage et al., 2019). With the ad-
vent and spread of literature in digital formats, how-
ever, active reading support tools are in great demand
(Pearson et al., 2013). Studies in this area are often
not specific about the reading tool they are evaluating.
Reading on an iPad with GoodReader may yield dif-
ferent reading performance and user experience than
using Adobe Acrobat Reader on a Samsung Galaxy
Tab, even though these could both be categorized as
“tablet reading”. There is a difference in evaluating
the iPad versus the Samsung Galaxy, or evaluating
GoodReader versus Adobe Acrobat. Providing clarity
and distinctions between these tools is necessary for
research to be comparable and findings to be widely
applicable.
2.3 User Experience of Reading Tools
User experience (UX) as a research agenda is con-
cerned with studying the experience and use of tech-
nology in context. The UX of a product is a conse-
quence of
“a user’s internal state (predispositions, ex-
pectations, needs, motivation, mood, etc.), the
characteristics of the designed system (e.g.
complexity, purpose, usability, functionality,
etc.) and the context (or the environment)
within which the interaction occurs (e.g. or-
ganisational/social setting, meaningfulness of
the activity, voluntariness of use, etc.)” (Has-
senzahl and Tractinsky, 2006), our emphases.
Models of UX usually separate a product’s pragmatic
from its hedonic qualities, where pragmatic attributes
advance the user toward a specific goal and depend
on whether the user sees a product as simple, pre-
dictable, and practical. Hedonic attributes, on the
other hand, are related to whether users identify with a
product or find it appealing or exhilarating (Hornbæk
and Hertzum, 2017). Pragmatic attributes are often
found to exert a stronger influence on the evaluation
of a product than hedonic attributes.
Although text is presented linearly, learning by
reading is not a linear process. Reading, and par-
ticularly academic reading, is open-ended. An aca-
demic reader depends on constant self-evaluation of
whether the material is understood and internalized
or not, rather than defined and well-known external
objectives. According to Csikszentmihalyi’s concept
of flow in a learning context, student engagement is
a consequence of simultaneous occurence of concen-
tration, enjoyment, and interest. These states are read-
ily related to the UX qualities of internal state, system
characteristics, and context, and should be evaluated
in relation to any reading support tool.
There are numerous ways of evaluating usability
of products and tools, but none of the methods ad-
dress the specific requirements of reading, such as
whether the tool helps the student read, process and
understand – in other words, whether the tool helps
the student know the material. The UX goals of such
tools are not efficiency or performance metrics, but
rather that the user feels cognitively enabled to focus
on the text content for as little or as much time as nec-
essary (Pearson et al., 2013).
While qualitative research such as detailed inter-
views and observations are traditional methods for
conducting UX evaluations, these methods are time-
consuming and not easy to implement on a large
scale. The goal of the aRSX is develop a quantitative,
survey-based evaluation with a foundation in qualita-
tive UX research. Quantitative surveys are non-costly
and time-efficient to execute, and they have been used
for decades as a valuable indicator of tool specifi-
cations and requirements (Hart and Staveland, 1988;
Hart, 2006; Nielsen, 1995).
Generally, metric-based research investigating
students’ opinions and experiences of reading tools
has consistently found correlation between interac-
tion design and reading performance (Haddock et al.,
2019; L
´
eger et al., 2019; Freund et al., 2016; Lim
and Hew, 2014; Zeng et al., 2016), and a positive
correlation between user attitudes and learning out-
comes (Kettanurak et al., 2001; Sage et al., 2016;
Teo et al., 2003). However, few studies investigate
specifically which features foster a good learning ex-
perience, although with some exceptions, e.g. (Pear-
son et al., 2013; Buchanan and Pearson, 2008; Chen
et al., 2012; Pearson et al., 2012). One survey iden-
tified some of the most important themes for aca-
demic students when choosing between digital and
paper as the following: Flexibility, ability to con-
centrate, ability to remember what was read, orga-
nizing, approachability and volume of the material,
expenses, making notes, scribbling and highlighting,
and technological advancement (P
´
alsd
´
ottir, 2019). It
is our research agenda to develop an evaluation sur-
vey which is founded in these and similar findings,
and which evaluates the user experience design of any
given reading support tool.
Developing Evaluation Metrics for Active Reading Support
179
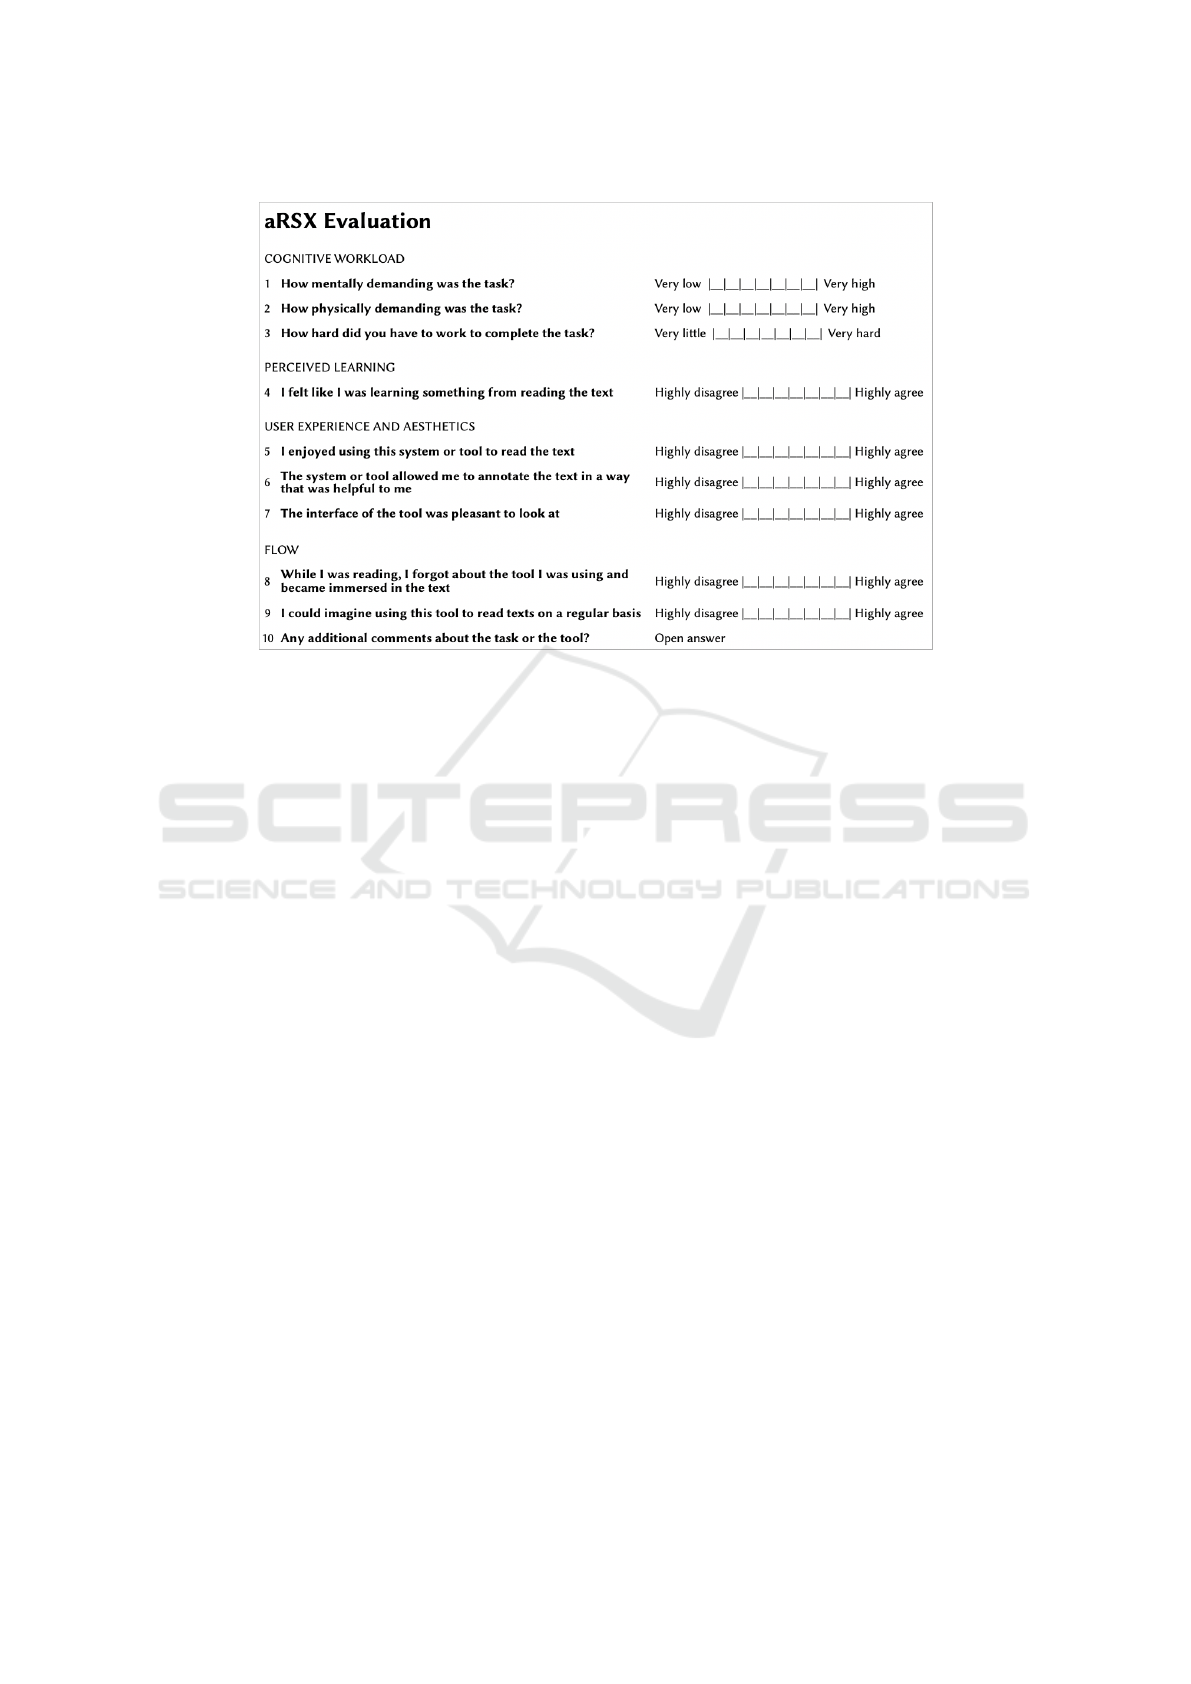
Figure 1: The first iteration of the aRSX evaluation. The questions are divided into categories addressing cognitive workload,
perceived learning, user experience and aesthetics, and flow of studying, which are categories amalgamated from previous
research findings. The form also has an open-ended question, which has shown to lead to very interesting thematic responses
(P
´
alsd
´
ottir, 2019), and serves as a way for us to become aware of salient themes for the students.
3 METHODOLOGY:
DEVELOPING THE aRSX
The first iteration of the aRSX (Figure 1) consists
of nine Likert-scale questions and an open-ended
prompt for additional comments. We included four
categories of questions based on UX and active read-
ing theory.
Cognitive Workload. One of the main goals of a
reading support tool is to minimize the cognitive ef-
fort required of the reader to interact with the tool
itself, so they can focus completely on the content
(Pearson et al., 2013; DeStefano and LeFevre, 2007).
We therefore used the NASA Task Load Index (TLX)
(Hart and Staveland, 1988) as inspiration for the sur-
vey format. The NASA TLX has been used for over
30 years as an evaluation method to obtain workload
estimates from ’one or more operators’ either while
they perform a task or immediately afterwards. Other
fields have had great success appropriating the TLX
to evaluate task-specific tools, for instance, creativ-
ity support tools (Cherry and Latulipe, 2014). The
first three questions of our evaluation form are copied
from the TLX-questions concerning mental and phys-
ical demand – the latter potentially distracting from
the content itself. The first iteration of the aRSX is
designes as a “Raw TLX”, eliminating the part of the
original TLX which is concerned with weighting the
individual questions to reflect personal importance at-
tributed to each question. The Raw-TLX approach is
simpler to employ, and does not yield less useful re-
sults (Hart, 2006). Future versions of the aRSX may
include a weighted scoring part, in any instance, to
yield insights about preferences across different pop-
ulations.
Perceived Learning. An academic reader depends
on constant self-evaluation of whether the material is
understood and internalized or not (Tulving, 1985;
Conway et al., 1997). The survey should evaluate
whether the tool generally lives up to the reader’s ex-
pectation of pragmatic qualities, i.e. whether the tool
helps them learn from the text. Self-evaluation is of-
ten used in learning research, and has been proven re-
liable (Sage et al., 2019; Paas et al., 2003), and the
fourth question of the survey simply asks the reader
whether they believed they learned from the reading.
User Experience and Aesthetics. As described in
section 2.3, good user experience and interaction de-
sign have a positive correlation with learning out-
comes. Although we expected readers to have higher
pragmatic expectations of reading support tools than
CSEDU 2021 - 13th International Conference on Computer Supported Education
180

hedonic expectations, user enjoyment and aesthetics
of the reading tool are important to the overall user
experience and technology adaptation (Hornbæk and
Hertzum, 2017). The fifth, sixth and seventh ques-
tion ask whether the reader enjoyed using the tool,
whether it allowed them to annotate the text in a help-
ful way, and whether the tool was pleasant to look at.
Flow. While theory of learning is often concerned
with the content of a given text, the aRSX focuses on
the capacity of the tool to allow the student to process
and engage with the text. The experience of flow
while reading academic texts can occur as the result
of a well-written, interesting or challenging text, but
it can be enhanced or disrupted by contextual factors
such as the tool used to consume the text (Shernoff
et al., 2014; Pearson et al., 2013). By definitions by
the IFLA Study Group (on the functional require-
ments for bibliographic records, 1998) we can say
that the aRSX pertains to evaluating the item – the
physical representation of the book – rather than the
work or the manifestation i.e. the author’s creation
or a particular translation of that work. The last two
questions of the aRSX address whether the tool was
invisible while reading, and whether the tool seems
appropriate to student’s normal practices.
Finally, the aRSX includes an open-ended ques-
tion which we used to uncover additional themes of
the students’ experience of the tool.
3.1 Criteria for a Usable Evaluation
Form
In order to evaluate the usefulness of the aRSX, we
specified the following criteria as ideals for a survey
evaluation:
1) Theoretical Foundation: The evaluation should be
grounded in prior research on reading support tools
and user experience design.
2) Operationlizability: The evaluation should be op-
erational and useful for researchers developing and
evaluating reading support tools.
3) Generalizability: The evaluation must enable re-
searchers to analyse different kinds of reading support
tools with different types of populations in different
types of settings.
4) Comparability: The framework must enable re-
searchers to compare evaluations of different tools,
also between studies.
5) Reliability: The survey should produce reliable re-
sults, aiming for a Cronbach’s alpha above 0.7.
6) Empirical Grounding: The framework must be
tested in practice, ensuring that it measures the in-
tended aspects and that it is clear and usable for both
study participants and researchers.
In the study presented in this paper, we focused espe-
cially on developing empirical grounding through an
early pilot study – testing the survey in an exploratory
experiment. Theoretical and empirical grounding
must also be developed through applying and evolv-
ing the evaluation form in different studies and com-
munities. Through this paper we share the aRSX with
other researchers and invite them to use, evaluate, and
modify the evaluation form.
3.2 Testing the aRSX: Experimental
Setup
3.2.1 Subjects and Treatments
The first version of the aRSX was tested with 50 stu-
dents at the IT University of Copenhagen, Denmark,
during fall 2019. The students were from four dif-
ferent study programs, and primarily bachelor level
students. The students demographics were: 27 male
and 23 female, 22 on their 1st year, 18 on their 2nd
year and 10 on their 3rd year or more of studies. The
median age was 21 years old with the majority of sub-
jects in the age group of 21-23 years old.
As compensation for their participation, all par-
ticipants were gifted a semester’s worth of free text-
books (digital or physical) of their own choosing.
The test setup was a controlled, within-group
setup, where each student were subjected to both
treatments; a paper reading treatment, and a digital
reading treatment.
In the paper reading treatment, students were
provided with the text on printed A4 paper, two high-
lighter pens, one pencil, one ball pen, and sticky
notes. The participants were not instructed to use any
of the items specifically, but rather told that the items
were available for them to use as they pleased. The
text was set in a 12pt Times New Roman with head-
lines in 14pt Arial. The text had 2cm margins on ei-
ther side, to allow for annotations directly on the pa-
per sheet.
In the digital reading treatment, students were
provided with the text on a laptop. The text was a PDF
file and formatted exactly as the paper reading for
comparability. The text was provided in the software
Lix, a reading support software for PDF readings. We
selected a software which offered as lightweight inter-
action possibilities as possible (Pearson et al., 2013).
To avoid distractions and the use of unintended soft-
ware during the reading, the laptops were not con-
Developing Evaluation Metrics for Active Reading Support
181
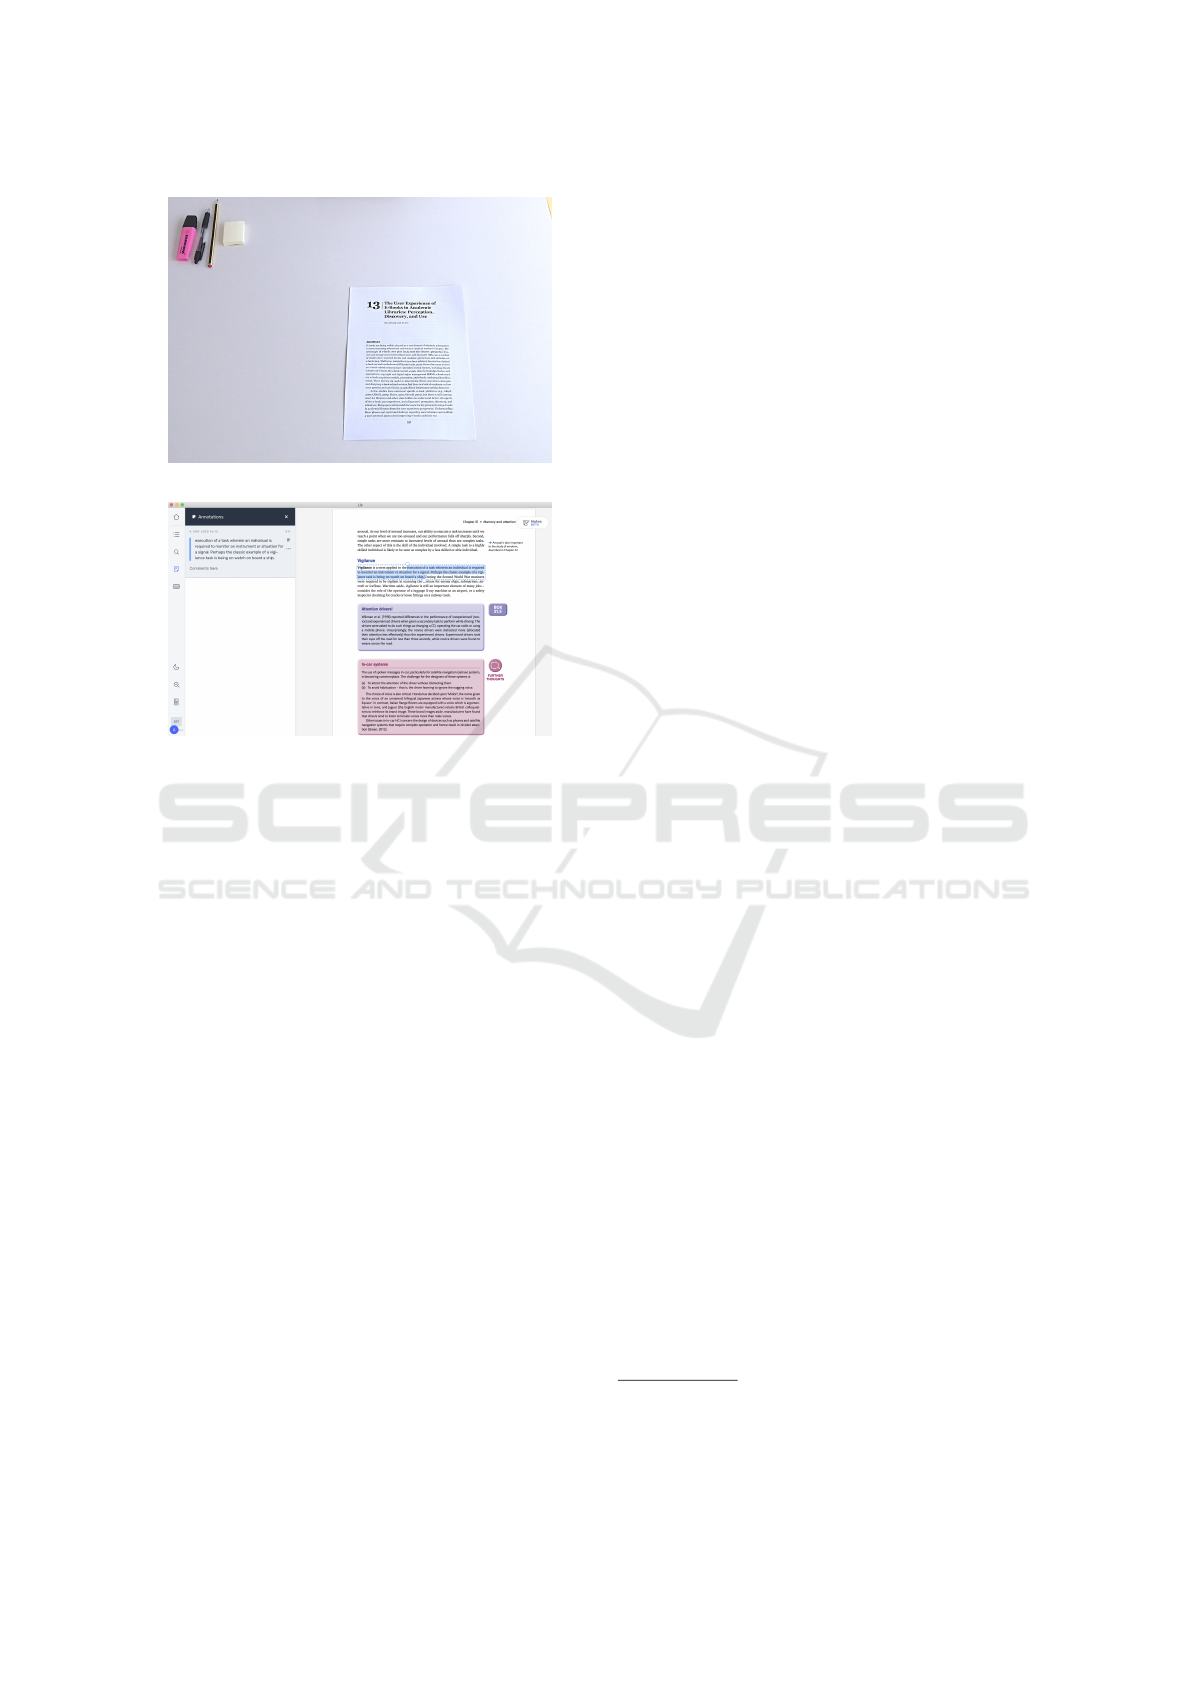
(a)
(b)
Figure 2: The paper reading treatment (top) and digital
reading treatment (bottom).
nected to the internet. A picture of the two treatments
is shown in Figure 2.
3.2.2 Experimental Design and Execution
All students read a text of approximately ten pages.
Ten pages is a typical length of a self-contained read-
ing (such as a research article or a book chapter)
from a university curriculum. The texts were ob-
tained by writing to each of the course leaders for
the students’ courses, asking for 3-5 examples of “A
text from the course curriculum of approximately ten
pages, which you believe corresponds to the course
level 2-3 months in the future”. We performed tests
of LIX scores (Bj
¨
ornsson, 1968) and Flesch–Kincaid
readability tests (Kincaid et al., 1975) on each of the
texts, and selected texts of similar reading difficulty.
We divided each text in two halves of equal length
(but so each half made sense in itself, i.e. ended and
began with a paragraph break), and each student read
half the text in digital, and the other half of the text in
physical form, so as to avoid variation in scores as a
result of varying reading content.
After reading the first half of the text, each student
filled out the aRSX survey on paper for that treatment.
They then read the other half of the text in the opposite
medium, and filled out the aRSX on paper for that
medium. To avoid adverse effects from information
overload or fatigue, 26 of the students read the first
half of the text on paper and the second half of the
text on computer (condition A) and 24 students read
the first half of the text on computer and the second
half of the text on paper (condition B)
1
. The students
in condition A and B were not in the same room. They
were not informed about the focus on the evaluation
form. The students were instructed to read the text “as
if you were preparing for class or exam, making sure
to understand the major points of the text”.
3.2.3 Data Gathering and Analysis
Experimental Observations. The experiment was
run as an explorative experiment, where we were in-
terested in discovering if the evaluation was generally
meaningful for participants, and whether it yielded
significant and useful results. The first type of data
we gathered was experimental observations, primar-
ily questions from participants about the wording of
the survey or how to complete it. Those data did not
need thorough analysis, as the questions we received
were quite straightforward.
Quantitative Data Analysis. The second type of
data we collected were the results of the aSRX, the
purely quantitative data. Running studies with a
number of participants large enough to yield statis-
tical significance is not trivial, and the evaluation
method should not depend on it (i.e. the aRSX should
produce reliable small-scale results). We used the
Cronbach’s alpha as an indicator of internal reliabil-
ity. To investigate statistical significance, we con-
ducted Kolmogorov-Smirnov and Wilcoxon Signed-
Rank tests, aiming for p-values below 0.05. The goal
of these analyses was to investigate whether we could
observe statistically significant within-group differ-
ences in the evaluation scores of two media, and
whether a potential difference would be reliable ac-
cording to classical test theory (DeVellis, 2006).
Qualitative Data Analysis. We designed the aRSX
with a final open-ended question to discover salient
themes that may not have been addressed by the ques-
tions of the survey. The question was optional, and
we received 25 comments regarding the paper read-
ing and 37 comments regarding the digital reading.
The length of the comments varied from one to eight
sentences. We clustered the comments into themes
according to their contribution or evaluation focus,
1
This slight unevenness in distribution of condition A
and B was due to student availability at the time of the ex-
periment.
CSEDU 2021 - 13th International Conference on Computer Supported Education
182

rather than necessarily the topic they addressed. For
instance; “I was missing some words to accompany
the icons on the screen. It wasn’t intuitive for me what
icons meant what” (Participant 170001, digital read-
ing) was coded as #interface/ux design rather than,
for instance, ’icons’ or ’UI design’, because the focus
of the study was to evaluate whether the aRSX ad-
dressed important themes in reading support, and not
to evaluate the individual tool interface.
4 FINDINGS
4.1 Experimental Observations
The first field the evaluation page had an empty field
asking the participant to fill in the ’tool’ they were us-
ing, in this study referring to either the paper or the
digital reading. The first observation we made during
the experiment was that it was not clear to all partici-
pants what to put in this field – they, of course, did not
know we were comparing “paper” and “digital” read-
ing. This attests to the importance of clarifying which
hardware or software is being evaluated. For future
studies we would recommend pre-filling in that field
for the participants.
Finding 1: “Annotating” Is Not an Obvious
Concept. Several participants asked what was
meant by ’annotating’ in question 6: “The system
or tool allowed me to annotate the text in a way
that was helpful to me”. This could be exacerbated
by the fact that only few of the students were na-
tive English speakers, and the survey was conducted
in English. In addition, we observed this theme in
the open-ended survey responses (9 out of 37 partic-
ipants commented on highlighting features), e.g.: “It
is very easy to highlight, but a little more confusing to
make comments to the text” (Participant 190802, dig-
ital reading). According to reading research, annotat-
ing a text consists of, for instance, highlighting, un-
derlining, doodling, scribbling, and creating margina-
lia and notes (Marshall, 1997; Pearson et al., 2013).
Construction of knowledge and meaning during read-
ing happens through activities such these, making the
possibility of annotation extremely important when
supporting active reading. The question of annotation
should be clarified.
Finding 2: “Interface” Is a Concept That Works
Best for Evaluation of Digital Tools. The word ’in-
terface’ in question 7: “The interface of the tool was
pleasant to look at” prompted some questions in the
paper treatment. An interface seems to be interpreted
as a feature of a digital product, and this was not a
useful term when evaluating an analog medium. In
the interest of allowing the aRSX to be used in the
evaluation of both digital and analog tools, this ques-
tion should designate a more general description of
the aesthetics of the tool.
4.2 Quantitative Data
The quantitative results of the first iteration of the
aRSX scale-based questions of the survey are shown
in Table 1. We performed a Kolmogorow-Smirnov
test of normal distribution, which showed general
non-normal distributions, and low probability of re-
sults arising from chance alone. Five p-values pointed
to a normal distribution.
Because of the non-normal distribution of results,
we conducted a Wilcoxon Signed-Rank test. This
showed that differences between the sum scores of
the two tools (paper and laptop) were not statistically
significant, with p-values ranging between 0.08 and
0.7. In line with our expectations based on previ-
ous research (e.g. (Mizrachi et al., 2016; Abuloum
et al., 2019; P
´
alsd
´
ottir, 2019) the paper-based read-
ing condition was rated slightly more favorable on all
parameters except for the physical strain of reading
(Question 2, mean 2.18 for computer vs. 2.20 for pa-
per) and the appearance of the interface (Question 7,
mean 4.86 for paper vs. 5.34 for computer). The fact
that the differences in scores between the two treat-
ments were not statistically significant does not attest
to the validity of the evaluation, rather, it is likely an
accurate picture of students not having strong prefer-
ences for either paper or digital formats when reading
shorter texts (Mizrachi et al., 2016; P
´
alsd
´
ottir, 2019).
Finding 3: The Survey Appears to Be
Internally Reliable. We performed an ANOVA
two-factor analysis without replication, and calcu-
lated a Cronbach’s alpha of 0.7182, which indicates
that the survey is likely to be internally reliable.
Question one, two and three (pertaining to cognitive
workload) ask the user to rate their mental and phys-
ical strain or challenge from 1 (Very low) to 7 (Very
high). In these questions a high score corresponds to
a negative experience, and the scores therefore had
to be reversed to calculate sum score and Cronbach’s
alpha. Further tests are needed to investigate whether
positively/negatively worded statements produce
different results.
Finding 4: “Physical Demand” Should Be
Specified. The average scores for question two
Developing Evaluation Metrics for Active Reading Support
183
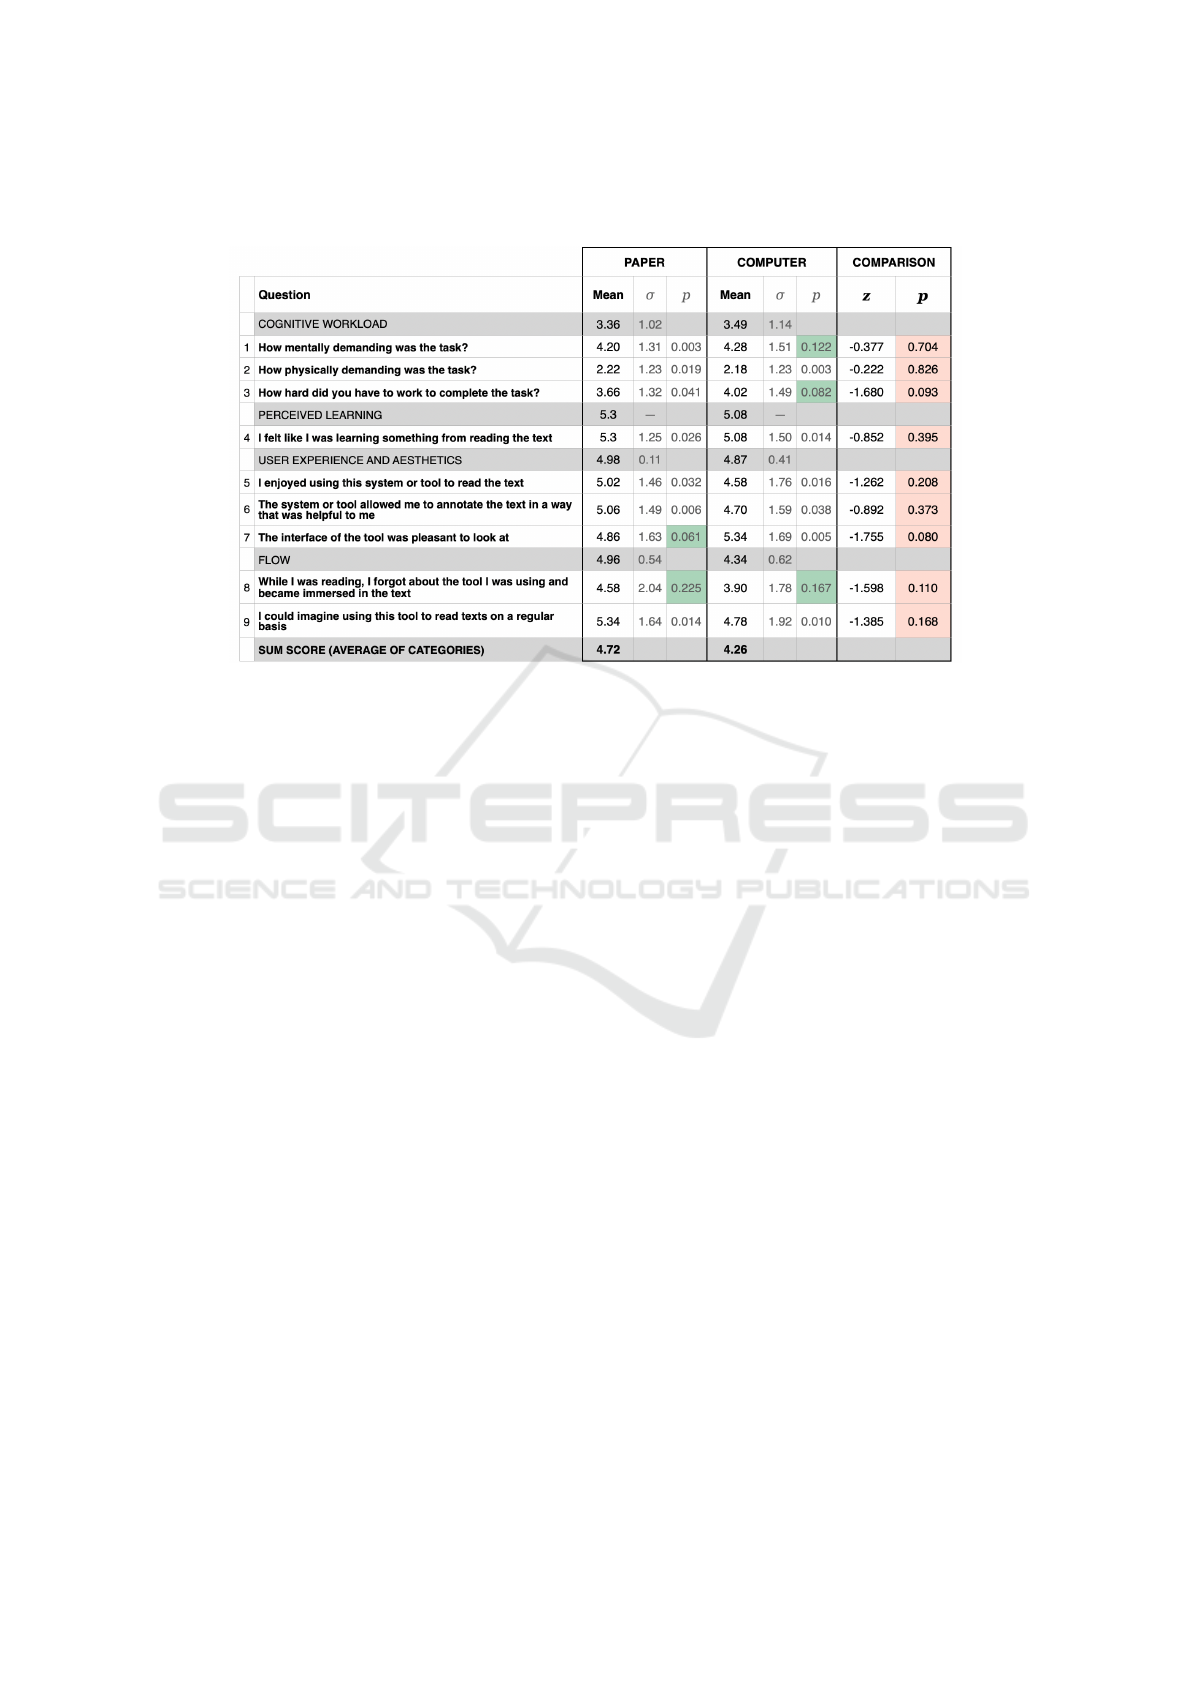
Table 1: aRSX results of Kolmogorov-Smirnov and Wilcoxon Signed-Rank calculations. Normal distributions within question
scores are marked with green, and insignificant p-values of comparisons between the two tools are marked with red (all).
(physical demand) are very low for both paper and
Lix. The question is copied directly from the NASA
TLX, and was deemed relevant because eye strain
from digital reading has often been mentioned as a
negative factor of screen reading in previous research
(e.g. (Sheppard and Wolffsohn, 2018)). ’Physical de-
mand’, however, may be associated with hard, physi-
cal labor, and should be specified further to gain use-
ful knowledge from the score. This was exacerbated
by some of the comments from the open-ended ques-
tion: “I think it would be better to do the test on
my own computer. The computer was noisy and the
screen was small” (Participant 190211, digital read-
ing), and “Reading on a pc is not pleasant when the
paper is white. Use some sort of solarized” (Par-
ticipant 170303, digital reading). These comments
demonstrate that types of experienced physical strain
can very a lot, and the question of physical demand
does not, in itself, yield useful insights. Based on the
low scores, the high p-value, and the comments on
specific, physical difficulties, we speculate that partic-
ipants may interpret the term ’physical demand’ dif-
ferently, and that the scores will be skewed because
of this.
4.3 Qualitative Data
The open-ended question responses generally showed
that participants were aware of the evaluation setup,
and that they were focused on evaluating the usability
and experience of the software tool. The responses
also showed that many of the students were will-
ing to reflect on and compare the different tools in
a meaningful way during the same setup or session.
The responses were extremely valuable in elaborat-
ing the measured experience reflected in the quantita-
tive measures, and we would recommend to keep this
question in future iterations of the survey. In the inter-
est of keeping the survey very light-weight and quick
to use, we have not made the question very elaborate,
or split it into more questions, although that could be
considered in future uses of the survey.
Finding 5: The Content May Influence the
Evaluation of the Tool. A theme in the comments
which was not addressed by the questions in the aRSX
was the content of the specific text which was read.
Nine participants commented on the text e.g.: “Really
interesting text”. (Participant 170001, digital read-
ing) and “The text was more of a refresher than new
learning” (Participant 150302, paper reading). Al-
though it seemed from the comments like the students
were able to distinguish the text from the tool, and
some of these effect would be mitigated by the fact
that the students read from the same text in both treat-
ments, we believe it to be a relevant observation that
the text which is being read may influence the ex-
perience of using a tool. Furthermore, the type of
text may also require different tools for annotating,
cf. “When I tried to highlight mathematical formu-
las it would sometimes try to highlight additional text
that I couldn’t remove from the little highlight box”.
(Participant 180403, digital reading). For the next it-
eration of the aRSX, we suggest adding a question
about the experienced difficulty of the text to allow
transparency of potential effects of this.
CSEDU 2021 - 13th International Conference on Computer Supported Education
184
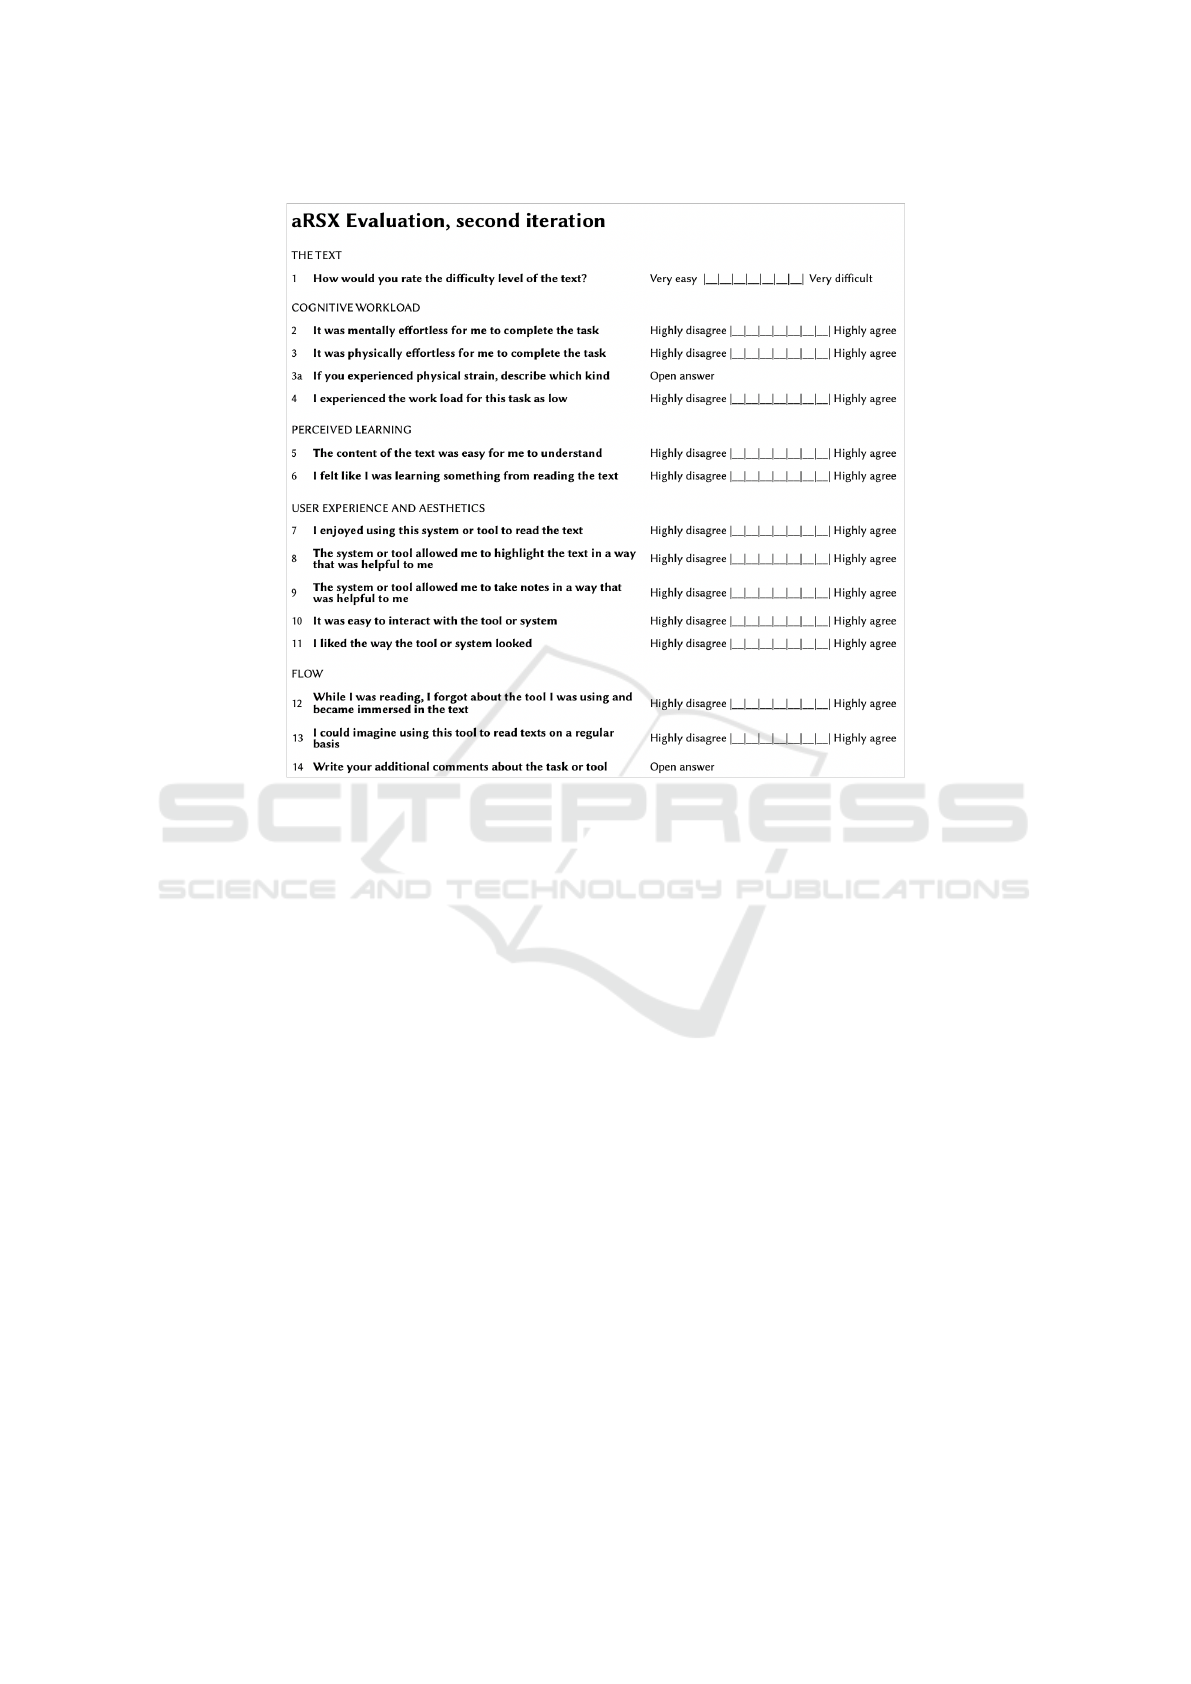
Figure 3: The second iteration of the aRSX.
5 DISCUSSION: EVALUATING
THE aRSX
Based on the findings of our experiments, we have
rephrased some of the questions of the aRSX, as well
as added several questions. The second iteration is
shown in figure 3.
We have added an initial question pertaining the
general difficulty level the text response to Finding 5:
’The difficulty of the text may influence the evalua-
tion of the tool’. If participants experience the text
as very difficult, this may impact their perception of
the tool. Additionally, we added a question under Per-
ceived Learning: “The content of the text was easy for
me to understand”. While the aRSX is not attempt-
ing to evaluate the quality of the text, this questing,
together with the new question 1, acknowledges that
there is an difference between evaluating a text as dif-
ficult, and experiencing difficulty reading it.
The questions regarding cognitive workload, pre-
viously 1-3 and now 2-4 have been rephrased as posi-
tive statements, cf. the observation in Finding 3, mak-
ing it easier to calculate a sum score. Hopefully, this
also avoids any potential confusion in decoding the
scales for participants, who may inadvertently con-
fuse a positive with a negative answer, if the scales
vary.
Question 3: “It was physically effortless for me to
complete the task” now has an added open question
of “If you experienced physical strain, describe which
kind”. This has been added as a consequence of Find-
ing 4: ’“Physical demand” should be specified’.
We split the question about annotations into one
question about the tool’s ability to support highlights
and to create notes cf. Finding 1: ’“Annotating” is
not an obvious concept’. We recognize that not all
students may need to highlight or annotate the texts
they read, in which case we anticipate the score would
be neutral. Based on a few (less than three) of the
responses to the open-ended question, we anticipate
that participants may mention this themselves if they
find it relevant: “I normally don’t take notes for texts
like this. Usually I just read the text and take notes
for the lectures. Therefore it is quite different for me”.
(Participant 190105, paper reading).
The word “interface” is removed from the survey
in the interest of making it usable for evaluation of
analog tools as well as digital, cf. Finding 2: ’“In-
terface” is a concept that works best for evaluation of
digital tools’, and this question has been rephrased.
Developing Evaluation Metrics for Active Reading Support
185

Overall, it was simple to use the aRSX as an evalu-
ation method. We identified some possibilities for im-
provement, which have been integrated into the sec-
ond iteration. In this study, the aRSX was distributed
on paper, which was simple in terms of execution, and
a little more cumbersome in terms of digitizing the
data - especially transcribing the open-ended question
responses might be problematic with large participant
numbers. The survey may also be distributed digi-
tally, which we hypothesize could have a positive ef-
fect on the open-ended question responses, both due
to the possibility of making the question mandatory,
and because of the ease of writing comments on the
computer versus in hand. In its simple form, the sur-
vey should be straightforward to moderate for other
studies. The evaluation does thus fulfill the criterion
of Operationalizability, as per section 3.1.
We believe the first iteration of the aRSX was well
founded in theory, described in the criterion theoreti-
cal foundation. Neither reading support nor user ex-
perience design are new fields, and there is a solid
foundation of knowledge on which to build the selec-
tion of good evaluation questions. The novelty con-
sists primarily in developing a consistent, reflective
practice around such evaluation, so that both develop-
ers and researchers can best benefit from the work of
colleagues and peers.
In terms of Generalizability and Comparability,
we need to conduct further studies of the aRSX in use,
to assess the internal reliability of the questions and
validity of results. Developing psychometric evalu-
ation tools is not a trivial task, and we are looking
forward to explore this avenue in depth.
The survey responses had a Cronbach’s alpha of
0.718, which is a satisfying result. We will explore
different terminology and phrasing in future iterations
of the aRSX and aim for an a above 8.5.
Finally, we have achieved better empirical
grounding of the aRSX in conducting the first study
and evaluating its outcomes. The second iteration of
the aRSX is more detailed, and will hopefully yield
more valuable insights to researchers and developers
of reading support tools. We of course invite peers
and colleagues to use, moderate, and evolve the sur-
vey in their research, further extending the level of
empirical grounding.
6 CONCLUSION AND FUTURE
WORK
In this paper, we presented the active Reading Sup-
port indeX (aRSX), an evaluation form designed to
assess the reading support of a tool in active reading
based on user experience and learning preferences.
Currently, such evaluation happens ad hoc in research,
and the evaluation methods vary from study to study,
making it difficult to compare evaluations of different
reading support tools across studies.
An initial test of the first iteration of the aRSX
yielded valuable insights about the framing of the
evaluation, as well as revealed themes of questions
that should be included in the next iteration of the
form.
We continue to use the aRSX to evaluate reading
support tools and prototypes of different kinds. The
second iteration of the aRSX will be tested with a fo-
cus on reliability and validity assessment metrics. Fu-
ture work will include further experimentation with
the same and different user groups, providing addi-
tional longitudinal comparative data with the same
cohort group and several tools as well as different
populations. So far, the aRSX has shown to provide
meaningful data with a relatively small sample, and
we believe the iterations suggested in this paper will
make it a stronger evaluation tool.
We believe that the aRSX is a very promising av-
enue for evaluating reading support tools based on
personal user experience, and we invite the research
community to apply and appropriate the survey.
ACKNOWLEDGMENTS
We thank the students who participated in this exper-
iment. This research was funded by the Innovation
Fund Denmark, grant 9066-00006B: Supporting Aca-
demic Reading with Digital Tools.
REFERENCES
Abuloum, A., Farah, A., Kaskaloglu, E., and Yaakub, A.
(2019). College students’ usage of and preferences for
print and electronic textbooks. International Journal
of Emerging Technologies in Learning, 14(7).
Adler, M. J. and Van Doren, C. (2014). How to read a
book: The classic guide to intelligent reading. Simon
and Schuster.
Annisette, L. E. and Lafreniere, K. D. (2017). Social me-
dia, texting, and personality: A test of the shallowing
hypothesis. Personality and Individual Differences,
115:154–158.
Bj
¨
ornsson, C.-H. (1968). L
¨
asbarhet. Liber.
Brady, K., Cho, S. J., Narasimham, G., Fisher, D., and
Goodwin, A. (2018). Is scrolling disrupting while
reading? International Society of the Learning Sci-
ences, Inc.[ISLS].
CSEDU 2021 - 13th International Conference on Computer Supported Education
186

Buchanan, G. and Pearson, J. (2008). Improving placehold-
ers in digital documents. In International Conference
on Theory and Practice of Digital Libraries, pages 1–
12. Springer.
Chen, N., Guimbretiere, F., and Sellen, A. (2012). Design-
ing a multi-slate reading environment to support active
reading activities. ACM Transactions on Computer-
Human Interaction (TOCHI), 19(3):1–35.
Cherry, E. and Latulipe, C. (2014). Quantifying the creativ-
ity support of digital tools through the creativity sup-
port index. ACM Transactions on Computer-Human
Interaction (TOCHI), 21(4):21.
Conway, M. A., Gardiner, J. M., Perfect, T. J., Anderson,
S. J., and Cohen, G. M. (1997). Changes in memory
awareness during learning: The acquisition of knowl-
edge by psychology undergraduates. Journal of Ex-
perimental Psychology: General, 126(4):393.
Delgado, P., Vargas, C., Ackerman, R., and Salmer
´
on, L.
(2018). Don’t throw away your printed books: A
meta-analysis on the effects of reading media on read-
ing comprehension. Educational Research Review,
25:23–38.
DeStefano, D. and LeFevre, J.-A. (2007). Cognitive load
in hypertext reading: A review. Computers in human
behavior, 23(3):1616–1641.
DeVellis, R. F. (2006). Classical test theory. Medical care,
pages S50–S59.
Dillon, A., McKnight, C., and Richardson, J. (1988). Read-
ing from paper versus reading from screen. The com-
puter journal, 31(5):457–464.
Farinosi, M., Lim, C., and Roll, J. (2016). Book or screen,
pen or keyboard? a cross-cultural sociological anal-
ysis of writing and reading habits basing on ger-
many, italy and the uk. Telematics and Informatics,
33(2):410–421.
Freund, L., Kopak, R., and O’Brien, H. (2016). The ef-
fects of textual environment on reading comprehen-
sion: Implications for searching as learning. Journal
of Information Science, 42(1):79–93.
Haddock, G., Foad, C., Saul, V., Brown, W., and Thomp-
son, R. (2019). The medium can influence the mes-
sage: Print-based versus digital reading influences
how people process different types of written infor-
mation. British Journal of Psychology.
Hart, S. G. (2006). Nasa-task load index (nasa-tlx); 20 years
later. In Proceedings of the human factors and er-
gonomics society annual meeting, volume 50, pages
904–908. Sage Publications Sage CA: Los Angeles,
CA.
Hart, S. G. and Staveland, L. E. (1988). Development of
nasa-tlx (task load index): Results of empirical and
theoretical research. In Advances in psychology, vol-
ume 52, pages 139–183. Elsevier.
Hassenzahl, M. and Tractinsky, N. (2006). User experience-
a research agenda. Behaviour & information technol-
ogy, 25(2):91–97.
Hayles, N. K. (2012). How we think: Digital media and
contemporary technogenesis. University of Chicago
Press.
Hornbæk, K. and Hertzum, M. (2017). Technology ac-
ceptance and user experience: A review of the ex-
periential component in hci. ACM Transactions on
Computer-Human Interaction (TOCHI), 24(5):1–30.
Johnston, N. and Ferguson, N. (2020). University students’
engagement with textbooks in print and e-book for-
mats. Technical Services Quarterly, 37(1):24–43.
Kettanurak, V. N., Ramamurthy, K., and Haseman, W. D.
(2001). User attitude as a mediator of learning perfor-
mance improvement in an interactive multimedia en-
vironment: An empirical investigation of the degree of
interactivity and learning styles. International Journal
of Human-Computer Studies, 54(4):541–583.
Kincaid, J. P., Fishburne Jr, R. P., Rogers, R. L., and
Chissom, B. S. (1975). Derivation of new readability
formulas (automated readability index, fog count and
flesch reading ease formula) for navy enlisted person-
nel.
Kol, S. and Schcolnik, M. (2000). Enhancing screen reading
strategies. Calico journal, pages 67–80.
Kong, Y., Seo, Y. S., and Zhai, L. (2018). Comparison of
reading performance on screen and on paper: A meta-
analysis. Computers & Education, 123:138–149.
L
´
eger, P.-M., An Nguyen, T., Charland, P., S
´
en
´
ecal, S.,
Lapierre, H. G., and Fredette, M. (2019). How learner
experience and types of mobile applications influence
performance: The case of digital annotation. Comput-
ers in the Schools, 36(2):83–104.
Lim, E.-L. and Hew, K. F. (2014). Students’ perceptions of
the usefulness of an e-book with annotative and shar-
ing capabilities as a tool for learning: a case study.
Innovations in Education and Teaching International,
51(1):34–45.
Mangen, A., Walgermo, B. R., and Brønnick, K. (2013).
Reading linear texts on paper versus computer screen:
Effects on reading comprehension. International jour-
nal of educational research, 58:61–68.
Marshall, C. C. (1997). Annotation: from paper books to
the digital library. In Proceedings of the second ACM
international conference on Digital libraries, pages
131–140.
Mizrachi, D., Boustany, J., Kurbano
˘
glu, S., Do
˘
gan, G.,
Todorova, T., and Vilar, P. (2016). The academic read-
ing format international study (arfis): Investigating
students around the world. In European Conference
on Information Literacy, pages 215–227. Springer.
Nielsen, J. (1995). How to conduct a heuristic evaluation.
Nielsen Norman Group, 1:1–8.
O’Hara, K. (1996). Towards a typology of reading goals.
on the functional requirements for bibliographic records,
I. S. G. (1998). Functional requirements for biblio-
graphic records: final report.
Paas, F., Tuovinen, J. E., Tabbers, H., and Van Gerven, P. W.
(2003). Cognitive load measurement as a means to
advance cognitive load theory. Educational psycholo-
gist, 38(1):63–71.
P
´
alsd
´
ottir,
´
A. (2019). Advantages and disadvantages
of printed and electronic study material: perspec-
tives of university students. Information Research,
Developing Evaluation Metrics for Active Reading Support
187

24(2):Retrieved from http://InformationR.net/ir/24–
2/paper828.html.
Pearson, J., Buchanan, G., and Thimbleby, H. (2013). De-
signing for digital reading. Synthesis lectures on infor-
mation concepts, retrieval, and Services, 5(4):1–135.
Pearson, J., Buchanan, G., Thimbleby, H., and Jones, M.
(2012). The digital reading desk: A lightweight ap-
proach to digital note-taking. Interacting with Com-
puters, 24(5):327–338.
Rockinson-Szapkiw, A. J., Courduff, J., Carter, K., and
Bennett, D. (2013). Electronic versus traditional print
textbooks: A comparison study on the influence of
university students’ learning. Computers & Educa-
tion, 63:259–266.
Sage, K., Augustine, H., Shand, H., Bakner, K., and Rayne,
S. (2019). Reading from print, computer, and tablet:
Equivalent learning in the digital age. Education and
Information Technologies, 24(4):2477–2502.
Sage, K., Rausch, J., Quirk, A., and Halladay, L. (2016).
Pacing, pixels, and paper: Flexibility in learning
words from flashcards. Journal Of Information Tech-
nology Education, 15.
Sheppard, A. L. and Wolffsohn, J. S. (2018). Digital eye
strain: prevalence, measurement and amelioration.
BMJ open ophthalmology, 3(1):e000146.
Shernoff, D. J., Csikszentmihalyi, M., Schneider, B., and
Shernoff, E. S. (2014). Student engagement in high
school classrooms from the perspective of flow the-
ory. In Applications of flow in human development
and education, pages 475–494. Springer.
Singer, L. M. and Alexander, P. A. (2017). Reading across
mediums: Effects of reading digital and print texts on
comprehension and calibration. The journal of exper-
imental education, 85(1):155–172.
Teo, H.-H., Oh, L.-B., Liu, C., and Wei, K.-K. (2003).
An empirical study of the effects of interactivity on
web user attitude. International journal of human-
computer studies, 58(3):281–305.
Tulving, E. (1985). Memory and consciousness. Canadian
Psychology/Psychologie canadienne, 26(1):1.
Vincent, J. (2016). Students’ use of paper and pen ver-
sus digital media in university environments for writ-
ing and reading–a cross-cultural exploration. Jour-
nal of Print Media and Media Technology Research,
5(2):97–106.
Wolfe, J. (2008). Annotations and the collaborative digital
library: Effects of an aligned annotation interface on
student argumentation and reading strategies. Interna-
tional Journal of Computer-Supported Collaborative
Learning, 3(2):141.
Zeng, Y., Bai, X., Xu, J., and He, C. G. H. (2016). The in-
fluence of e-book format and reading device on users’
reading experience: A case study of graduate students.
Publishing Research Quarterly, 32(4):319–330.
CSEDU 2021 - 13th International Conference on Computer Supported Education
188
