
A Hybrid IoT Analytics Platform: Architectural Model and
Evaluation
Theo Zschörnig
1
, Jonah Windolph
1
, Robert Wehlitz
1
and Bogdan Franczyk
2,3
1
Institute for Applied Informatics (InfAI), Goerdelerring 9, 04109 Leipzig, Germany
2
Information Systems Institute, Leipzig University, Grimmaische Str. 12, 04109 Leipzig, Germany
3
Business Informatics Institute, Wrocław University of Economics, ul. Komandorska 118-120, 53-345 Wrocław, Poland
Keywords: Fog Computing, Internet of Things, Smart Home, Analytics Architecture.
Abstract: Data analytics are an integral part of the utility and growth of the Internet of Things (IoT). The data, which is
generated from a wide variety of heterogenous smart devices, presents an opportunity to gain meaningful
insights into different aspects of everyday lives of end-consumers, but also into value-adding processes of
businesses and industry. The advancements in streaming and machine learning technologies in the past years
may further increase the potential benefits that arise from data analytics. However, these developments need
to be enabled by the underlying analytics architectures, which have to address a multitude of different
challenges. Especially in consumer-centric application domains, such as smart home, there are different
requirements, which are influenced by technical, but also legal or personal constraints. As a result, analytics
architectures in this domain should support the hybrid deployment of analytics pipelines at different network
layers. Currently available approaches lack the needed capabilities. Consequently, in this paper, we propose
an architectural solution, which enables hybrid analytics pipeline deployments, thus addressing several
challenges described in previous scientific literature.
1 INTRODUCTION
The impact of data analytics on the ongoing growth
of the Internet of Things (IoT) has been substantial in
the past years. Data analytics already play a pivotal
role in a multitude of application domains and are
expected to become more important in the future
(Siow et al., 2018). Based on a recent survey, 42% of
respondents are driven to spend more money on
associated IoT technologies for better data analytics
capabilities (451 Research, 2019). In order to gain
insights into the data of the ever-increasing number
of smart devices, different technologies have been
adopted for the IoT, such as Big Data processing or
machine learning (ML) algorithms.
Together with the possibilities, however, the
challenges arising from this development must also
be considered. A fundamental, yet ongoing concern,
is the need to provide consumers and businesses with
appropriate platforms to design and execute analytics
pipelines. These platforms provide the tools to gain
meaningful insights from the data of smart devices.
Although, there are already numerous architectural
approaches for IoT data analytics, these are most
commonly based on the concepts of processing Big
Data from other domains of information systems
research and practice. Looking at the peculiarities of
the IoT, these approaches are only of limited use,
especially in domains, which are user-centric, such as
smart home. Moreover, the smart home domain
exposes requirements for data processing
architectures, which are driven by personal
preferences and issues of end-consumers, e.g., data
privacy and security, but also technical constraints,
such as limited resource availability.
Against this background, we propose an IoT
analytics platform, which is designed to enable hybrid
analytics pipeline deployments. This platform utilizes
the concept of fog computing in order to provide real-
time stream data processing for different application
scenarios in smart home environments.
The remainder of this paper is structured as
follows: In section 2, we describe the background of
our research. Furthermore, we name the challenges to
be addressed by the architecture we propose.
Afterwards, we present an overview of related works
of this field. In addition, we describe how these are
not fully suitable regarding the problem space
Zschörnig, T., Windolph, J., Wehlitz, R. and Franczyk, B.
A Hybrid IoT Analytics Platform: Architectural Model and Evaluation.
DOI: 10.5220/0010405808230833
In Proceedings of the 23rd International Conference on Enterprise Information Systems (ICEIS 2021) - Volume 1, pages 823-833
ISBN: 978-989-758-509-8
Copyright
c
2021 by SCITEPRESS – Science and Technology Publications, Lda. All rights reserved
823

(section 3). The main contribution of this paper, a
proposal for an analytics architecture to be used in
user-centric environments, is described in section 4.
In section 5, we present a prototypical
implementation of the architecture and evaluate it in
section 6. Finally, we summarize our findings and
provide ideas for further research in this field as well
as our own (section 7).
2 BACKGROUND
The number of smart homes is expected to rise to
483 million in the year 2025 (Statista, 2020). This
development is accompanied by an increase in the
amount of data generated. The creation of meaningful
insights from these data is a cornerstone of generating
added value from smart devices. For this reason, it is
necessary to develop suitable analytics architectures
that, for example as part of an IoT platform, are able
to cope with the various challenges involved. These
architectures and the resulting implementations are
the foundation for the creation and operation of
analytics pipelines. Previous research on this topic
has already identified a number of challenges that
should be addressed by such architectures (Zschörnig,
Wehlitz, & Franczyk, 2020).
Based on the overview of Zschörnig, Wehlitz, and
Franczyk (2020), we mapped the found challenges to
the smart home domain and found that they are
primarily influenced by the residents. Specifically,
privacy and security regarding IoT data is a major
concern for them. In contrast, smart homes only
provide limited computing resources, thus requiring
the ability to offload analytics tasks to cloud data
centers. Furthermore, fault-tolerant data input is
important, since analytics pipelines need to keep
running, even if connectivity issues, etc. occur. Since
available smart devices in smart homes are usually
different in terms of vendors, but also numbers or
types, personalization of analytics, meaning the
individual composition and configuration of analytics
pipelines, is another important issue to be addressed.
Since most analytics services in smart home
environments are provided as part of an IoT platform
to many end-consumers, the architectural challenges
are also driven by platform vendors. From their
perspective, Big Data capabilities, scalable data
processing as well as data storage are needed to
handle the large number of data sources of their
customers. Moreover, the high network usage of these
smart devices needs to be addressed. From an
analytical standpoint, the flexible extension of data
processing as well as the integration of data from
different sources and of historic and real-time data
have to be possible. Additionally, data visualization
is important. The character of IoT data also demands
real-time processing and consequently stream
handling capabilities of smart home analytics
architectures.
The combination of these challenges creates a
number of limitations in the domain of smart home,
which must be mapped by analytics architectures.
Currently available approaches in this field are either
cloud-based Big Data or application-specific
solutions that lack the required flexibility with regard
to different consumer, legal or technical requirements
and constraints. Additionally, analytics scenario
requirements are not known beforehand by platform
providers or may change rapidly, thus creating the
need to allow flexible pipeline composition and
deployment. In this context, we also define our
motivational scenario, which revolves around the
forecasting of the total energy consumption of a
household and is the basis for the conducted
experiments in section 6. The total energy
consumption is based on the individual consumptions
of various electrical consumers and is measured
accordingly via smart plugs or similar. From an
analytical point of view, the composition of the
associated analytics pipeline is based on the number
of available devices and their device types.
Furthermore, it should be possible to use different
calculation types, which, however, also have different
requirements concerning available computing
resources. In this regard, especially ML algorithms
have presented promising results looking at energy
consumption forecasting accuracy (Amasyali & El-
Gohary, 2018). Finally, there are the requirements of
the residents who, for example, might want data
processing to take place on their local devices so that
their data cannot be used by third parties.
Based on the lack of suitable analytics
architectures to address the aforementioned
challenges and cover the motivational scenario (see
section 3), we have proposed a fog-based architecture
in Zschörnig et al. (2019). In this context, fog
computing describes a paradigm promoting the
computation, storage, etc. of data anywhere from the
cloud to the edge of the network (Mouradian et al.,
2018; OpenFog, 2017). It is therefore different from
the sometimes interchangeably used term “edge
computing” (Yousefpour et al., 2019), which
specifically excludes the cloud for computational as
well as related tasks and is limited to only a small
number of network layers (OpenFog, 2017).
Consequently, the fog computing paradigm aims at
combining cloud computing, edge computing and the
ICEIS 2021 - 23rd International Conference on Enterprise Information Systems
824

IoT in a new architectural paradigm (Donno et al.,
2019). In IoT use cases, the edge of the network is
synonymous with local networks, which include IoT
devices (Yousefpour et al., 2019). Therefore, fog
computing nodes may comprise edge devices, such as
gateways, access points, etc., but not IoT devices,
such as sensors and actuators (Mouradian et al., 2018;
Yousefpour et al., 2019).
Past scientific literature has interpreted fog
computing in the sense that data processing is
primarily performed on fog nodes and the cloud
performs information aggregation tasks for decision
support. In contrast, the main goal of our solution
proposal is to enable analytics pipeline deployments
along the diverging constraints of different
stakeholders. This includes hybrid analytics
pipelines, in which some processing tasks run on fog
nodes, while others are computed at the cloud layer.
The cloud-based parts of this architecture are
already discussed and evaluated in (Zschörnig,
Windolph et al., 2020a) and (Zschörnig, Windolph et
al., 2020b) and address multiple of the
aforementioned challenges. In this paper, the
components required to enable data processing at fog
nodes are further specified and the components for
message exchange between them and the cloud are
added.
3 RELATED WORK
In the last years, several architectural approaches for
data analytics in smart home environments have been
developed to facilitate different application scenarios.
In order to provide an overview of this literature, we
conducted a review following vom Brocke et al.
(2009). The results were analyzed regarding utilized
computing paradigm and application scenario.
Bhole et al. (2015) present an architecture to be
deployed on edge devices in smart homes. Their field
of application is home automation and they utilize
several different ML-based algorithms. Constant et
al. (2017) propose a fog-based architecture, which
centers around a fog gateway device. They evaluate
their approach by using smart wearable data without
limiting their approach to a specific field of
application. Popa et al. (2019) also present a fog-
based architecture for home automation, in which
deep neural networks are trained and stored in the
cloud and the resulting models are pulled and applied
by an IoT agent on an edge device. Furthermore, they
present applications for non-intrusive load
monitoring and energy load forecasting. Singh and
Yassine (2019) describe a fog analytics architecture
for energy management in households. Their fog
computing nodes main functionality involves the pre-
processing of data. Hasan et al. (2015), Al-Ali et al.
(2017) and Paredes
‐
Valverde et al. (2020) propose
cloud-based analytics architectures for energy
management. Data analytics are supported by Big
Data technologies in all approaches. Another cloud-
based analytics architecture is presented by Fortino et
al. (2015). Their main focus lies on activity
recognition in smart homes.
To sum it up, we found that none of the smart
home analytics architectures analyzed support hybrid
analytics pipeline deployments with regard to the
challenges described in section 2. Furthermore, most
of the solutions are based on rather static analytics
pipelines, which are defined a priori, thus missing
flexibility in terms of changing requirements.
4 SOLUTION PROPOSAL
In the following, we present our architectural
proposal which addresses the challenges described in
section 2. The proposal is based on previous research
of ours, which is described in Zschörnig et al. (2019).
The overall architectural model is shown in Figure 1
and was designed following the method of conceptual
modeling (Thalheim, 2012). The microservice-based
architecture contains the orchestration platform,
streaming and serving platform as well as the cloud
connector and a message broker at the cloud layer.
Furthermore, the fog platform contains several
components to be deployed at network layers, which
are located closer to the edge of the network. These
layers comprise different computational devices, such
as single-board computers, depending on the
application domain. The main goal of the approach is
to enable analytics pipelines deployments at all levels
of fog environments, from cloud to edge, but also to
allow hybrid deployments, in which data processing
tasks of a single analytics pipeline are executed at
different levels.
The central component to achieve these hybrid
deployments is the orchestration platform, which
comprises five microservices. In this regard, analytics
pipelines are instantiated from analytics flows, which
are managed via the flow repository. They are created
and updated (1) using the flow designer. Analytics
flows contain analytics operators, which are single-
purpose microservices and offer different data
transformation and processing capabilities. In the
proposed solution, analytics operators are
encapsulated
using container technology, such as
A Hybrid IoT Analytics Platform: Architectural Model and Evaluation
825
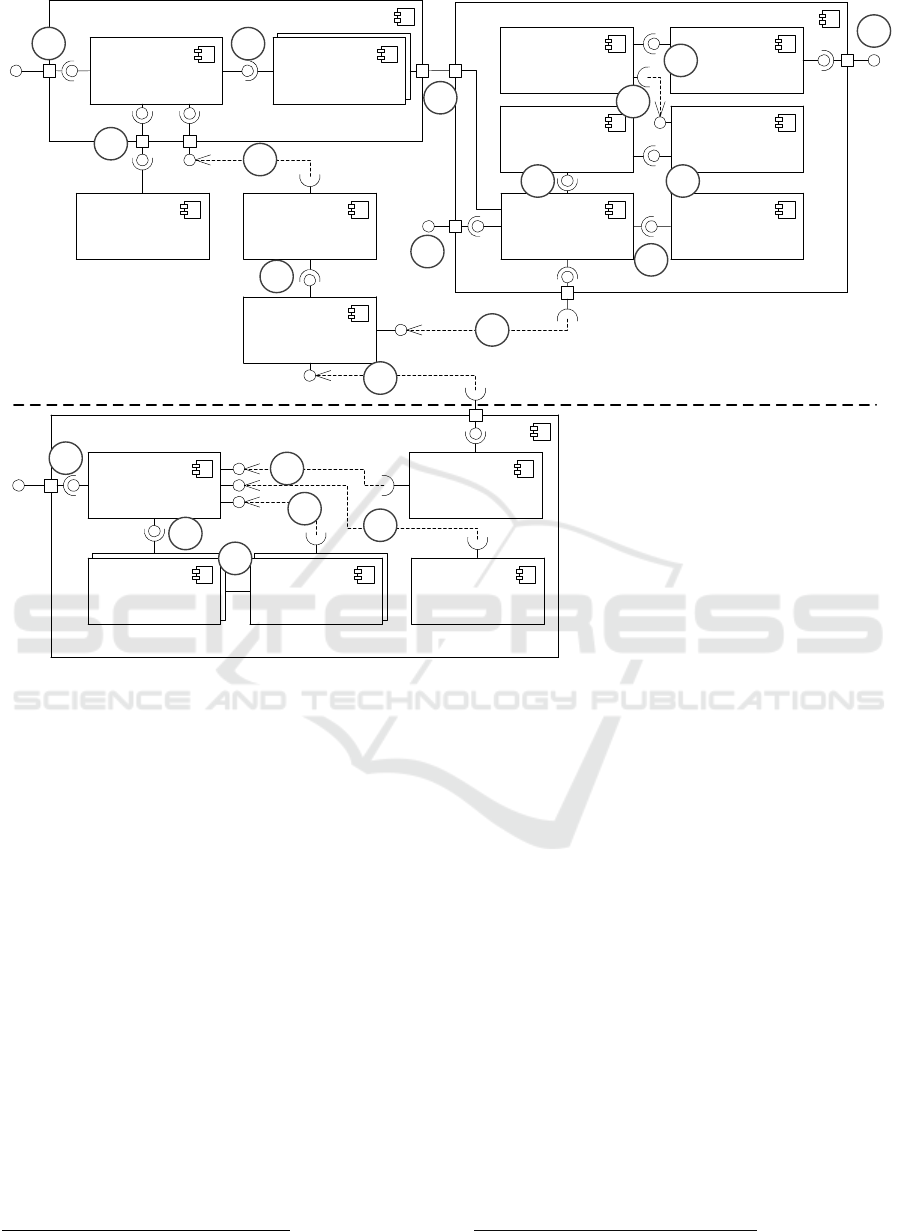
Figure 1: Proposed architectural concept, showing components and interfaces, adapted from Zschörnig et al. (2019).
Docker
1
, and their container images are saved in
either public or private repositories. Available
analytics operators are registered in the operator
repository (2) and composed into analytics flows
utilizing the flow designer (3). The data saved in the
operator repository has to include metadata about
inputs, outputs and configuration values of an
analytics operator as well as its container image
name. The deployment of an analytics pipeline is
triggered at the flow engine (4). As a first step, the list
of all analytics operators to be deployed as well as
their composition in the analytics flow is pulled from
the analytics parser (5). The analytics parser
transforms the flow data from the flow repository (6)
into a unified format usable by the flow engine.
Decoupling the flow data structure from the flow
engine extends the range of application of the overall
architecture, as it is not bound to a single modeling
notation. Successfully deployed analytics pipelines
are registered in the pipeline registry by the flow
engine and are deregistered once they are
decommissioned (7).
1
https://www.docker.com
The presented solution proposal assumes that the
orchestration platform runs in the cloud stratum
together with the streaming platform. Against this
background, all cloud-based analytics operators are
started by the flow engine by interfacing with the
underlying container orchestration management
platform (8), e.g., Kubernetes
2
.
The central component of the streaming platform
is the log data store, which is managed by a message
broker and ingests data from different sources such as
IoT device data, but also from environmental or
weather APIs (9). The cloud-based analytics
operators of an analytics pipeline consume these data
or the output of preceding analytics operators from
the log data store according to the analytics flow the
analytics pipeline is based on. Furthermore, they
produce their results back to it, both actions in
streaming fashion (10). As a result, the data streams
of all raw and processed data may be accessed at all
times and all stages of the processing scenario. Since
the approach includes only a speed layer for
processing streaming data, it promotes the advantages
2
https://kubernetes.io
Orchestration Platform
Streaming Platform
Analytics
Operator
Log Data Store
Flow
Repository
Operator
Repository
Pipeline
Registry
Flow Engine
Flow Parser
Fog Platform
Message
Broker
Analytics
Operator
Fog Agent
Cloud
Connector
2
4
Flow Designer
1
3
5 6
7
8
10
9
Serving
Platform
11
Message
Broker
Fog Connector
12
13
14
Fog Master
15
16
17
18
19
20
21
Cloud stratum
Fog stratum
ICEIS 2021 - 23rd International Conference on Enterprise Information Systems
826

of the Kappa architecture approach, which were first
described in Kreps (2014). In order to enable access
to all data for their utilization by third-party
applications or visualization, the serving platform
may consume data streams from the log data store
(11).
In case of a fog or hybrid deployment, a major
issue is the transfer of data between different network
levels. Additionally, the communication between all
management and orchestration components of the
overall architecture is a challenge. Consequently, we
introduce two message brokers as well as two
connector services with one of each deployed at the
cloud and the fog stratum. These components handle
the data transfer between the layers.
In case of a fog or hybrid analytics pipeline
deployment request, the flow engine sends the
resulting analytics operator requests to the message
broker in the cloud (12). These requests are then
pulled by the fog connector (13) and published on the
message broker in the fog platform (14) to be
consumed and processed by the fog master. The fog
master checks available fog agents and publishes
analytics operator deployment requests at a specific
topic of a single fog agent (15). The fog agent
receives (16) the request and starts deploying the
analytics operator (17). In order for this to work, the
fog agent must be deployed at a hardware platform,
which supports container execution. There may not
be more than one fog agent per fog device. Fog
Agents monitor the resource usage of the analytics
operators and report this to the fog master, which
manages analytics operator deployment requests
with respect to the available resource of a fog agent.
Similar to their cloud-based counterparts, the fog
deployed analytics operators consume IoT data
streams from the message broker as well as the results
of other deployed analytics operators according to
the analytics flow. Moreover, they publish the results
of their task at the fog message broker (18). In case of
a hybrid analytics pipeline, the results of fog analytics
operators are sent to the cloud by the fog connector,
which pushes their messages to the cloud message
broker. The cloud connector handles the bidirectional
data transfer between the cloud message broker and
the log data store. Therefore, data processed in the
cloud may be sent to the fog message broker via the
fog connector to be processed by fog analytics
operators.
3
https://github.com/SENERGY-Platform
4
https://angular.io
5
https://kafka.apache.org
6
https://kafka.apache.org/documentation/streams/
7
https://www.influxdata.com
5 PROTOTYPE
The architectural concept of section 4 is the
foundation for an integrated software prototype,
which we implemented as a proof of concept and as
the basis for experimental evaluation. All components
of the architectural implementation are open-source
software. In this regard, we have also published all
the self-written software artifacts
3
. Following the
microservice paradigm, all components of the
orchestration platform are fine-grained and loosely
coupled. Moreover, they are encapsulated using
container technology. This enhances their reusability
and mobility, which is especially important for
analytics operators, since they are usually deployed
in many different analytics pipelines.
The operator and flow repository are written in
Python and provide CRUD interfaces to interact with.
The flow engine, flow parser and pipeline registry are
written in Golang and expose CRUD interfaces as
well. The flow designer is part of a frontend
application which is implemented using the Angular
4
framework. The components of the streaming
platform are based upon the Apache Kafka
ecosystem
5
. In this context, we provide a Java library,
which is based on Kafka Streams
6
, to reduce the
complexity of implementing analytics operators. The
serving platform comprises an influxDB
7
as well as
Python-based Kafka consumer services, which relay
raw and analytics data to the serving database. The
cloud connector is written in Golang and interfaces
both, the Kafka cluster and the cloud message broker,
which is a VerneMQ
8
instance. Consequently, the
communication between all network layers relies
on MQTT
9
, which is lightweight communication
protocol and widely adopted in IoT use cases
(Yassein et al., 2017).
The orchestration components of the fog platform
(fog connector, fog agent, fog master) are
implemented in Golang. We support the development
of fog analytics operators with a Python library,
which handles their configuration and integration
with the overall analytics architecture. Concerning
the fog platform, the implementation of the
components was driven by lower resource availability
as compared to cloud environments. Therefore, we
use MQTT as the communication protocol between
all fog components and Eclipse Mosquitto
10
as the fog
message broker. Additionally, we minimized Docker
8
https://vernemq.com
9
https://mqtt.org
10
https://mosquitto.org/
A Hybrid IoT Analytics Platform: Architectural Model and Evaluation
827

image sizes by utilizing Alpine Linux
11
as their
foundation.
6 EXPERIMENTAL
EVALUATION
In this section, we describe the quantitative
evaluation of the proposed architectural solution
based on the prototype introduced in section 5. In this
regard, we have deployed the fog platform in a real
apartment, whose residents have agreed to participate
in an ongoing IoT research project of ours. The
apartment was equipped with 97 different IoT sensors
and actuators. As a result we utilized the
environment, which generated real-world energy
consumption data, to conduct four field experiments
with regard to Boudreau et al. (2001).
Beside the proof of concept, that the proposed
architecture can be used to process and analyze data
in a real-world scenario, the purpose of the
experiments is to show that it can also deploy
analytics pipelines at fog nodes as well as in a hybrid
manner. Moreover, we evaluate how different
application scenarios influence the viability of the
two deployment strategies by investigating the
latency of data processing as well as the overall
resource usage. In this regard, previous research of
ours has already shown, that the cloud components of
the proposed architecture are able to handle Big Data
problems in Smart Home environments, which might
also include ML technologies (Zschörnig, Windolph
et al., 2020a).
6.1 Experiments
Overall, we conducted four experiments, which
revolved around the energy consumption scenario we
described in section 2. Available energy consumption
data sources in the household were:
35 Gosund SP111 smart plugs which were
flashed to use the Tasmota firmware
12
version
8.3.1
1 Fibaro wall plug Type F
13
16 Fibaro Walli switches
14
Each of the Gosund smart plugs sent its current
energy consumption data every 10 seconds, the
Fibaro devices every 30 seconds. The number of
11
https://alpinelinux.org/
12
https://tasmota.github.io
13
https://www.fibaro.com/de/products/wall-plug/
smart plugs and switches was needed to cover all
electrical consumers and circuits of the apartment.
For each experiment, an analytics pipeline was
deployed, which forecasts the energy consumption of
the household for the end of the day, the end of the
month and the end of the year. The analytics pipelines
comprised three analytics operators:
Adder-Operator (AO): Calculates the total
energy consumption by adding the energy
consumption of individual sources.
Additionally, it writes the current timestamp
and an ID in the result message.
Forecast-Operator (FO): Processes the
messages from the AO and forecasts the total
energy consumption value for different dates.
Latency-Operator (LO): Calculates the latency
between the start and the end of the processing
of a message by consuming the messages of
the FO.
In order to compare different deployment
strategies as well as application scenarios, we
implemented four versions of the FO. Two as fog
(deployed at a fog node) and two as cloud analytics
operators. For every deployment layer, one of the
FOs was implemented using a simple, updating linear
regression based on Klotz (1995). The other one was
implemented utilizing the adaptive random forest
regressor, which is an online-ML algorithm based on
the work of Gomes et al. (2017). Consequently, the
result was four different experiments, which
corresponded to the four analytics pipelines
compositions:
Experiment 1 (E1): A fog-only analytics
pipeline with updating linear regression
forecasting,
Experiment 2 (E2): a fog-only analytics pipeline
with adaptive random forest regressor
forecasting,
Experiment 3 (E3): a hybrid analytics pipeline
with updating linear regression forecasting,
Experiment 4 (E4): a hybrid analytics pipeline
with adaptive random forest regressor
forecasting.
During E1 and E2, all data was processed at the
fog layer. In contrast, during E3 and E4, the data was
sent from the AO at the fog layer to the cloud layer,
processed by the FO and relayed back to LO at the
fog layer. The design of the experiments with the LO
at the end of the analytics pipeline simulates a
possible actuator, which is triggered based on the
results of the FO.
14
https://www.fibaro.com/de/products/smart-switches-
and-outlets/
ICEIS 2021 - 23rd International Conference on Enterprise Information Systems
828
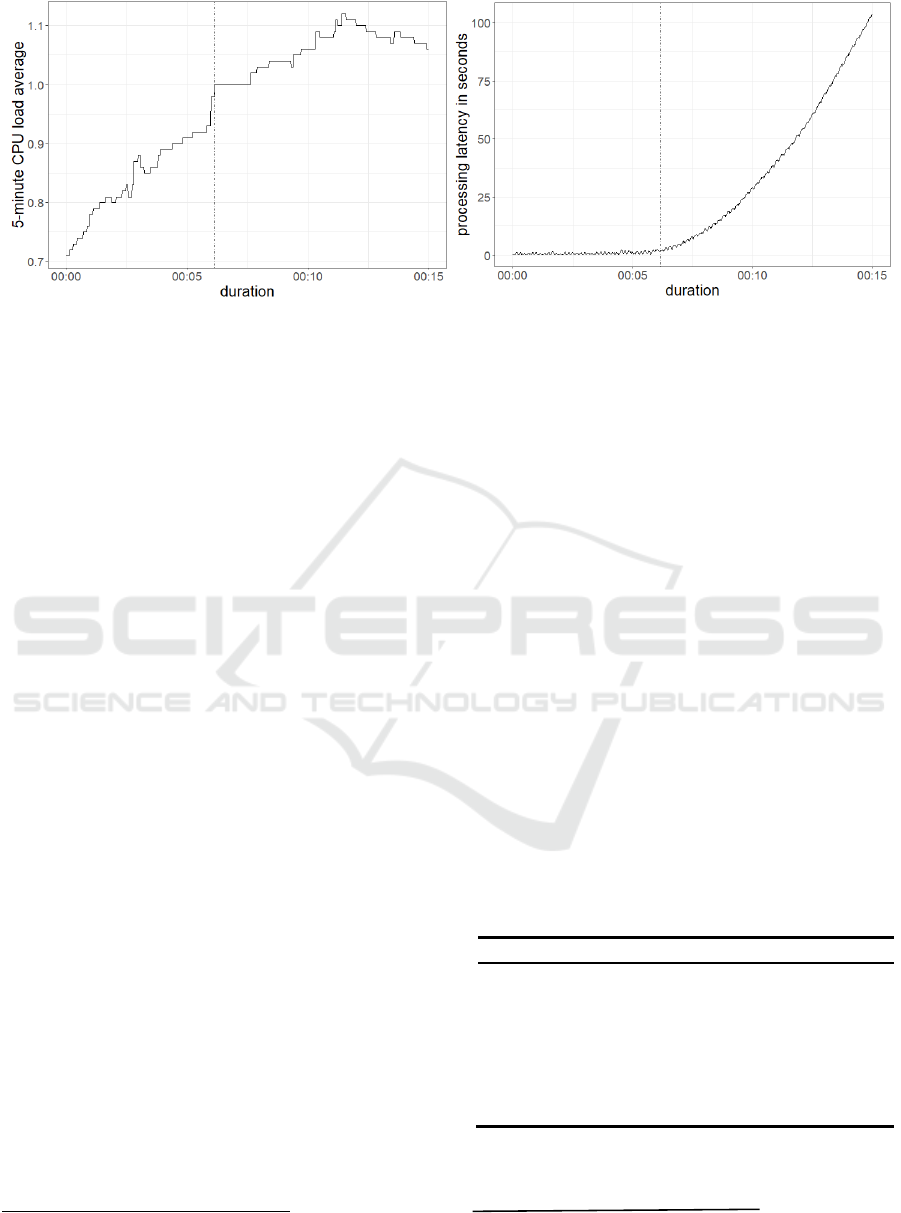
Figure 2: 5-minute CPU load average (left) and overall processing latency (right) of the Raspberry Pi during experiment 2.
The datapoint when a 5-minute CPU load average of 1 is reached is marked with a vertical line in both graphs.
6.2 System Setup & Deployment
All components of the cloud layer, including cloud
analytics operators, were deployed at a private cloud
datacenter. The cluster comprises 18 virtual machines
with 8 CPU kernels, 64 GB RAM and 256 GB of
solid-state storage, each. The underlying hypervisors
use XEON E5 CPU cores. The cloud components ran
as Docker containers on Kubernetes version 1.16.8 as
the container orchestration platform with Rancher
version 2.4.8 as the management frontend.
The components of the fog platform were
deployed on two Raspberry Pi 3, Model B Plus (Rev
1.3)
15
. The Docker version on both computers was
19.03.13. The fog agent was deployed solely on one
of the computers so that the measurements were not
distorted by further services. As a result, all fog
analytics operators ran on this computer as well.
6.3 Metrics & Methodology
We measured the overall processing latency of an
analytics pipeline as well as CPU load and memory
usage of the hardware, on which the analytics
operators were deployed. The processing latency was
measured by adding the current timestamp to each
message at the beginning of the processing by the
AO. At the end of an analytics pipeline the LO took
this timestamp and the now-current one and
calculated the time difference. CPU load and memory
usage of the fog analytics operators were gathered by
using the system performance analysis toolkit
Performance Co-Pilot
16
. Additionally, the cloud CPU
and memory metrics were collected using the cluster
monitoring tools of Rancher.
15
https://www.raspberrypi.org/products/raspberry-pi-3-
model-b-plus/
Each experiment was performed for one hour.
Due to the constant number of messages emitted by
the devices, the behavior of the observed metrics did
not change by prolonging the investigation period.
This was confirmed by preliminary experiments. Due
to the consistent character of the data, the first
15 minutes of the total data set were selected and
examined. This time frame included around
3500 messages emitted by the smart devices for each
experiment.
6.4 Experimental Results
The summary of the results of all experiments
regarding the overall processing latency are presented
in Table 1. The lowest mean (0.015 seconds) and
median (0.015 seconds) latency were observed during
E1. Experiment 3, in which the same processing
algorithm was used, but executed in the cloud, shows
an average latency of 0.603 seconds with a median of
0.618 seconds.
Table 1: Summary of the measured processing latency for
the first 15 minutes of all experiments in seconds.
Metric E1 E2 E3 E4
Min. 0.013 0.163 0.114 0.122
Q
0.05
0.013 0.283 0.264 0.270
Median 0.015 3.709 0.603 0.604
Mean 0.015 20.810 0.618 0.626
Q
0.95
0.018 86.863 0.959 0.990
Q
0.95
-Q
0.05
0.005 86.580 0.695 0.720
Max. 0.037 103.600 3.359 3.323
Experiment 2, using a more complex online ML
algorithm, shows the highest latency of all
16
https://pcp.io
A Hybrid IoT Analytics Platform: Architectural Model and Evaluation
829

experiments with an average of 20.81 seconds and a
median of 3.709 seconds. The results of E4
correspond approximately to those of E3 with an
average of 0.626 seconds and a median of
0.604 seconds.
The summary of the results of all experiments
with respect to 5-minute CPU load average and
memory usage of the Raspberry Pi are shown in Table
2 and Table 3. The highest resource usage was
observed during E2 with an average CPU load of
0.976 (median=1.03) and an average memory usage
of 228 megabytes (MB) (median=228 MB). The
second highest resource usage was recorded during
E1 with an average CPU load of 0.12 (median=0.124)
and an average memory usage of 179 MB
(median=179 MB).
Table 2: Summary of the measured 5-minute CPU load
average of the Raspberry Pi for the first 15 minutes of all
experiments.
Metric E1 E2 E3 E4
Min. 0.060 0.710 0.050 0.040
Q
0.05
0.070 0.750 0.060 0.040
Median 0.120 1.030 0.100 0.060
Mean 0.124 0.976 0.107 0.065
Q
0.95
0.200 1.100 0.180 0.110
Q
0.95
-Q
0.05
0.130 0.350 0.120 0.070
Max. 0.220 1.120 0.200 0.120
Table 3: Summary of the measured memory usage of the
Raspberry Pi for the first 15 minutes of all experiments in
megabytes.
Metric E1 E2 E3 E4
Min. 177 227 161 162
Q
0.05
179 228 161 162
Median 179 228 161 162
Mean 179 228 162 162
Q
0.95
180 230 162 162
Q
0.95
-Q
0.05
1 2 1 0
Max. 180 230 162 162
The 5-minute CPU load of the Raspberry Pi was
at an average 0.107 (median=0.1) for E3 and 0.065
(median=0.06) for E4. The average memory usage
was at 162 MB (median=161 MB) for E3 and at
162 MB (median=162 MB) for E4. Additionally, we
gathered the 1-minute CPU load and memory usage
of the cloud operator, which was at an average 0.014
(median=0.014) and 156 MB (median=155 MB) for
E3. For E4, the average cloud operator one-minute
CPU load was at 0.034 (median=0.0314) and the
memory usage at 185 MB (median=185 MB).
Regarding the overall processing latency, the
quantile distance between Q
0.05
(5% quantile) and
Q
0.95
(95% quantile) is 100 times larger for E2 than
for the other experiments and 3 to 6 times higher
regarding the 5-minute CPU load. This shows, that
the latency and resource usage remained at a steady
level throughout experiments 1, 3 and 4. During E2,
the memory usage also stayed constant throughout the
experiment, but CPU load and overall processing
latency increased (Figure 2). While the 5-minute CPU
load average increased from the beginning and then
remained between 1.0 and 1.1, the processing latency
only increased once the 5-minute CPU load average
was above 1.
6.5 Discussion
Regarding the results of the experiments, we
conclude, that fog-only analytics pipelines
deployments result in a lower processing latency at
the cost of higher resource usage of the utilized edge
devices. In contrast, more complex computations, for
example ML-based algorithms, may require too much
resources from edge devices. This is supported by the
results of E2, which show an increase of the
processing latency, once the CPU load crosses a
certain threshold. Experiments 3 and 4 provide
insights into the nature of hybrid deployments. Since
the measured latencies are almost the same in both
experiments, we conclude that the complexities of the
overall analytics pipelines are minor factors to
consider, because resource-intensive task may be
offloaded to the cloud. This further highlights the
relevance of hybrid deployments and addresses the
challenge of limited computing resources in smart
home environments.
While the results of the experiments seem trivial
at first glance, they confirm the relevance of the
proposed architectural solution, which before only
theoretically existed. In this context, the experiments
carried out exemplify that the architecture is
technically capable of executing analytics pipelines
that result from different requirements. This can be
transferred to other types of requirements, which may
be driven by data privacy concerns of residents or the
legislation in the operational area as laid out in section
2. Therefore, future research in this area should
investigate to what extent these requirements can be
mapped and provided so that deployment decisions
can be made automatically.
The implementation of the proposed architecture
and the conducted experiments serve as a proof of
concept and highlight its ability to deploy hybrid
analytics pipelines in smart home environments.
ICEIS 2021 - 23rd International Conference on Enterprise Information Systems
830

Furthermore, the relevance of the approach is shown
by its successful implementation in real-world
environment. This in itself addresses the privacy and
security challenge, as it provides the opportunity to
deploy an analytics operator as a first control point for
privacy-sensitive data (Chiang & Zhang, 2016). The
presented fog-only experiments indicate the resilience
of the architecture against network connection losses.
Looking at the non-existing network traffic for fog-
only analytics pipelines, the network usage is reduced
from a platform providers viewpoint.
Concerning the internal validity of our results, we
recognize, that the results of our experiments may
differ based on several factors. These are general
network latency between cloud and fog nodes, local
network usage, but also the utilization of cloud and
fog resources by other processes during the execution
of the experiments. On the other hand, the
reproducibility was increased through the usage of
open-source software and a widely available and
utilized computing platform as the fog node. Finally,
the field experiments carry a high external validity,
since they were conducted in a real-world setting and
the included IoT devices were consumer hardware.
7 CONCLUSION & OUTLOOK
In this paper, we propose a fog-based analytics
architecture, which enables hybrid analytics pipeline
deployments in smart home environments. In this
regard, we provide background information about the
research area, a motivational scenario and lay out the
reasons behind this research. Furthermore, an
overview about similar works in existing scientific
literature is given. The architectural model is based
on previous works of ours and utilizes the
microservice paradigm to structure architectural
components. The presented architecture is the
technical basis for the implementation of individual
analytics pipelines in smart home environments,
which are based on the requirements of different
stakeholders. The components of the proposed
architecture as well as their interactions with each
other are presented in a conceptual model, which is
the basis for a prototypical implementation. This
prototype serves as a proof of concept and was further
utilized to perform four field experiments in a real-
world smart home environment. The results of the
experiments show that the architectural approach is
capable of mapping different deployment scenarios
and thus makes it possible to engage the requirements
of different stakeholders.
Future research regarding this field needs to
investigate, how the requirements of different interest
groups in smart home environments, but also technical
constraints, can be modeled, mapped and structured.
Furthermore, deployment preferences may be derived
from legal or social sources. The resulting data could
be used as the foundation for self-learning analytics
pipeline deployment systems. Finally, these concepts
should yield software components to be integrated in
the presented architecture in order to enable
deployment decision support.
ACKNOWLEDGEMENTS
The work presented in this paper is partly funded by
the European Regional Development Fund (ERDF)
and the Free State of Saxony (SAB 100338771 and
100400223) as well as by the German Federal
Ministry of Education and Research (BMBF
01IS20033B).
REFERENCES
451 Research. (2019). Drivers of Internet of Things (IoT)
spending worldwide as of 2019.
https://www.statista.com/statistics/1079622/iot-
spending-drivers-worldwide/
Al-Ali, A. R., Zualkernan, I. A., Rashid, M., Gupta, R., &
Alikarar, M. (2017). A smart home energy management
system using IoT and big data analytics approach. IEEE
Transactions on Consumer Electronics, 63(4), 426–
434. https://doi.org/10.1109/TCE.2017.015014
Amasyali, K., & El-Gohary, N. M. (2018). A review of
data-driven building energy consumption prediction
studies. Renewable and Sustainable Energy Reviews,
81, 1192–1205. https://doi.org/10.1016/j.rser.2017.04.
095
Bhole, M., Phull, K., Jose, A., & Lakkundi, V. (2015).
Delivering analytics services for smart homes. In 2015
IEEE Conference on Wireless Sensors (ICWiSe)
(pp. 28–33). IEEE. https://doi.org/10.1109/ICWISE.
2015.7380349
Boudreau, M.C., Gefen, D., & Straub, D. W. (2001).
Validation in Information Systems Research: A State-
of-the-Art Assessment. MIS Quarterly, 25(1), 1.
https://doi.org/10.2307/3250956
Chiang, M., & Zhang, T. (2016). Fog and IoT: An
Overview of Research Opportunities. IEEE Internet of
Things Journal, 3(6), 854–864. https://doi.org/10.1109/
JIOT.2016.2584538
Constant, N., Borthakur, D., Abtahi, M., Dubey, H., &
Mankodiya, K. (2017). Fog-Assisted wIoT: A Smart
Fog Gateway for End-to-End Analytics in Wearable
Internet of Things. http://arxiv.org/pdf/1701.08680v1
A Hybrid IoT Analytics Platform: Architectural Model and Evaluation
831

Donno, M. de, Tange, K., & Dragoni, N. (2019).
Foundations and Evolution of Modern Computing
Paradigms: Cloud, IoT, Edge, and Fog. IEEE Access, 7,
150936–150948. https://doi.org/10.1109/ACCESS.
2019.2947652 (IEEE Access, 7, 150936-150948).
Fortino, G., Giordano, A., Guerrieri, A., Spezzano, G., &
Vinci, A. (2015). A Data Analytics Schema for Activity
Recognition in Smart Home Environments. In J. M.
García-Chamizo, G. Fortino, & S. F. Ochoa (Eds.),
Lecture Notes in Computer Science. Ubiquitous
Computing and Ambient Intelligence. Sensing,
Processing, and Using Environmental Information (Vol.
9454, pp. 91–102). Springer International Publishing.
https://doi.org/10.1007/978-3-319-26401-1_9
Gomes, H. M., Bifet, A., Read, J., Barddal, J. P.,
Enembreck, F., Pfharinger, B., Holmes, G., &
Abdessalem, T. (2017). Adaptive random forests for
evolving data stream classification. Machine Learning,
106(9-10), 1469–1495. https://doi.org/10.1007/s10994-
017-5642-8
Hasan, T., Kikiras, P., Leonardi, A., Ziekow, H., &
Daubert, J. (2015). Cloud-based IoT Analytics for the
Smart Grid: Experiences from a 3-year Pilot. In D. G.
Michelson, A. L. Garcia, W.-B. Zhang, J. Cappos, & M.
E. Darieby (Chairs), Proceedings of the 10th
International Conference on Testbeds and Research
Infrastructures for the Development of Networks &
Communities (TRIDENTCOM), Vancouver, Canada.
Klotz, J. H. (1995). Updating simple Linear Regression.
Statistica Sinica, 5(1), 399–403.
http://www.jstor.org/stable/24305577
Kreps, J. (2014). Questioning the Lambda Architecture:
The Lambda Architecture has its merits, but
alternatives are worth exploring.
https://www.oreilly.com/ideas/questioning-the-
lambda-architecture
Mouradian, C., Naboulsi, D., Yangui, S., Glitho, R. H.,
Morrow, M. J., & Polakos, P. A. (2018). A
Comprehensive Survey on Fog Computing: State-of-
the-Art and Research Challenges. IEEE
Communications Surveys & Tutorials, 20(1), 416–464.
https://doi.org/10.1109/COMST.2017.2771153
OpenFog. (2017). OpenFog Reference Architecture for Fog
Computing.
Paredes ‐ Valverde, M. A., Alor ‐ Hernández, G.,
García ‐ Alcaráz, J. L., Del Salas ‐ Zárate, M. P.,
Colombo ‐ Mendoza, L. O., & Sánchez ‐
Cervantes, J. L. (2020). IntelliHome: An internet of
things‐based system for electrical energy saving in
smart home environment. Computational Intelligence,
36(1), 203–224. https://doi.org/10.1111/coin.12252
Popa, D., Pop, F., Serbanescu, C., & Castiglione, A. (2019).
Deep learning model for home automation and energy
reduction in a smart home environment platform. Neural
Computing and Applications, 31
(5), 1317–1337.
https://doi.org/10.1007/s00521-018-3724-6
Singh, S., & Yassine, A. (2019). Iot Big Data Analytics
with Fog Computing for Household Energy
Management in Smart Grids. In A.-S. K. Pathan, Z. M.
Fadlullah, & M. Guerroumi (Eds.), Lecture Notes of the
Institute for Computer Sciences, Social Informatics and
Telecommunications Engineering: Vol. 256. Smart
Grid and Internet of Things: Second EAI International
Conference, SGIoT 2018, Niagara Falls, ON, Canada,
July 11, 2018, Proceedings (Vol. 256, pp. 13–22).
Springer International Publishing.
https://doi.org/10.1007/978-3-030-05928-6_2
Siow, E., Tiropanis, T., & Hall, W. (2018). Analytics for
the Internet of Things. ACM Computing Surveys, 51(4),
1–36. https://doi.org/10.1145/3204947
Statista. (2020, November 9). Number of Smart Homes
forecast worldwide from 2017 to 2025 (in millions).
https://www.statista.com/forecasts/887613/number-of-
smart-homes-in-the-smart-home-market-worldwide
Thalheim, B. (2012). The Science and Art of Conceptual
Modelling. In A. Hameurlain (Ed.), Lecture notes in
computer science Journal subline: Vol. 7600. Special
issue on database and expert systems applications (Vol.
7600, pp. 76–105). Springer. https://doi.org/10.1007/
978-3-642-34179-3_3
vom Brocke, J., Simons, A., Niehaves, B., Riemer, K.,
Plattfaut, R., & Cleven, A. (2009). Reconstructing the
Giant: On the Importance of Rigour in Documenting
the Literature Search Process. 17th European
Conference on Information Systems, Verona, Italy.
http://aisel.aisnet.org/ecis2009/161/
Yassein, M. B., Shatnawi, M. Q., Aljwarneh, S., & Al-
Hatmi, R. (2017). Internet of Things: Survey and open
issues of MQTT protocol. In 2017 International
Conference on Engineering & MIS (ICEMIS’2017):
University of Monastir, Monastir, Tunisia, 08-10 May,
2017: Proceedings (pp. 1–6). IEEE.
https://doi.org/10.1109/ICEMIS.2017.8273112
Yousefpour, A., Fung, C., Nguyen, T., Kadiyala, K.,
Jalali, F., Niakanlahiji, A., Kong, J., & Jue, J. P.
(2019). All one needs to know about fog computing and
related edge computing paradigms: A complete survey.
Journal of Systems Architecture, 98, 289–330.
https://doi.org/10.1016/j.sysarc.2019.02.009
Zschörnig, T., Wehlitz, R., & Franczyk, B. (2019). A Fog-
enabled Smart Home Analytics Platform. In
Proceedings of the 21st International Conference on
Enterprise Information Systems (pp. 616–622).
SCITEPRESS - Science and Technology Publications.
https://doi.org/10.5220/0007750006160622
Zschörnig, T., Wehlitz, R., & Franczyk, B. (2020). IoT
Analytics Architectures: Challenges, Solution
Proposals and Future Research Directions. In F.
Dalpiaz, J. Zdravkovic, & P. Loucopoulos (Eds.),
Lecture Notes in Business Information Processing.
Research Challenges in Information Science (Vol. 385,
pp. 76–92). Springer International Publishing.
https://doi.org/10.1007/978-3-030-50316-1_5
Zschörnig, T., Windolph, J., Wehlitz, R., & Franczyk, B.
(2020a). A Cloud-based Analytics Architecture for the
Application of Online Machine Learning Algorithms
on Data Streams in Consumer-centric Internet of
Things Domains. In Proceedings of the 5th
International Conference on Internet of Things, Big
Data and Security
(pp. 189–196). SCITEPRESS -
ICEIS 2021 - 23rd International Conference on Enterprise Information Systems
832

Science and Technology Publications.
https://doi.org/10.5220/0009339501890196
Zschörnig, T., Windolph, J., Wehlitz, R., & Franczyk, B.
(2020b). A Cloud-based Analytics-Platform for User-
centric Internet of Things Domains – Prototype and
Performance Evaluation. In T. Bui (Ed.), Proceedings
of the Annual Hawaii International Conference on
System Sciences, Proceedings of the 53rd Hawaii
International Conference on System Sciences. Hawaii
International Conference on System Sciences.
https://doi.org/10.24251/HICSS.2020.808
A Hybrid IoT Analytics Platform: Architectural Model and Evaluation
833
