
Time Series Segmentation for Driving Scenario Detection with Fully
Convolutional Networks
Philip Elspas
1
, Yannick Klose
1
, Simon Isele
1
, Johannes Bach
1
and Eric Sax
2
1
Dr. Ing. h.c. F. Porsche AG, Weissach, Germany
2
FZI Research Center for Information Technology, Karlsruhe, Germany
Keywords:
Scenario Detection, Data-Driven Development, Time Series Segmentation, Fully Convolutional Networks,
Driving Scenarios.
Abstract:
Leveraging measurement data for Advanced Driver Assistant Systems and Automated Driving Systems re-
quires reliable meta information about covered driving scenarios. With domain expertise, rule-based detectors
can be a scalable way to detect scenarios in large amounts of recorded data. However, rules might struggle
with noisy data, large number of variations or corner cases and might miss valuable scenarios of interest.
Finding missing scenarios manually is challenging and hardly scalable. Therefore we suggest to complement
rule-based scenario detection with a data-driven approach. In this work rule-based detections are used as la-
bels to train Fully Convolutional Networks (FCN) in a weakly supervised setup. Experiments show, that FCNs
generalize well and identify additional scenarios of interest. The main contribution of this paper is twofold:
First, the scenario detection is formulated as a time series segmentation problem and the capability to learn a
meaningful scenario detection is demonstrated. Secondly, we show how the disagreement between the rule-
based method and the learned detection method can be analyzed to find wrong or missing detections. We
conclude, that the FCNs provide a scalable way to assess the quality of a rule based scenario detection without
the need of large amounts of ground truth infromation.
1 INTRODUCTION
With increasing capabilities of Advanced Driver As-
sistant Systems (ADAS) and Automated Driving Sys-
tems (ADS), recorded driving data becomes an es-
sential aspect for data-driven development processes
(Bach et al., 2017b). Before testing new features in
costly measurement campaigns, recorded data can be
used to gain a better understanding of relevant situa-
tions, detailing required test cases or testing functions
by re-simulation (Bach et al., 2017a). With advances
in machine learning, also function development itself
can leverage large amounts of data. For example,
imitation learning can be used to learn directly from
recorded human driving (Bansal et al., 2019). How-
ever, safety is still an issue in the domain of automated
driving (Wood et al., 2019).
For state of the art development processes, the
Automotive Software Process Improvement and Ca-
pability dEtermination (ASPICE) reference model
demands specification of system requirements that
are validated with corresponding system qualification
tests (VDA QMC Working Group 13 / Automotive
SIG, 2015). Defining driving scenarios in a formal
way is of great interest in current research as a trace-
able way to match requirements with concrete test
cases (Menzel et al., 2018; Bach et al., 2017c; Sippl
et al., 2019; Bock et al., 2019). One aspect of a sce-
nario based development process is the identification
of scenarios in recorded driving data (Elspas et al.,
2020). Due to the large number of possible scenarios
and huge amounts of recorded data, automated and
scalable methods are needed to match scenarios of in-
terest with slices of recorded data covering those.
Scenarios are often defined on an abstract level.
Arbitrary interactions between different traffic partic-
ipants and the traffic infrastructure can be used to de-
scribe scenarios. However, some interactions can be
challenging to identify in recorded data. Information
is restricted by the perception range and precision,
and are prone to noise and uncertainty. While sim-
ple rules allow identifying basic scenarios, some vari-
ations might be missed or detected wrongly. Partic-
ularly, missing detections can lead to a oversimplifi-
cation during the development process and cause mal-
functions. However, finding missing detections (False
56
Elspas, P., Klose, Y., Isele, S., Bach, J. and Sax, E.
Time Series Segmentation for Driving Scenario Detection with Fully Convolutional Networks.
DOI: 10.5220/0010404700560064
In Proceedings of the 7th International Conference on Vehicle Technology and Intelligent Transport Systems (VEHITS 2021), pages 56-64
ISBN: 978-989-758-513-5
Copyright
c
2021 by SCITEPRESS – Science and Technology Publications, Lda. All rights reserved

Negatives) and wrong detections (False Positives) be-
comes a major effort with increasing amounts of data.
Another way for scenario detection are machine
learning methods, which enjoy great popularity in a
broad range of domains. Machine Learning shows
strengths in leveraging large amounts of data, unless
the availability of labeled training data is a bottleneck
and limitation. In this work we suggest a combina-
tion of a rule-based approach, with a FCN for sce-
nario detection in multivariate time series. The rule-
based approach is used to create datasets of labeled
data, which is used to train a FCN in a weakly su-
pervised setting. With this approach we leverage the
availability of recorded driving data along with the
reasonable quality of rule-based detectors. As label-
ing is done programmatically, datasets can be created
and adapted quickly. We observe that the FCNs do
not perfectly replicate the rule-based detections, but
generalize well and find missing labels. Exploring the
deviations of the rule-based and the learned scenario
detection provides a systematic approach to find ad-
ditional scenarios of interest. In an iterative process
these scenarios of interest can be used to improve the
reliability of scenario detection.
We start this work with an overview of the state
of the art in scenario detection, data programing and
time series segmentation. In Section 3, we discuss
the formulation of the scenario detection problem and
adapt a FCN architecture, as commonly used for im-
age segmentation, to be used for multivariate time
series. Section 4 covers training and experiments
to learn a model to detect lane changes and cut-ins.
We evaluate additionally found and missing scenar-
ios, which reveals good generalization capabilities.
Manually labeled scenarios are used to verify the sug-
gested method. Finally, in Section 5 we discuss our
findings and give an outlook on future work.
2 STATE OF THE ART
While simulation becomes more and more important
in the development of ADAS and ADS, real world
testing, offering the highest possible validity, still re-
mains necessary. Virtualization is not yet capable to
fully compensate real world variations. To identify
the covered scenarios within a given large data collec-
tion, automated scenario detection is a major concern.
Domain knowledge can be expressed with context-
free grammars (Lucchetti et al., 2016) or with regu-
lar expressions (Elspas et al., 2020) as rule-based ap-
proaches of scenario detection. Unsupervised learn-
ing can be used to identify scenarios as repeating
patterns in recorded data. Recent work in (Langner
et al., 2019) and (Montanari et al., 2020), suggests
that found clusters can match well with different driv-
ing situations. In (Ries et al., 2020) word embed-
dings were used to compare driving states in a lower-
dimensional space. However, it remains challenging
to match requirements and formally defined scenarios
to real world driving data.
A paradigm to tackle the bottleneck of labeled
data for supervised learning was introduced as data
programming (Ratner et al., 2016). Experts are en-
couraged to define heuristic labeling functions while
noisy labels are derived by the agreement or disagree-
ment of multiple labeling functions. Discriminative
models can be trained on such programmatically gen-
erated labels to leverage generalization capabilities of
neural networks in a weakly supervised setup. In this
work, we incorporate the basic paradigm of program-
matic labeling functions to train discriminative mod-
els for scenario detection. However, assumptions on
conditionally independent labeling functions to learn
generative models (Ratner et al., 2016) seem hardly
applicable to the given domain. Time series are tem-
poral dependent and the underlying information for
scenario detection, like object lists, are strongly cor-
related.
With the availability of labeled data, supervised
learning can be used to detect scenarios. In the con-
text of time series, e.g. the loggings from the bus
interfaces of a vehicle, various problem formulations
can be used: Fu (Fu, 2011) distinguishes between rep-
resentation and indexing, similarity measure, segmen-
tation, visualization, and mining. The general capa-
bilities of deep neural networks for time series clas-
sification tasks were shown in (Wang et al., 2017)
and (Fawaz et al., 2019). Classically, segmentation
of time series deals with finding the best representa-
tion of the time series with respect to a given number
of segments or a given error function (Keogh et al.,
2004). While semantic segmentation with deep con-
volutional networks is widely used for computer vi-
sion, e.g. (Ronneberger et al., 2015), semantic seg-
mentation of time series is less popular. However,
the successful application of semantic time series seg-
mentation was demonstrated for sleep staging (Per-
slev et al., 2019).
3 TIME SERIES SEGMENTATION
FOR DRIVING SCENARIOS
In this work, we use loggings from the bus interface
of the vehicle’s communication network. Due to the
highly distributed electronics architecture in current
vehicles, the bus loggings provide comprehensive in-
Time Series Segmentation for Driving Scenario Detection with Fully Convolutional Networks
57

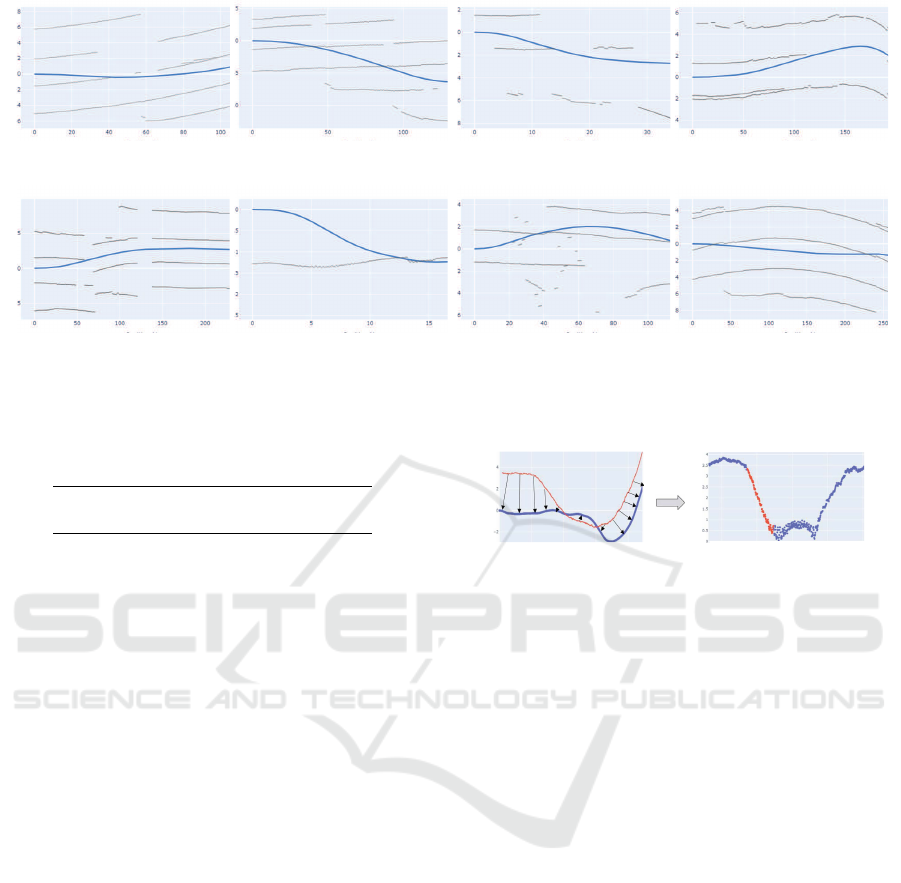
Figure 1: Scenario detection as a semantic segmentation
problem of multivariate time series.
formation for scenario detection. From the data per-
spective the bus loggings are multivariate time series.
The data preprocessing includes a use-case specific
selection of relevant signals and upsampling to a fixed
sampling rate. Detected scenarios are represented as a
list of scenario tuples s = (l, t
s
, t
e
, m) with a semantic
label l, start time t
s
, end time t
e
, and a reference to the
corresponding measurement m. As a varying number
of scenarios can occur within a measurement, a di-
rect prediction with neural networks is not well condi-
tioned. Instead we suggest a two step procedure: We
estimate a scenario probability for each time step and
extract the scenario by identifying consecutive time
steps with a high scenario probability.
Figure 1 shows a multivariate time series as in-
put data with binary scenario labels. As each point in
time can indicate the presence or absence of one or
multiple scenarios of interest, the problem becomes
a semantic segmentation problem similar to semantic
image segmentation, where each pixel is assigned to
one out of n semantic classes. However, we do not
demand disjunct classes to support potentially simul-
taneous and overlapping scenarios.
3.1 Dataset Creation
For supervised learning, labeled data is a common
bottleneck. Manual labeling becomes infeasible with
growing amounts of data and potentially changing re-
quirements. Therefore, we use a programmatic label-
ing approach. With numerical and Boolean expres-
sions, multivariate signals are combined to a single,
univariate time series of relevant states. Thereafter,
regular expressions are used to find a pattern of state
changes. These two steps provide a flexible and ex-
pressive way to describe patterns that are associated
with a scenarios of interest.
With such a rule-based labeling approach we do
not expect perfect ground truth labels. But, as our
experiments suggest, the label quality is sufficient
to learn a meaningful scenario detection. Since no
manual labeling is needed, the detection rules can be
adapted and we were able to create datasets quickly
and on demand.
Figure 2: Structural overview of the neural network archi-
tecture.
3.2 Neural Network Architecture
While recurrent neural networks are commonly used
for time series, we follow the argumentation in (Per-
slev et al., 2019), that recurrent networks are often
difficult to optimize and can be replaced by feed-
forward networks for many tasks, as shown in (Bai
et al., 2018) and (Chen and Wu, 2017). As the sce-
nario detection in recorded data is an offline prob-
lem, the scenario classification for time step can be
based on past and future data points. A complete time
sequence can be directly fed into the model and no
recurrent units are needed to cover the dimension of
time.
Based on the success of Fully Convolutional Net-
works (FCN) for semantic image segmentation, we
adapt the popular U-Net architecture (Ronneberger
et al., 2015) for multivariate time series, as shown in
Figure 2. We replace 2D-Convolution layers by 1D-
Convolutions along the time domain. Due to the fully
convolutional architecture, the network can be applied
to input sequences of different lengths. Furthermore,
we keep the basic principles of an encoder block to re-
duce the resolution of the time series, bottleneck lay-
ers to add further depth, and a decode layer to restore
the original temporal resolution of the input.
The encoder consists of n
enc
downsampling blocks
with strided convolutions (Springenberg et al., 2015)
in each second convolutional layer. The bottleneck
layer consists of n
bot
residual blocks to avoid vanish-
ing gradients (He et al., 2016). The decoder restores
the original temporal resolution with n
dec
= n
enc
up-
sampling blocks with an interpolation layer followed
by a convolution layer. All layers in the network use
ReLU as activation, only the final layer uses the sig-
moid function. Finally, the network is trained with the
binary cross entropy as loss function using stochastic
gradient descent with momentum.
VEHITS 2021 - 7th International Conference on Vehicle Technology and Intelligent Transport Systems
58

Figure 3: Schematic representation of the overlapping se-
quences of the rule-based detector and the neural network.
3.3 Event based Evaluation
In the context of driving scenarios, exact start and end
points are often unprecise. For example the start of a
lane change could be chosen as the first movement
towards the lane markings or, more conservatively,
the first time the lane marking is crossed. Noisy data
makes sharp start and end times further unpractical.
Therefore, we suggest an event based evaluation of
the detected scenarios: Instead of evaluating the cor-
rect detection for each time step, we summarize con-
secutive time steps with the same scenario label and
evaluate the number of correctly detected events. So
the evaluation consists of two steps: First we trans-
form the time series into events. By filtering events
with implausible short duration we avoid model un-
certainty to cause large numbers of false positive de-
tections. Secondly, we find matching events between
the set of all detections S from the rule-based ap-
proach and the detections M from the learned model.
As shown in Figure 3, we get a set of matching events
S ∩ M that were identified by both approaches, a set
S ∩ ¬M not found by the learned model, and a set
¬S ∩ M not found by the rule-based approach. Com-
monly, the terms True Positives (TP), False Positives
(FP) and False Negatives (FN) are used for these sets
respectively. However, due to the weak supervision
setup, we avoid these terms to stress that the train-
ing labels do not represent ground truth information.
High Precision and Recall indicate that the learned
model can reproduce the rule-based detections, but do
not assess the quality of the scenario detection. In-
stead, we explicitly investigate the additional detec-
tions ¬S ∩ M and the missing ones S ∩ ¬M from the
rule-based detection as a systematic approach to iden-
tify FP and FN respectively.
4 DRIVING SCENARIO
DETECTION
We use the proposed concept for the detection of two
basic driving scenarios: lane changes and cut-ins.
This section describes how we generate the training
set and chose hyperparameters for the FCN model,
before we evaluate the learning results and verify
those.
For our experiments we use 105 hours of bus log-
gings from 9 cars of 3 different models. The record-
ing was done during 16 days in 4 different countries.
For scenario detection we rely on information from
the inertial measurement unit, the ego velocity and
yaw rate, and the perception from a front camera, i.e.
detections of lane markings and other traffic partici-
pants. The camera detections are available as object
lists in the recordings from the vehicle bus. Videos
from a front camera were used to review few scenar-
ios manually. This proved especially useful for corner
cases which were noticed, irregular visualizations of
detected scenarios.
4.1 Lane Changes
Lane changes are a common maneuver with a clear
pattern in the lateral distance to the left and right
lane markings from the onboard perception. How-
ever, missing detections and noise make it challenging
to find all lane change scenarios and potential corner
cases with a rule-based approach.
4.1.1 Data Labeling
First, we generate a training set by extracting a set of
relevant signals: We chose the lateral distance to the
detected left and right lane markings, as well as the
velocity and yaw rate from the ego vehicle. We define
a rule-based detector to create a set of labels S
l
, as
suggested in (Elspas et al., 2020): We identify driv-
ing close to the left and close to the right lane mark-
ings as relevant driving states A and D respectively.
Driving on the left and right lane markings, is defined
as states B and C. Now, a lane change to the left is
detected as a state transitions A → B → C → D. Sim-
ilarly, lane changes to the right can be found by the
pattern D → C → B → A. Due to sensor noise and
perception uncertainty, these patterns miss some lane
change situations as revealed by reviewing few video
recordings. By also matching patterns where the lane
markings are lost for up to one second during the ma-
neuver, we make the labeling more robust. With these
robust patterns, we create a second set of label de-
noted by S
r
l
. This increases the number of detected
lane changes from |S
l
| = 1380 to |S
r
l
| = 1677.
We use both sets of labels to train a FCN to show
that, even with different quality of the labels, the FCN
learns a meaningful scenario detection and reveals
missing labels.
Time Series Segmentation for Driving Scenario Detection with Fully Convolutional Networks
59

0.3
0.16
0.25
0.14
0.12
0.2
0.1
0.15
0.08
0.1
0.06
0.05
0.04
50
100 150 200
100 150
200
Epochs
Epochs
Loss
Loss
50
Figure 4: Training loss (blue) and validation loss (red) for
two models trained with labels from the simple rule-based
detector (left) and the improved rule-based detector (right).
4.1.2 Training
Before training the FCN model, described in sec-
tion 3.2, some crucial hyperparameters need to be
chosen. First, we note that the training data is highly
imbalanced. Lane changes have a mean duration of 6
seconds and account for 2.8% of the time. Therefore
we use undersampling and drop sequences without a
lane change with a drop probability of p
drop
= 70%.
We chose n
enc
= n
dec
= 3, so that the temporal res-
olution is reduced from originally 0.1 seconds to 0.8
seconds in the bottleneck layer. We argue, that this
granularity is sufficient.
Figure 4 shows the decreasing training and valida-
tion loss for training the FCN for 200 epochs with the
rule-based detections in S
l
(left) and the more robust
detections S
r
l
as labels. Note, that the lower validation
loss in Figure 4 is caused by missing data balancing
in the validation set.
4.1.3 Results
As discussed in Section 3.3, the loss can be a mislead-
ing metric, because it depends highly on the scenario
duration and is prone to the label distribution. We
use the loss as indication for a converging model, but
further evaluation is based on events, extracted from
scenario predictions of the FCN: The threshold 0.5
is used as decision boundary for the presence of sce-
narios, rising and falling edges indicate start and end
times of the events. Implausible events with a du-
ration below 1 second are removed from the result-
ing sets. This prevents potentially large numbers of
toggling detections for situations, where the model is
unsure and predicts scenario probabilities around the
threshold. The set of events learned from the simple
labels S
l
is called M
l
, the set of detections from the
improved labels M
r
l
.
Table 1: Event based evaluation of lane changes.
S M |S ∩ M| |S ∩ ¬M| |¬S ∩ M|
S
l
M
l
1370 10 412
S
r
l
M
r
l
1670 7 413
Comparing the sets of rule-based detections S with
the detections from the learned models M in Table 1
shows only few missing detections from the learned
model (S ∩ ¬M), but few hundred additional detec-
tions (¬S ∩ M).
To determine whether the additional detections are
real lane changes or not, top-down views with the
odometry of the ego vehicle (blue) and the detected
lane markings (grey), as in Figure 5, can be reviewed.
Such visualizations allow simple visual inspection of
detected scenarios. Reviewing the 10, respectively 7,
missing detections from the learned model confirms
all those situations as lane changes (e.g. Figure ??).
We interpret this as a strong indication for a high
Precision of the rule-based approach: Even the lane
changes that were hard to learn for the FCN model
were correctly identified by the rule-based detection.
Similarly, we check the additional detections from
the learned model: In the 412 additional detections
in ¬S
l
∩ M
l
roughly 58% of the detections are real
lane changes. This proves the learned models’ ability
to detect a significant number of lane changes, which
were not labeled.
Even training with the improved labels, which
identified 297 additional lane changes in S
r
l
compared
to S
l
, the learned model predicts 413 additional sce-
narios. Reviewing those scenarios reveals 86 further
lane changes. Some of those have clearly missing de-
tections from the lane perception as shown in Figure
5b. Also corner cases like changed lanes for road-
works or holding on the sidewalk were found and are
shown in Figure 5c. Furthermore, the learned model
identifies 46 situations in which the lane marking is
temporarily crossed, see Figure 5d. While such lane
crossings might be no lane changes as such, those are
clearly related scenarios and identifying such can be
beneficial to further detail the discrimination of the
scenario of interest.
4.1.4 Verification
Evaluating the sets in which the rule-based and
learned method disagree, does not directly provide
metrics about the detection quality: The detections
from both methods S ∩ M were only evaluated on a
sample base and could include FP. Furthermore, the
data could contain lane changes detected by neither
method.
To verify that the proposed methods provides
a reasonable scenario detection, we label all lane
changes within a subset of the recorded data manu-
ally. With this ground truth information we can cal-
culate Precision, Recall and F1-Score of the different
approaches. Hence we can also account for scenarios
missed by both methods.
VEHITS 2021 - 7th International Conference on Vehicle Technology and Intelligent Transport Systems
60
(a) Lane changes not detected by the learned model in S∩¬M. (b) Lane changes with missing lane information in ¬S ∩ M.
(c) Corner cases in ¬S ∩ M. (d) Temporary lane crossing in ¬S ∩ M.
Figure 5: Lane changes where the improved labels M
r
l
and detections S
r
l
from the corresponding learned model do not match.
Also corner cases with modified lanes due to roadwork or holding on the sidewalk where found (c).
Table 2: Performance metrics for for lane change detection.
Precision Recall F1-Score
S
l
0.992 0.717 0.832
M
l
0.921 0.873 0.896
S
r
l
0.994 0.890 0.939
M
r
l
0.953 0.936 0.945
The results, shown in Table 2, verify the expec-
tations in Section 4.1.3: As indicated by no FP in
S ∩ ¬M, the rule-based detections S have a high Pre-
cision. The Recall for the simple rules is rather low
with 72%, which was indicated by the large number
of additional detections from the learned model.
With more robust rules the recall is largely in-
creased to 89%. The learned model, trained on this
data, is still able to find further missing detections, re-
sulting in an even higher Recall of 93%. However, the
learned model tends to predict some false positives as
well, which leads to a lower Precision.
In both cases, the high Precision from the rule-
based approach was not reached, however, the learned
model was able to outperform the rule-based ap-
proach in Recall and in F1-Score.
4.2 Cut-ins
While lane changes can be rather easily identified by
the lane markings, cut-ins are a more complex sce-
nario where other traffic participants interact with the
lane infrastructure in relation to the ego vehicle. Due
to a limited detection range of the lane perception, not
all detected objects can be reliably mapped to lanes.
In combination with potentially strong road curva-
tures, various variations of cut-in scenarios can occur.
200
400
Position X
600
800
335
340
345
Time
350
355
Lateral distance
Position Y
Figure 6: Trajectories from the ego vehicle in blue and a de-
tected object in red (left). The decreasing minimal distance
between the trajectories is used for cut-in detection (right).
4.2.1 Data Labeling
First, we write a rule-based cut-in detector to create a
dataset with noisy labels programmatically. The front
camera provides detected vehicles in form of object
lists. Those object lists include the relative positions
to the ego vehicle as features. Leveraging a kinematic
single-track model, based on odometry signals as ego
velocity and yaw rate, we transform the relative posi-
tions to trajectories in global coordinates. This repre-
sentation, visualized in Figure 6, is used to calculate
the minimum distance from each position of the de-
tected objects to the future trajectory of the ego vehi-
cle. With this information cut-ins can be detected by
a decreasing lateral distance between the trajectories.
For our experiments we assign state A for a decreasing
lateral distance above 1.5 meters, state B for a lateral
distance between 1 and 1.5 meters and finally state C
for a lateral distance below 1 meter. Then cut-ins are
identified as the state transition A → B → C. As lane
changes of the ego vehicle behind a leading vehicle
on the neighbor lane result in similar patterns of ap-
proaching trajectories, we filter out scenarios where
the detected lane markings are crossed. With this ap-
proach we find |S
c
| = 472 cut-ins in the used dataset.
Time Series Segmentation for Driving Scenario Detection with Fully Convolutional Networks
61

Epochs
Pre
cision
1
0.95
0.9
0.85
0.8
0.75
0.7
100 200 300 400
500
600
Epochs
Reca
ll
Figure 7: Event based precision (left) and recall (right) for
cut-in detection based on the training labels.
4.2.2 Training
Similar to lane changes, cut-ins are rather rare events
with an average duration of 5.7 seconds that account
for 0.7% of the recorded time. For data balancing we
chose the drop probability p
drop
= 80% for samples
without cut-ins. The sample rate of the input data is
40 ms and n
enc
= n
dec
= 4 is chosen to get a temporal
resolution of 0.64 s in the bottleneck layer.
Figure 7 shows the increasing event-based Preci-
sion and Recall with respect to the labels from the
rule-based cut-in detection. The high Recall indi-
cates, that the learned model is able to find almost
all labeled cut-ins, while the lower Precision indi-
cates various additional detections. Assuming rather
conservative labeling rules, a lower Precision during
training can be in favor of a well generalizing model,
that is able to detect scenarios with missing labels.
4.2.3 Results
We extract the sets of detected cut-in events from the
learned model trained for 400 epochs as M
400
c
and
from the model trained for 600 epochs as M
600
c
. Those
detections are compared with the rule-based labels S
c
,
as shown in Table 3.
Table 3: Event based evaluation of cut-ins.
S M |S ∩ M| |S ∩ ¬M| |¬S ∩ M|
S
c
M
400
c
462 10 171
S
c
M
600
c
463 9 86
To evaluate the detected scenarios we create a vi-
sualization of those scenarios as exemplarily shown
in Figure 8. The visualization includes the trajectory
from the ego vehicle, the distance to the detected lane
markings, as well as the color encoded trajectories of
all detected objects during the relevant sequence.
Similar to the lane changes, the neural network
detects almost all labels found by the rule-based ap-
proach (S ∩ ¬M is small) and finds several additional
detections (¬S ∩ M). Those reveal cut-in situations
that were missed by the rule-based approach, as in
Figure 8a. Besides correctly detected cut-ins, sev-
eral corner cases were identified that show rather chal-
lenging situations with multiple detected objects and
strong curvatures. A repeating corner case was cut-
ins going hand in hand with a lane change of the ego
vehicle. Such scenarios, as exemplarily visualized in
Figure 8b, are clearly hard to categorize. However,
data samples of such corner cases can support find-
ing different variations of these scenarios and defining
necessary distinctions.
4.2.4 Verification
For verification of the cut-in detections we calculate
Precision, Recall and F1-Score for the rule-based and
the learned detections (Table 4).
Table 4: Performance metrics for cut-in detection.
Precision Recall F1-Score
S
c
0.95 0.74 0.83
M
400
c
0.87 0.82 0.84
M
600
c
0.91 0.80 0.85
Again the learned model can not reach the high
Precision of the rule-based approach. However, the
recall and the F1-Score were improved by the learned
model. Comparing the metrics for M
400
c
and M
600
c
shows that the model is approaching towards the per-
formance of the rule-based approach: The Precision
is increasing, but the Recall is decreasing. Conse-
quently, training less epochs can reveal even more
missing labels. On the other hand evaluating the con-
verged model after 600 epochs reveals less additional
detections and causes less evaluation effort.
5 DISCUSSION AND
CONCLUSION
Due to the large amounts of data, manual scenario
detection becomes less and less feasible. Automated
methods are needed for scalability and adaptability to
new or changing requirements. Domain knowledge
and expertise can be leveraged by rule-based labeling
functions. In our examples the rule-based approaches
are rather conservative. They provide a high Preci-
sion, but lower Recall. It seems reasonable, that de-
velopers start with rules that are based on a typical
understanding of a scenario. Variations with noisy
or missing data, as well as corner cases are hard to
consider in the first place. While detected events can
be reviewed rather quickly for false positives, finding
missing detections (false negatives) requires huge ef-
forts.
In this work we showed, that learning a model
from programmatically labeled data provides a sys-
tematic approach to identify wrong or missing de-
tections. Instead of reviewing hundreds of hours of
VEHITS 2021 - 7th International Conference on Vehicle Technology and Intelligent Transport Systems
62

(a) Cut-ins detected by the learned model. (b) Corner cases with cut-in and lane changes.
Figure 8: Top-Down visualization of not labeled cut-ins detected by the learned model (¬S ∩ M). The ego trajectory is shown
in blue, detected lane markings in grey and the trajectories of detected objects are color encoded with brighter colors with
ongoing time.
recorded data, we could identify few hundreds of
samples as candidates for manual review. With an ef-
fective visual representation, such candidates can be
quickly reviewed to estimate the quality of the rule-
based detection approach.
The FCN architecture for time series segmenta-
tion proved to be well suited for learning from weak
scenario labels. The suggested model was inspired
by popular network architectures for semantic image
segmentation and was able to learn a meaningful gen-
eralization of the provided labels. Not only missing
labeled were identified, but also similar scenarios and
related corner cases.
We expect the presented method to be a valuable
complement for improving the quality and robustness
of rule-based scenario detections. In future work, the
processing pipeline can be further automated and in-
tegrated into iterative development processes, where
domain experts develop new rules which are auto-
matically challenged by learning methods. Further-
more, the concept could be extended to compare the
detections from multiple approaches for scenario de-
tection. This could include several rule-based meth-
ods, as well as multiple learned models.
REFERENCES
Bach, J., Holz
¨
apfel, M., Otten, S., and Sax, E. (2017a).
Reactive-replay approach for verification and valida-
tion of closed-loop control systems in early develop-
ment. Technical report, SAE Technical Paper.
Bach, J., Langner, J., Otten, S., Holz
¨
apfel, M., and Sax, E.
(2017b). Data-driven development, a complementing
approach for automotive systems engineering. In 2017
IEEE International Systems Engineering Symposium
(ISSE), pages 1–6. IEEE.
Bach, J., Langner, J., Otten, S., Sax, E., and Holz
¨
apfel, M.
(2017c). Test scenario selection for system-level ver-
ification and validation of geolocation-dependent au-
tomotive control systems. In 2017 International Con-
ference on Engineering, Technology and Innovation
(ICE/ITMC), pages 203–210. IEEE.
Bai, S., Kolter, J. Z., and Koltun, V. (2018). An em-
pirical evaluation of generic convolutional and re-
current networks for sequence modeling. CoRR,
abs/1803.01271.
Bansal, M., Krizhevsky, A., and Ogale, A. S. (2019). Chauf-
feurnet: Learning to drive by imitating the best and
synthesizing the worst. In Bicchi, A., Kress-Gazit,
H., and Hutchinson, S., editors, Robotics: Science and
Systems XV, University of Freiburg, Freiburg im Breis-
gau, Germany, June 22-26, 2019.
Bock, F., Sippl, C., Heinzz, A., Lauerz, C., and German,
R. (2019). Advantageous usage of textual domain-
specific languages for scenario-driven development
of automated driving functions. In 2019 IEEE In-
ternational Systems Conference (SysCon), pages 1–8.
IEEE.
Chen, Q. and Wu, R. (2017). CNN is all you need. CoRR,
abs/1712.09662.
Elspas, P., Langner, J., Aydinbas, M., Bach, J., and Sax,
E. (2020). Leveraging regular expressions for flexible
scenario detection in recorded driving data. In 2020
IEEE International Symposium on Systems Engineer-
ing (ISSE), pages 1–8. IEEE.
Fawaz, H. I., Forestier, G., Weber, J., Idoumghar, L., and
Muller, P.-A. (2019). Deep learning for time series
classification: a review. Data Mining and Knowledge
Discovery, 33(4):917–963.
Fu, T.-c. (2011). A review on time series data min-
ing. Engineering Applications of Artificial Intelli-
gence, 24(1):164–181.
He, K., Zhang, X., Ren, S., and Sun, J. (2016). Deep resid-
ual learning for image recognition. In Proceedings of
the IEEE conference on computer vision and pattern
recognition, pages 770–778.
Keogh, E., Chu, S., Hart, D., and Pazzani, M. (2004). Seg-
menting time series: A survey and novel approach.
In Data mining in time series databases, pages 1–21.
World Scientific.
Langner, J., Grolig, H., Otten, S., Holz
¨
apfel, M., and Sax,
E. (2019). Logical scenario derivation by clustering
dynamic-length-segments extracted from real-world-
driving-data. In Gusikhin, O. and Helfert, M., edi-
tors, Proceedings of the 5th International Conference
on Vehicle Technology and Intelligent Transport Sys-
tems, VEHITS 2019, Heraklion, Crete, Greece, May
3-5, 2019, pages 458–467. SciTePress.
Time Series Segmentation for Driving Scenario Detection with Fully Convolutional Networks
63

Lucchetti, A., Ongini, C., Formentin, S., Savaresi, S. M.,
and Del Re, L. (2016). Automatic recognition of driv-
ing scenarios for adas design. IFAC-PapersOnLine,
49(11):109–114.
Menzel, T., Bagschik, G., and Maurer, M. (2018). Scenarios
for development, test and validation of automated ve-
hicles. In 2018 IEEE Intelligent Vehicles Symposium
(IV), pages 1821–1827. IEEE.
Montanari, F., German, R., and Djanatliev, A. (2020). Pat-
tern recognition for driving scenario detection in real
driving data. In IEEE Intelligent Vehicles Symposium,
IV 2020, Las Vegas, NV, USA, October 19 - November
13, 2020, pages 590–597. IEEE.
Perslev, M., Jensen, M., Darkner, S., Jennum, P. J., and Igel,
C. (2019). U-time: A fully convolutional network for
time series segmentation applied to sleep staging. In
Advances in Neural Information Processing Systems,
pages 4415–4426.
Ratner, A. J., De Sa, C. M., Wu, S., Selsam, D., and R
´
e,
C. (2016). Data programming: Creating large train-
ing sets, quickly. In Advances in neural information
processing systems, pages 3567–3575.
Ries, L., Stumpf, M., Bach, J., and Sax, E. (2020). Se-
mantic comparison of driving sequences by adapta-
tion of word embeddings. In 2020 IEEE 23rd Interna-
tional Conference on Intelligent Transportation Sys-
tems (ITSC), pages 1–7. IEEE.
Ronneberger, O., Fischer, P., and Brox, T. (2015). U-net:
Convolutional networks for biomedical image seg-
mentation. In International Conference on Medical
image computing and computer-assisted intervention,
pages 234–241. Springer.
Sippl, C., Bock, F., Lauer, C., Heinz, A., Neumayer, T., and
German, R. (2019). Scenario-based systems engineer-
ing: An approach towards automated driving function
development. In 2019 IEEE International Systems
Conference (SysCon), pages 1–8. IEEE.
Springenberg, J. T., Dosovitskiy, A., Brox, T., and Ried-
miller, M. A. (2015). Striving for simplicity: The all
convolutional net. In Bengio, Y. and LeCun, Y., ed-
itors, 3rd International Conference on Learning Rep-
resentations, ICLR 2015, San Diego, CA, USA, May
7-9, 2015, Workshop Track Proceedings.
VDA QMC Working Group 13 / Automotive SIG (2015).
Automotive SPICE Process Assessment: Reference
Model. page 132.
Wang, Z., Yan, W., and Oates, T. (2017). Time series clas-
sification from scratch with deep neural networks: A
strong baseline. In 2017 International joint confer-
ence on neural networks (IJCNN), pages 1578–1585.
IEEE.
Wood, M., Robbel, P., Maass, M., Tebbens, R. D., Meijs,
M., Harb, M., Reach, J., Robinson, K., Wittmann, D.,
Srivastava, T., Bouzouraa, M. E., Liu, S., Wang, Y.,
Knobel, C., Boymanns, D., L
¨
ohning, M., Dehlink, B.,
Kaule, D., Kr
¨
uger, R., Frtunikj, J., Raisch, F., Gru-
ber, M., Steck, J., Mejia-Hernandez, J., Syguda, S.,
Bl
¨
uher, P., Klonecki, K., Schnarz, P., Wiltschko, T.,
Pukallus, S., Sedlaczek, K., Garbacik, N., Smerza,
D., Li, D., Timmons, A., Bellotti, M., O‘Brien, M.,
Sch
¨
ollhorn, M., Dannebaum, U., Weast, J., Tatourian,
A., Dornieden, B., Schnetter, P., Themann, P., Weid-
ner, T., and Schlicht, P. (2019). Safety first for auto-
mated driving. Technical report.
VEHITS 2021 - 7th International Conference on Vehicle Technology and Intelligent Transport Systems
64
