
GoAT: A Sensor Ranking Approach for IoT Environments
Felipe S. Costa
1a
, Silvia M. Nassar
1b
and Mario A. R. Dantas
2,3 c
1
Department of Informatics and Statistic, Federal University of Santa Catarina (UFSC), Florianopolis, Brazil
2
Department of Computer Science, Federal University of Juiz de Fora (UFJF), Juiz de Fora, Brazil
3
INESC P&D, Santos, Brazil
Keywords: Sensor, Ranking, Active Perception, Middleware, IoT, Industry 4.0, Latency, Reliability.
Abstract: The data collected and transmitted by the sensors, in the Internet of Things environment, must be stored and
processed in order to enable Smart Cities and Industry 4.0. However, due to the growth of number of devices,
it becomes necessary to implement techniques to select most suitable sensors for each task. This approach is
important to make possible to execute applications, where low latency requirements are present. Thus, several
works were dedicated to the study on how to search, index, and rank sensors to overcome these challenges. A
method, called GoAT, is presented in this paper to rank sensors based on the theory of active perception. The
solution was evaluated using four real datasets. Our results successfully demonstrate that the proposal solution
can provide an interesting level of reliability of the utilization of sensor data. Furthermore, GoAT requires a
low computational resource, and at the same time, reduces latency in the sensor selection process.
1 INTRODUCTION
The growth of number of objects in the Internet of
Things (IoT) environment makes the existing
resources of IT architectures and infrastructures
insufficient to process all these data, especially when
real-time requirements are considered. Taking into
account the scalability and the real-time of big data,
they must be “extracted” in different levels during
analysis, modeling, visualization, and prevision to
reveal their intrinsic property; thus, improving
decision- making (M. Chen et al., 2014). Therefore,
IoT middleware solutions have been adopted to allow
data sharing (Pattar et al., 2018). An IoT middleware
will allow users to collect data from a large number
of sensors so that they can be used through different
applications, acting as an interface between the
user/application and the IoT network (Kertiou et al.,
2018). The main activities of an IoT middleware are
acquisition, research or discovery, indexing, ranking,
and query.
The activity of indexing, in the middleware,
involves storing and indexing the collected data in the
search space in the IoT network to allow a quick and
a
https://orcid.org/0000-0002-6647-7624
b
https://orcid.org/0000-0001-7130-0420
c
https://orcid.org/0000-0002-2312-7042
efficient search. Ranking of IoT resources,
considering that resources include sensors, devices
and services, focus on prioritization of criteria such as
data quality, device availability, efficient energy,
network bandwidth and latency. This task can be done
based on generated observation (content) and
measurement data (context). Ranking is a decision-
making process in which different criteria should be
considered depending on the requirements of the
domain. Typical applications, for example industry
and healthcare, require confidence and high-quality
data associate with low latency data processing and
delivery (Fathy et al., 2018).
The sensors incorporated into the IoT objects
collect data in real-time about the surrounding
environment. In the real world, they detect events and
then generate data about these events. The data come
from devices connected to the IoT network which
have several characteristics, such as dynamics, huge
size, dynamic data generation rate and volatility
(Pattar et al., 2018). All these characteristics favor the
appearance of noise in the data. Besides, once the
sensors aim to capture the state of the surrounding
environment, and considering that, eventually,
Costa, F., Nassar, S. and Dantas, M.
GoAT: A Sensor Ranking Approach for IoT Environments.
DOI: 10.5220/0010403801690177
In Proceedings of the 11th International Conference on Cloud Computing and Services Science (CLOSER 2021), pages 169-177
ISBN: 978-989-758-510-4
Copyright
c
2021 by SCITEPRESS – Science and Technology Publications, Lda. All rights reserved
169
anomalies may occur in that environment, arise the
challenge of differentiating a real warning
(abnormality) from a failure (noise). Such failures can
be caused through problems in data transfer or by
interference in the sensor readings.
To overcome these problems, this work focuses
on the ranking of sensors based on the data generated
by them. The main contribution of this work is to
provide a fast (reduction of latency) and safe method
to indicate which sensors are providing correct
information. Another contribution consists of
offering resources to identify possible anomalies in
environments or failures in IoT devices acting as a
support in the control of monitored environments. To
do this, the techniques used are based on content
(generated data by the sensor) but also, using a
parameter related to the state of the sensor at the time
of data capture, it means, a context parameter. This
paper presents an enhanced and differential level of
development compared with the previous one
presented in (Costa et al., 2019).
The remainder of the paper is organized as
follows: Section II presents the details of this
proposal. In Section III, the related works are
presented. The results obtained are analyzed in
section IV, and section V brings the conclusions of
the research work and future perspectives.
2 PROPOSED MODEL AND
BACKGROUND
In this section, we present the proposed method,
called GoAT (Greatest of Actual Time), and the
architecture of the experimental environment. This
scenario was developed to allow the evaluation of the
method which is carefully discussed.
2.1 Sensor Ranking
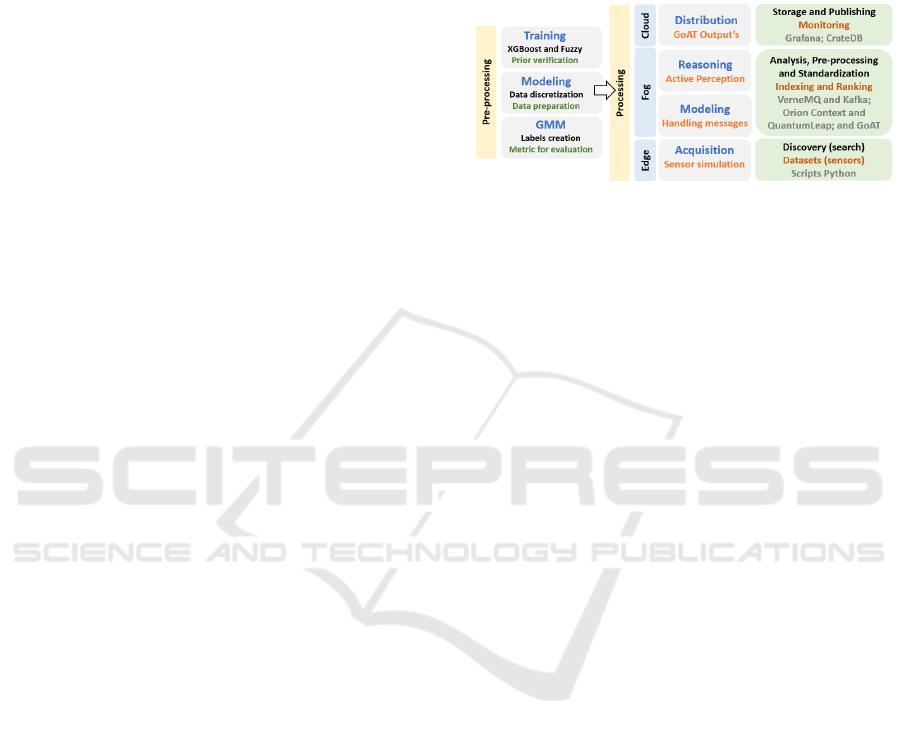
Figure 1 shows an overview of the proposed method.
In the pre-processing step of the method, the datasets
are labeled, and the data of the variables are
discretized. The training of the algorithms and
techniques used is also performed. In the processing
step, the boxes with a blue bottom and vertically
arranged to identify the layer (Edge, Fog, and Cloud)
in which each middleware activity (acquisition,
modeling, reasoning, and distribution) occurs. In the
following boxes, the most common activities found in
IoT middleware are presented. Below the
identification of each activity (blue text), the
functions performed by the application in the
experimental environment of this proposal are
presented (orange text). Boxes with a green bottom
and black text show activities used in this proposal.
In these boxes, the orange text represents the action
performed or the input data sent to the tools used,
identified by the gray text.
Figure 1: Proposed method: layers of processing, activities,
and tools for each layer.
In this research work, the normal, anomaly, and
failure tags are used to identify the sensor status. Data
marked as normal represent that the sensor and the
environment in which the measurement is being made
are stable (without anomalies) and the reading
process was not affected by interference during data
capture and transmission. The data marked as an
anomaly are those that indicate the occurrence of
abnormalities in the environment. Finally, the data
considered as a failure are marked as a result of
failures in devices or data transmission.
This paper proposes a method based on the theory
of active perception (Biel & Wide, 2000; Schiffman,
2001) as a way to identify correctly each of the three
types of data mentioned above. Considering that
perception is always dependent on context, other
senses and time, the active perception approach is
divided into four levels: sensation, perception, time
perception and active perception. Sensation is the
process in which captured data enter in the system.
After the sensation, the perception interprets data and
gives its meaning. When time is added to the process,
a dynamic perception process is obtained where
several "fingerprints" (sequence of captured data
chronologically) provide meaning and, therefore,
knowledge. This process is called time perception
(Biel & Wide, 2000; Schiffman, 2001).
Figure 2 shows the flow of information according
to the concepts presented. The image shows the flow
(left side) of the data collection information
(sensation) in the environment, followed by the
improvement of perception through the addition of
meaning (sense). The next level uses the time
property, considering the dynamic aspect of the
environment. The process ends with active perception
in which from the information generated by the
CLOSER 2021 - 11th International Conference on Cloud Computing and Services Science
170
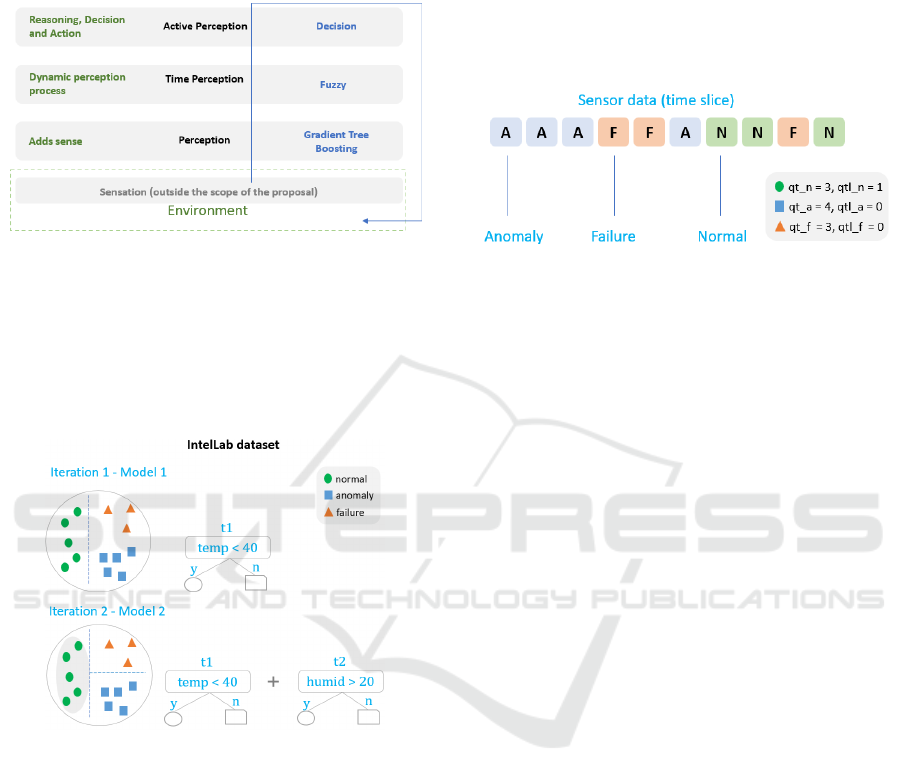
previous steps, decisions are made, and actions can be
performed (alerts and feedback). Thereby, the flow in
Figure 2 returns to the environment indicating
possible actions to be taken.
Figure 2: The flow of information in active perception.
The first stage of the data flow is carried out by
the sensors. Consequently, out of the scope of this
paper. Thus, the first-three stage is related to
perception. This step was implemented using an
algorithm belonging to the Gradient Tree Boosting
class, as shown in Figure 3.
Figure 3: Classification of a single sensor data.
The algorithms from Gradient Tree Boosting class
are algorithms that start by creating only one decision
tree. After training, the values forecasted incorrectly
by the tree are recorded. Then, a new tree is created
to see the other one's mistakes. So, the cycle is
repeated up to a certain limit, always trying to reduce
the error rate (T. Chen & Guestrin, 2016).
The XGBoost implementation improves the
performance of the conventional gradient
augmentation tree by introducing two techniques:
weighted quantile sketching (a data structure that
supports merging and removing operations) and
dispersion recognition split location (default direction
at each node in the tree). XGBoost has been applied
to several machine learning problems and has
obtained better results than the other algorithms (Shi
et al., 2019). The training of the algorithm was carried
out with a sample of 15,000 cases from each dataset.
This step is the first contact of the method with the
information provided by the sensor. The algorithm
tries to assign a meaning to the data using only the
current information and the previous knowledge of
the algorithm acquired from training phase. This
algorithm has linear time complexity.
Figure 4: Use of a set of sensor data in the evaluation of
sensor status.
Following the flow, the next step uses the time
aspect to evaluate the data provided by the sensor.
The adoption of this approach (time) occurs because
the sensor's failures can be persistent or transient.
Then, if there is an interference in a specific moment
of data capture for a given sensor, leading to the
generation of an incorrect value, and considering that
the concept of time is not used, the probability of a
wrong interpretation of the sensor data increases.
When the time window is used it can identify whether
the fault is temporary or permanent. The flow of
information passes through the second level just if the
output of the first level indicates an abnormality in the
data. Otherwise, the second level is skipped. To
implement this concept, the outputs (labels) of the
first level are saved in a vector.
In the implementation of the second level, tests
were performed with different sizes of time windows
(5, 10, 15 and 20). These sizes represent the number
of observations, in other words, sensor readings to be
considered when calculating the probability of
evidence is correct. At the end of these tests, a time
window of size 10 showed promising results in the
datasets used, considering an intermediate value
between performance and computational cost. In the
case of the time window with five cases, there is an
increase of approximately 30% in the error rate
compared to the error rate of the time window with
ten cases. On the other hand, in tests with the time
windows of 15 and 20 cases, the error rate remains
practically stable, but there is an increase of
approximately 20% in latency. These values are
similar between data sets.
Figure 4 shows an example of this type of subset.
In the image, a subset of data cases generated by the
sensor is presented. The qt_n, qt_a, and qt_f
GoAT: A Sensor Ranking Approach for IoT Environments
171
indicators represent the quantities of each type of data
(normal, anomaly, and failure, respectively). The
values of qtl_n, qtl_a, and qtl_f represent the count of
the last data type that appears in the subset. In the case
of Figure 4, the latter type is normal and has only one
contiguous occurrence of this type, since the
immediately preceding item is of type failure, that is,
a different type. With this approach, only one of these
indicators will be greater than zero.
The vector is then submitted to a Fuzzy Inference
System (FIS). Fuzzy logic (Zadeh, 1965), is inspired
by real-world phenomena in which events can hardly
be considered entirely false or completely true. Fuzzy
logic offers a method based on rules and
mathematical sets for the treatment of inaccuracy.
Fuzzy logic can deal with imprecise or qualitative
terms, such as "Low", "Medium" and "High" which
can not be expressed using binary logic. Similarly,
Fuzzy logic, the data history of each sensor will be
analyzed using the qualitative values "Low",
"Medium" and "High". Applying Fuzzy rules, the
system output to the time perception level will be
defined to identify the probable state of the sensor.
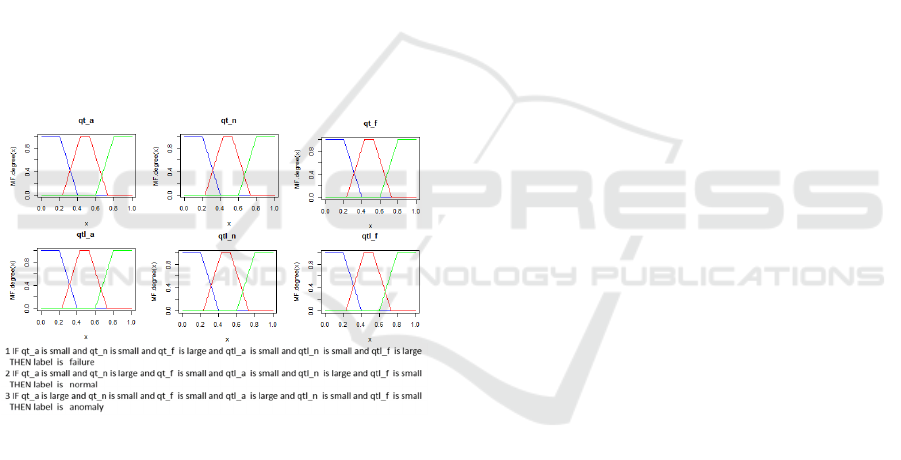
Figure 5: Use of fuzzy rules for decision making.
In Figure 5, it is possible to view the pertinence
functions of six indicators used in the assessment, as
well as three of the fuzzy rules used in the IntelLab
dataset. These indicators represent the number of
states for each category (qt_a, qt_n, qt_f) and the
identification of how long the sensor is already in that
state (qtl_a, qtl_n, and qtl_f). These indicators are
also represented in the Figure 4.
In the final stage of active perception, the outputs
of two previous stages are evaluated together. If the
produced output at the first level is normal, no further
treatment will be necessary. If the second level is
triggered, the system's response will use that output
as the final response. After that, the sensor index is
updated with this new information.
To update the index, the data are classified using
the concepts Quality of Context theory (QoC). The
trustworthiness parameter (Equation 1) is used to
check the quality of each sensor, where 0 (zero)
means that this context source is not reliable, and 1
(one) represents total confidence in the context source
(Bringel Filho & Agoulmine, 2011).
T(ctxi) = NumberOfReliableSamples(ctxi) / W, W > 0
(1)
in which
T is trustworthiness
cxti is the set of trusted context elements for a
sensor
W is the total number of context elements and
must be greater than zero.
The value of the trustworthiness context
parameter is then evaluated using a FIS. The modeled
FIS has an input variable (trustworthiness) and an
output variable (sensor state). The input variable is
modeled using the categories very low, low, medium,
high and very high. The output variable can assume
the values normal, anomaly and failure. As a final
step the sensor ranking is updated with the new values
of the trustworthiness parameter.
2.2 IoT Platform
The proposal of this work use an architecture adapted
from the FASTEN project (Costa et al., 2020).
Flexible and Autonomous Manufacturing Systems
for Custom-Designed Products (FASTEN) is a
project funded by the EU Horizon 2020 program.
FASTEN's Industrial IoT Platform aims to
manipulate data from devices (robots, sensors and
actuators) in industrial environments and work as an
intelligent data repository for the optimization and
forecasting layer, allowing to improve the quality of
the services offered and at the same time it is within
the Industry 4.0 requirements.
The bottom box in Figure 6 represents the sensors
(devices). The datasets were sent to the platform
through simulators (scripts). These scripts sent the
data to the platform through the Message Queuing
Telemetry Transport (MQTT) protocol using the
VerneMQ tool. A connector continuously monitors
topics (such as a message queue) in MQTT, and, as
soon as a message arrives, it is automatically
transferred to the Apache Kafka streaming platform.
Following the flow, the next box, GoAT, represents
the proposal of this research work for ranking sensors.
After processing by the GoAT broker, the
indexing activity is represented by storing the
messages as context entities in the Orion Context
Broker tool, one of the components of the FIWARE
CLOSER 2021 - 11th International Conference on Cloud Computing and Services Science
172
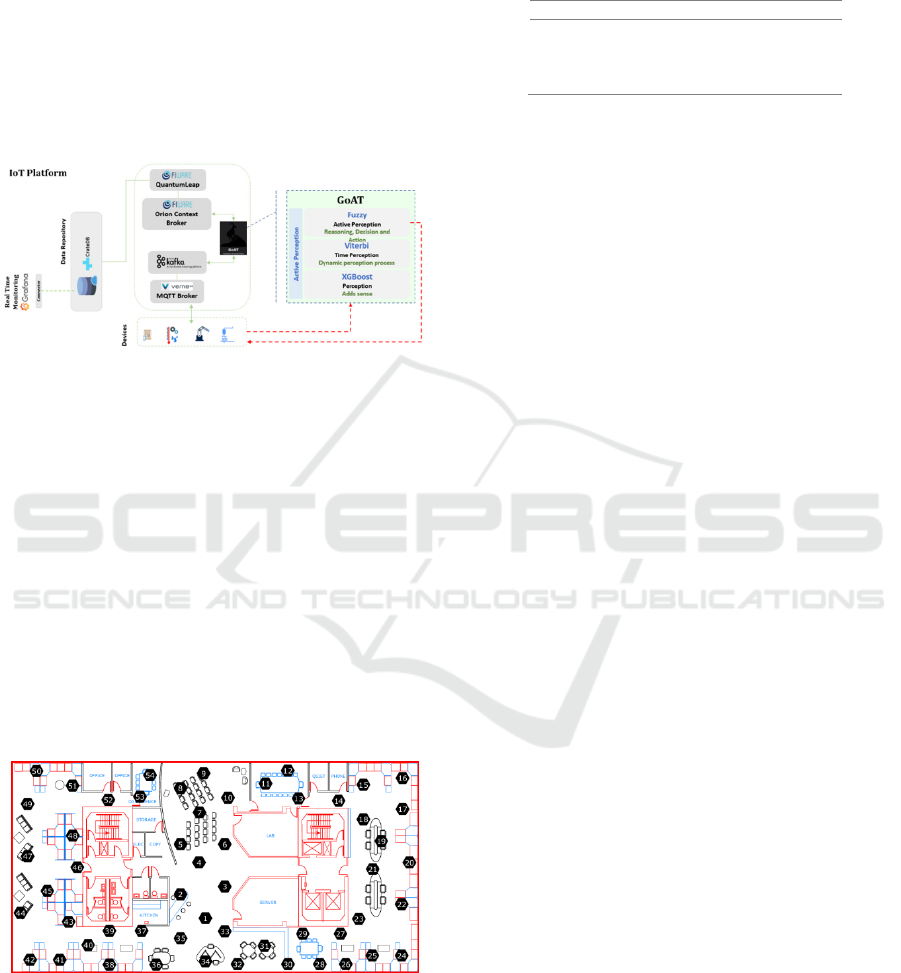
framework used in this architecture. Context entities
reflect the current state of each sensor and can be
persisted in a database for IoT, as is the case with the
CrateDB database. The connection between the Orion
Context Manager and the database is made by the
QuantumLeap application, also belongs to the
FIWARE framework. These data, when persisted, can
be used for monitoring the system. This activity is
performed here by the Grafana monitoring tool. In
this way, this architecture allows parallel processing,
also reinforcing the scalability of the proposal.
Figure 6: Proposed experimental environment - IoT
Platform.
2.3 Datasets Used for Evaluation
To use the same datasets of the related works, thus
facilitating the comparison between the methods, four
real datasets were selected to evaluate the proposed
method.
The IntelLab dataset (Intel Lab Data, [s.d.])
contains information about data collected from 54
sensors with weather boards that collected
timestamped topology information, along with
humidity, temperature, light, and voltage values once
every 31 seconds. The sensors, deployed in the Intel
Berkeley Research lab, were arranged in the lab
according to the diagram shown in Figure 7.
Figure 7: IntelLab Dataset (Intel Lab Data, [s.d.]).
The other datasets refer to environmental data and
were collected from stations of the Phenonet project
(Phenonet, [s.d.]) from stations of the Bureau of
Meteorology (BOM) (Bureau of Meteorology, [s.d.])
and from stations of the National Oceanic and
Atmospheric Administration (NOAA) (NOAA, [s.d.])
as presented in Table 1.
Table 1: Datasets (Costa et al., 2019).
Dataset Cases (millions) Stations
BOM 4.1 111
IntelLab 2.3 54
NOAA 127 14181
PhenoNet 1.9 7790
The combination of these datasets, in which the
data were generated under different conditions,
contributed to the evaluation of our proposal. A
computer with an Intel Core i7 processor with 32GB of
RAM and a 250GB SSD was used to perform the tests.
3 RELATED WORK
Applications such as industry, agriculture, and
healthcare require reliability associated with
computing in services that require low latency
requirements (Fathy et al., 2018). In this section, the
most relevant works related to the ranking of sensors
are presented.
In Costa et al. (Costa et al., 2019) sensor data is
evaluated at three levels. In the first level, the
XGBoost (XGB) algorithm is used. In the second
step, the method uses the Viterbi algorithm to
evaluate a subset of the data (time slice). In the final
step, the algorithm assigns weights to each answer
obtained at the previous levels to make the final
decision. Despite presenting an interesting proposal,
the performance of the method fails with regard to
reducing latency since all levels of data evaluation are
always performed. In addition, the use of the Viterbi
algorithm also contributes to increased latency. Also,
the use of weights at the last level is configured as a
mechanism subject to failure and generate the
premise of creating a lot of rules for the correct
assignment of these weights.
In the work of Ruta et al. (Ruta et al., 2019), the
ranking of the devices is based on a metric that
calculates the semantic distance between the user's
requirements and the semantic description of each
device. In Kertiou et al. (Kertiou et al., 2018), the
authors use context information from sensors with a
dynamic skyline operator to reduce the search space
and select the best sensors according to user
requirements. In Dilli et al. (Dilli et al., 2018), the
ranking is calculated by the Simple Additive
Weighting (SAW) algorithm. Nunes et al. (Nunes et
al., 2018) propose a Selection-Elimination (ES)
algorithm to filter and classify the response data.
GoAT: A Sensor Ranking Approach for IoT Environments
173
Neha and Saxena (Neha & Saxena, 2016) work
with weights for the importance of context properties
and calculate the ranking of each sensor using a metric
called Weighted Index Based on Preference (PBWI).
In Wang et al. (W. Wang et al., 2015), a sensor ranking
mechanism based on the cost of accessing the service
(device) is proposed. The cost is calculated using
sensor properties and context information.
In the work of Perera et al. (Perera et al., 2014),
the ranking of sensors is done using a weighted
Euclidean distance metric, called Comparative
Priority Based Weighted Index (CPWI). In the
Snoogle (H. Wang et al., 2010) framework, the sensor
ranking is based on the relevance of the object
description, informed in the parameters query.
Ostermaier et al. (Ostermaier et al., 2010) were the
first to use the term ranking of sensors. The work
focuses on the use of data produced by sensors
centered on people, considering that habits can
indicate future behavior, and thus use the data
generated by these sensors to create forecasting
models. This process calculates an estimate of the
probability, in decreasing order, that each sensor
corresponds to the query parameters.
According to the bibliographic research performed,
only one of the articles (Skarmeta et al., 2018)
considers aspects related to the identification of
failures or anomalies. Despite this, the work does not
describe how this is done and does not show any
results. None of the related works considers the fact
that sensor failures can be transient or persistent, given
the dynamic nature of the IoT environment, more
specifically the generation of data by sensors. Thus,
considering only the state of the sensor at a specific
time to generate the ranking can compromise the
quality of the responses provided by the algorithms.
The researched works also do not have a previously
created list (ranking), which makes it impossible to
respond immediately to a request for a list of trusted
sensors. The active perception theory for ranking the
sensors was not used in any of the related works. This
approach has as main objective to create a method that
adds knowledge to the reasoning, improving the data
analysis process. Only three studies use more than one
technique for data evaluation.
The literature review presents some approaches
that demonstrate the importance of this activity for
the development of the IoT. However, there are still
challenges and opportunities to be overcome:
- Differentiate data that represent real
measurements from data generated by failures or
interferences, reducing uncertainty in decision
making.
- Reduce the amount of data to be analyzed (reduce
the time) to meet services with low latency
requirements.
4 EXPERIMENTAL RESULTS
Since the cases of datasets do not have labels, and to
provide some metrics capable of demonstrating the
quality of our method, the clustering techniques are
used to generate labels for the data.
This approach provides a way to evaluate the
proposed method, allowing the comparison of the
outputs generated by the proposal with the
information obtained in the cluster methods.
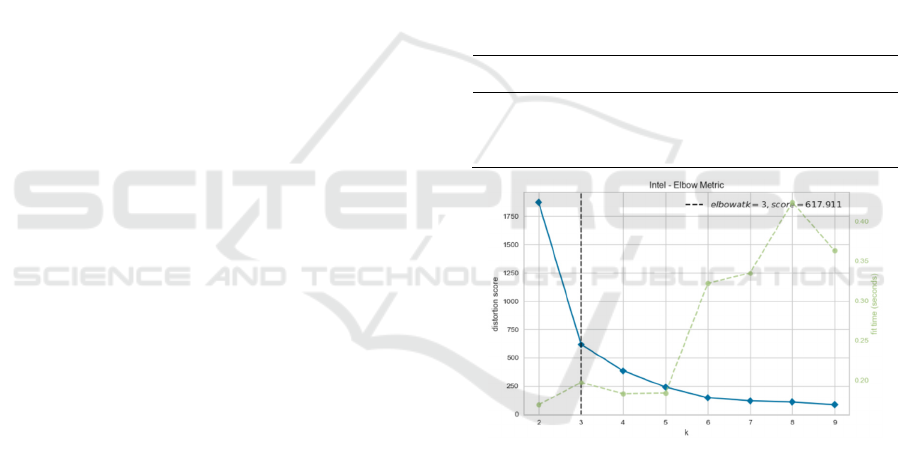
Before creating clusters, metrics were used to
assess the tendency to clustering and the number of
clusters and can be seen in Table 2.
Table 2: Tendency to clustering and quality of clusters.
Dataset Tendency
[%]
SC
[-1, +1]
CH
[+]
DB
[-]
BOM 0.99 0.23 6458.31 3.44
IntelLab 0.84 -0.29 128.61 157.38
NOAA 0.86 0.07 254.57 4.90
PhenoNet 0.93 0.23 754.55 1.14
Figure 8: Number of clusters for the IntelLab dataset.
The clustering tendency and the quality of each
generated cluster were evaluated using the Hopkins
test (Hopkins & Skellam, 1954). The quality of the
clusters was evaluated using three different metrics:
Silhouette Coefficient (SC) score (Aranganayagi &
Thangavel, 2007), Calinski-Harabasz (CH) index
(Caliński & Harabasz, 1974), and Davies-Bouldin
(DB) index (Davies & Bouldin, 1979). For the SC
index, the values vary from -1 to +1, indicating better
and worse clusters, respectively. In the case of the
metric CH, the higher the value, the better the quality
of the generated cluster. In the DB metric, the lower
the value, the better the quality of the cluster. Figure
8 shows the indication of the best number of clusters
CLOSER 2021 - 11th International Conference on Cloud Computing and Services Science
174
for the IntelLab dataset generated using the Elbow
metric (Pascual et al., 2010).
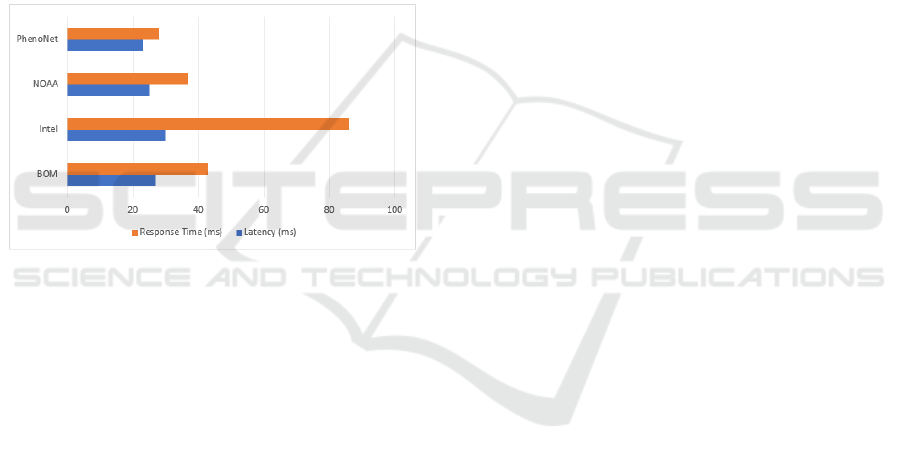
A graphical representation of the division of the
data from the dataset IntelLab into the normal,
anomaly, and failure groups are shown in Figure 9.
The graph was generated using the Gaussian Mixture
Model (GMM). In addition to the GMM method, the
methods Spectral clustering, Agglomerative
clustering, DBSCAN, and k-means were applied.
Despite this, in all datasets, the best result was
obtained with the GMM method. Figure 9 shows, in
green color (representing normal values), the natural
variations of the temperature during the day (between
20
o
C and 30
o
C), in yellow the intermediate or
anomaly values (indicating real changes in the
environment) and finally the values in red
representing the values considered failures (capture
or transmission failures).
Figure 9: Clusters of dataset IntelLab generated using
GMM (Costa et al., 2019).
It should be noted that the values considered as
anomalies are in a range of possible values for the
environment, which is not the case for values
considered as failures. The data shown in the image
refer to a random sample containing data from all 54
sensors. This graph gives an idea of the approach of
this work to classify the data generated by the sensors
in three categories.
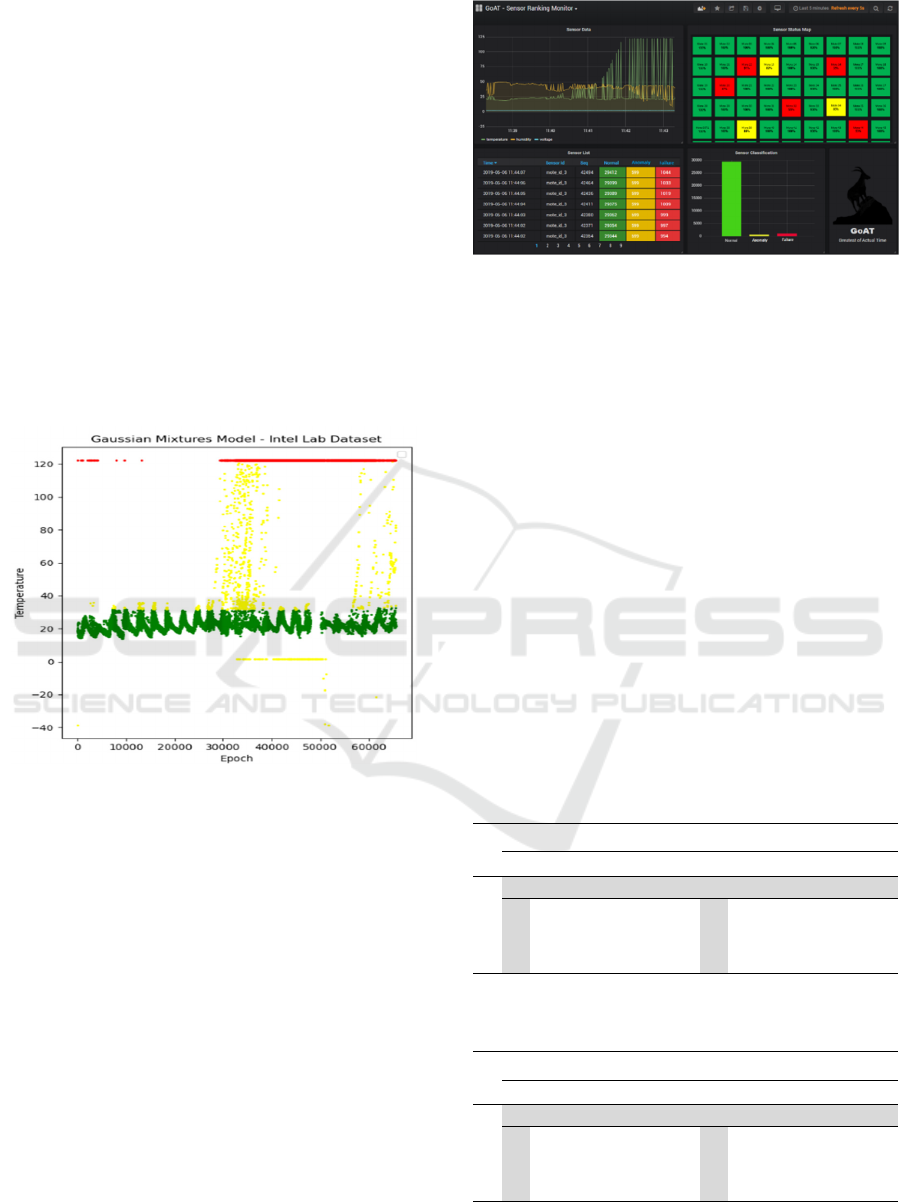
The Grafana tool is used to display the state of the
system (Figure 10). The image shows the monitoring
of the IntelLab dataset and is divided into four regions.
In the upper left area is presented the monitoring, over
time, of the values of the column’s temperature,
humidity, and voltage of this dataset. In this region, it
is possible to observe that the temperature rises
considerably over time, while the humidity tends to
decrease, and the voltage remains stable.
Figure 10: A tool for monitoring tests develop in Grafana
(Costa et al., 2019).
In the upper right region, a box is displayed for each
sensor in the dataset with the colors green, yellow or
red, indicating the current state of the sensor, that is,
normal, anomaly or failure. In the lower-left region, the
time of the last sensor data capture, the sensor
identification and the value of the capture sequence are
shown, and three columns in the colors green, yellow
and red, indicating the total data considered in each
category (normal, anomaly and failure). Finally, in the
lower right region, three columns are presented with
the overall values considered as normal, anomaly, or
failure for this dataset.
The idea of the tool showed in Figure 10
demonstrates a possible practical application of this
research work. The tool reflects the possibility of
monitoring an environment and its sensors,
identifying sensors in a failure state, and
environments in which an anomaly may be occurring.
Table 3: Error rates and Normalized Confusion Matrix for
BOM and IntelLab datasets.
Actual
BOM (2.96) IntelLab (0,07)
Predicted
N A F N A F
N 0.840 0.000 0.000 N 0.801 0.000 0.00
A 0.000 0.101 0.000 A 0.000 0.036 0.00
F 0.000 0.029 0.030 F 0.000 0.000 0.163
Table 4: Error rates and Normalized Confusion Matrix for
NOAA and PhenoNet datasets.
Actual
NOAA (6.58) PhenoNet (7.55)
Predicted
N A F N A F
N 0.371 0.041 0.001 N 0.839 0.001 0.000
A 0.000 0.376 0.000 A 0.074 0.005 0.00
F 0.024 0.000 0.187 F 0.000 0.000 0.081
GoAT: A Sensor Ranking Approach for IoT Environments
175
Comparing the results generated by the algorithm
executions with the label values in each sample, Table
3 and Table 4 presents the general error rates (next to
the dataset name, in parentheses) and the confusion
matrices for all datasets. Since the datasets cases had
no labels, the ranking algorithm responses were
compared with the clustering algorithm results
applied to each dataset.
The error rates obtained in the datasets BOM and
IntelLab are shown in Table 3, and the error rates for
the datasets NOAA and PhenoNet are displayed in
Table 4. These values demonstrated the excellent
performance of our algorithm. In the PhenoNet
dataset, the error rate remains at a higher value and
will be investigated in conjunction with the values
obtained from cluster quality metrics for this dataset.
Table 3 and Table 4 show the error rates in each class,
i.e., normal (N), anomaly (A), and failure (F).
Figure 11: Response time and latency costs.
Figure 11 shows the times spent, per dataset, for
processing a request. The item "Response Time"
refers to the total time taken from the submission of
the request to the receipt of the response. The item
"Latency" refers to the processing time of the ranking
algorithm.
5 CONCLUSIONS AND
RESEARCH DIRECTIONS
In this paper was presented the GoAT method, which
is characterized by successfully reducing the amount
of data to be analyzed in decision making (reduction
in latency), selecting the most reliable sensors, and
providing the identification of anomalies in the
environments.
The error rates showed interesting levels
according to the results obtained in all datasets.
Although it presents a higher error rate in one of the
four datasets, the results presented in this work
demonstrate the feasibility of our proposal. As this
work is under development, and these are the initial
results obtained, it will still be possible to reduce the
error rate in the PhenoNet and NOAA datasets.
The solution allows to reduce drastically the
computational effort involved in the data processing
once the data is analyzed only at the first level of the
proposal. This happens because only data considered
non-normal are handled at the second and third level
of proposal processing.
In addition, considering that only a small part of
the data needs to be analyzed in three evaluation
steps, a reduction in latency is also possible because
the solution allows only the most reliable sensors are
selected. Thus, the model is able to provide reliability
and lower latency, at the same time, in the use of
sensor data.
Anomaly and failure identification, on the other
hand, allows quick answers to correct problems in
environments, such as feedback from cyber-physical
systems.
Finally, considering that the main objective of this
proposal is precisely to make the selection of the most
reliable sensors, the results can be regarded as
promising. Future works intend to use the data
collection of online sensors as well as tests with
configurations for distributed environments.
ACKNOWLEDGEMENTS
This research is funded by the Federal Institute of
Santa Catarina, FASTEN Project, INESC P&D
Brazil, Ministry of Education, and by the CNPQ
(National Center for Scientific and Technological
Development) of the Brazil Government.
REFERENCES
Aranganayagi, S., & Thangavel, K. (2007). Clustering
Categorical Data Using Silhouette Coefficient as a
Relocating Measure. International Conference on
Computational Intelligence and Multimedia
Applications (ICCIMA 2007), 2, 13–17.
https://doi.org/10/ffqrhs
Biel, L., & Wide, P. (2000). Active perception for
autonomous sensor systems. IEEE Instrumentation
Measurement Magazine, 3(4), 4. https://doi.org/10.
1109/5289.887457
Bringel Filho, J., & Agoulmine, N. (2011). A Quality-
Aware Approach for Resolving Context Conflicts in
Context-Aware Systems. 2011 IFIP 9th International
Conference on Embedded and Ubiquitous Computing,
229–236. https://doi.org/10.1109/EUC.2011.9
CLOSER 2021 - 11th International Conference on Cloud Computing and Services Science
176

Bureau of Meteorology. ([s.d.]). Recuperado 20 de
dezembro de 2018, de https://www.dropbox.com/s/
mo2zac1ahmcqcsj/BOM_csv.zip?dl=0
Caliński, T., & Harabasz, J. (1974). A dendrite method for
cluster analysis. Communications in Statistics, 3(1), 1–
27. https://doi.org/10.1080/03610927408827101
Chen, M., Mao, S., & Liu, Y. (2014). Big Data: A Survey.
Mobile Networks and Applications, 19(2), 171–209.
https://doi.org/10/f5xhcd
Chen, T., & Guestrin, C. (2016). XGBoost: A Scalable Tree
Boosting System. Proceedings of the 22nd ACM
SIGKDD International Conference on Knowledge
Discovery and Data Mining - KDD ’16, 785–794.
https://doi.org/10.1145/2939672.2939785
Costa, F. S., Nassar, S. M., & Dantas, M. A. R. (2019). A
three level sensor ranking method based on active
perception. IECON 2019 - 45th Annual Conference of
the IEEE Industrial Electronics Society, 1, 2889–2895.
https://doi.org/10.1109/IECON.2019.8927612
Costa, F. S., Nassar, S. M., Gusmeroli, S., Schultz, R.,
Conceição, A. G. S., Xavier, M., Hessel, F., & Dantas,
M. A. R. (2020). FASTEN IIoT: An Open Real-Time
Platform for Vertical, Horizontal and End-To-End
Integration. Sensors, 20(19), 5499. https://doi.org/10/
ghc8cq
Davies, D. L., & Bouldin, D. W. (1979). A Cluster
Separation Measure. IEEE Transactions on Pattern
Analysis and Machine Intelligence, PAMI-1(2), 224–
227. https://doi.org/10.1109/TPAMI.1979.4766909
Dilli, R., Argou, A., Pilla, M., Pernas, A. M., Reiser, R., &
Yamin, A. (2018). Fuzzy Logic and MCDA in IoT
Resources Classification. Proceedings of the 33rd
Annual ACM Symposium on Applied Computing, 6.
https://doi.org/10.1145/3167132.3167216
Fathy, Y., Barnaghi, P., & Tafazolli, R. (2018). Large-Scale
Indexing, Discovery, and Ranking for the Internet of
Things (IoT). ACM Comput. Surv., 51(2), 53.
https://doi.org/10.1145/3154525
Hopkins, B., & Skellam, J. G. (1954). A New Method for
determining the Type of Distribution of Plant
Individuals. Annals of Botany, 18(2), 213–227.
https://doi.org/10/gfwpfs
Intel Lab Data. ([s.d.]). Recuperado 20 de dezembro de
2018, de http://db.csail.mit.edu/labdata/labdata.html
Kertiou, I., Benharzallah, S., Kahloul, L., Beggas, M.,
Euler, R., Laouid, A., & Bounceur, A. (2018). A
dynamic skyline technique for a context-aware
selection of the best sensors in an IoT architecture. Ad
Hoc Networks, 81, 14. https://doi.org/10.1016/j.adhoc.
2018.08.011
Neha, & Saxena, S. (2016). Vector method for ranking of
sensors in IoT. 2016 International Conference on
Inventive Computation Technologies (ICICT), 3, 5.
https://doi.org/10.1109/INVENTIVE.2016.7830231
NOAA
. ([s.d.]). Recuperado 20 de dezembro de 2018, de
https://tidesandcurrents.noaa.gov/gmap3/
Nunes, L. H., Estrella, J. C., Perera, C., Reiff-Marganiec,
S., & Delbem, A. C. B. (2018). The elimination-
selection based algorithm for efficient resource
discovery in Internet of Things environments. 2018
15th IEEE Annual Consumer Communications
Networking Conference (CCNC), 7. https://doi.org/
10.1109/CCNC.2018.8319280
Ostermaier, B., Römer, K., Mattern, F., Fahrmair, M., &
Kellerer, W. (2010). A real-time search engine for the
Web of Things. 2010 Internet of Things (IOT), 1–8.
https://doi.org/10.1109/IOT.2010.5678450
Pascual, D., Pla, F., & Sánchez, J. S. (2010). Cluster
validation using information stability measures. Pattern
Recognition Letters, 31(6), 454–461. https://doi.org/10/
dsk4hq
Pattar, S., Buyya, R., Venugopal, K. R., Iyengar, S. S., &
Patnaik, L. M. (2018). Searching for the IoT Resources:
Fundamentals, Requirements, Comprehensive Review,
and Future Directions. IEEE Communications Surveys
Tutorials, 20(3), 31. https://doi.org/10.1109/COMST.
2018.2825231
Perera, C., Zaslavsky, A., Liu, C. H., Compton, M.,
Christen, P., & Georgakopoulos, D. (2014). Sensor
Search Techniques for Sensing as a Service
Architecture for the Internet of Things. IEEE Sensors
Journal, 15(2), 15. https://doi.org/10.1109/JSEN.2013.
2282292
Phenonet. ([s.d.]). Recuperado 24 de fevereiro de 2019, de
https://www.dropbox.com/s/sizmdrh7l78n1v5/csv.tar.
gz?dl=0
Ruta, M., Scioscia, F., Pinto, A., Gramegna, F., Ieva, S.,
Loseto, G., & Di Sciascio, E. (2019). CoAP-based
collaborative sensor networks in the Semantic Web of
Things. Journal of Ambient Intelligence and
Humanized Computing, 10(7), 18.
https://doi.org/10.1007/s12652-018-0732-4
Schiffman, H. R. (2001). Sensation and Perception: An
Integrated Approach. In Sensation and Perception: An
Integrated Approach (Edição: 5th, p. 12). John Wiley
& Sons.
Shi, H., Wang, H., Huang, Y., Zhao, L., Qin, C., & Liu, C.
(2019). A hierarchical method based on weighted
extreme gradient boosting in ECG heartbeat
classification. Computer Methods and Programs in
Biomedicine, 171, 1–10. https://doi.org/10.1016/j.
cmpb.2019.02.005
Skarmeta, A. F., Santa, J., Martínez, J. A., Parreira, J. X.,
Barnaghi, P., Enshaeifar, S., Beliatis, M. J., Presser, M.
A., Iggena, T., Fischer, M., Tönjes, R., Strohbach, M.,
Sforzin, A., & Truong, H. (2018). IoTCrawler:
Browsing the Internet of Things. Proceedings of The
2018 Global IoT Summit (GIoTS), 6.
http://epubs.surrey.ac.uk/846315/
Wang, H., Tan, C. C., & Li, Q. (2010). Snoogle: A Search
Engine for Pervasive Environments. IEEE
Transactions on Parallel and Distributed Systems,
21(8), 15. https://doi.org/10.1109/TPDS.2009.145
Wang, W., Yao, F., De, S., Moessner, K., & Sun, Z. (2015).
A ranking method for sensor services based on
estimation of service access cost. Information Sciences,
319, 17. https://doi.org/10.1016/j.ins.2015.05.029
Zadeh, L. A. (1965). Fuzzy sets. Information and Control,
8(3), 338–353. https://doi.org/10.1016/S0019-
9958(65)90241-X
GoAT: A Sensor Ranking Approach for IoT Environments
177
