
Towards Learning Analytics Metamodels in a Context of Publishing
Chains
Camila Morais Canellas
1,2 a
, Franc¸ois Bouchet
1 b
, Thibaut Arribe
2
and Vanda Luengo
1 c
1
Sorbonne Universit
´
e, CNRS, LIP6, F-75005 Paris, France
2
Soci
´
et
´
e Kelis, France
Keywords:
Learning Analytics, Models, Model-driven Engineering, Publishing Chains.
Abstract:
In a context of pedagogical resource production via publishing chains that are based on an model-driven
engineering approach, we consider the proposition of a learning analytics implementation. We argue that, by
using the same approach to carry out such an implementation versus a classical one, a series of benefits could
be assessed, whether they are related to the fact that it is using this specific context, methodological approach
or both. Perhaps one of the most particular benefits is the detailed knowledge of the semantics and structure
of any document produced, that could therefore be automatically added to the traces/analysis. Other potential
improvements discussed are: separation of content and form, interoperability, compliance with data privacy,
maintainability, performance, multi format, customization and reproducibility.
1 INTRODUCTION
The intent of the present work is to propose an im-
plementation of a learning analytics solution into an
educational platform design framework that uses a
model-driven approach to design and publish peda-
gogical resources via publishing chains. Although we
define more precisely a publishing chain in section 4,
we can consider for now that it is a technological so-
lution that facilitates producing and publishing struc-
tured documents.
In recent years the growing number of courses and
resources offered by learning platforms on the Web
attracted lots of participants. Learners interactions
with these systems have generated a vast amount of
learning-related data. Learning Analytics (LA) fo-
cuses on the collection, processing and analysis of
such data. The most common definition of learning
analytics is: “Learning analytics is the measurement,
collection, analysis, and reporting of data about learn-
ers and their contexts, for the purposes of understand-
ing and optimizing learning and the environments in
which it occurs” (Siemens, 2011). Learning analyt-
ics is an interdisciplinary field of study
1
combining
a
https://orcid.org/0000-0002-7226-0931
b
https://orcid.org/0000-0001-9436-1250
c
https://orcid.org/0000-0001-8978-0944
1
https://solaresearch.org/about
different disciplines such as data science, statistics,
computer science and, psychology.
According to Wise and Vytasek, when applying
learning analytics, one can focus on: what e-learning
interaction traces need to be captured, how to process
them and how to present them to stakeholders in a
useful way (Wise and Vytasek, 2017). In this work
we take an approach allowing to holistically design
those three aspects. The aim is to create solutions that
support stakeholders on making data-driven decisions
in order to ultimately improve learning, taking advan-
tage of the context of publishing chains to do so.
The rest of this paper is structured as follows: in
section 2 we situate our research with related liter-
ature, in section 3 we define the model-driven engi-
neering methodology principles and in section 4 we
describe how it is used to create pedagogical materi-
als, including a (simplified) practical example of its
phases and actors. In section 5 we detail how, by us-
ing the same methodological principles, we defined a
metamodel dedicated for the application of LA pro-
cesses and its differences to a classical approach. In
section 6 we define and estimate the benefits of our
proposed approach. A discussion can be found in sec-
tion 7.
Canellas, C., Bouchet, F., Arribe, T. and Luengo, V.
Towards Learning Analytics Metamodels in a Context of Publishing Chains.
DOI: 10.5220/0010402900450054
In Proceedings of the 13th International Conference on Computer Supported Education (CSEDU 2021) - Volume 2, pages 45-54
ISBN: 978-989-758-502-9
Copyright
c
2021 by SCITEPRESS – Science and Technology Publications, Lda. All rights reserved
45

2 RELATED WORK
Classical approaches of LA solutions consist of anal-
ysis of vast amounts of data about learning that were
collected through the increasing use of technology
(Ga
ˇ
sevi
´
c et al., 2017). The underlying assumption
is that the interaction data is either already at hand,
or will be collected via the addition of the record-
ing of all student interactions with a given system, for
example using Experience API (xAPI), IMS Caliper,
Learning Context Data Model (LCDM), among oth-
ers.
This approach implies that the data science meth-
ods applied to these data sets in order to calculate and
report indicators – of learning processes, learning out-
comes, and learning activities, among others – usu-
ally happen at a later time, after the decision to col-
lect such data and long after the creation of the actual
pedagogical resources.
This approach not only implies taking time trying
to understand the traces in relation to what one is try-
ing to analyze, but also that the details of the resources
used/traced are usually not available at the traces
level. Some attempts have been made to overcome
this such as with UTL (Usage Tracking Language)
(Choquet and Iksal, 2007), which aims at describing
and operationalizing learning indicators prescribed by
final users. It enables adapting to the described ele-
ments by modifying the information available, using a
model-driven approach. Another approach consists in
creating indicators guided by interaction’s traces then
modeled and leveraged by the Trace Based Manage-
ment System (Djouad et al., 2009).
To the best of our knowledge, no work has been
proposed allowing to specifically define, at the same
time, both the desired LA indicators and the educa-
tional resources production. We argue that, by doing
so, we could enable both the document and its usage
analysis to be closely linked, thus allowing to perform
detailed analysis, among other benefits discussed in
detail below. As the works cited in this section, the
approach we use is the model-driven engineering one,
that has been used in other domains – such as automo-
tive, banking, printing, web applications, among oth-
ers (Hutchinson et al., 2011) –, yet not as much in LA
systems.
3 METHODOLOGY: CREATING
MODELS
When developing complex systems such as publish-
ing chains, model-driven engineering (MDE) is a
methodology that allows one to focus on a more ab-
stract level than classical programming (Combemale,
2008). This practice allows to describe both the prob-
lem at hand and its solution. In computer science,
modeling is widely used in an attempt to control such
complexity (J
´
ez
´
equel et al., 2012), both to create soft-
ware or to validate it. In model-driven engineering
the focus is to create and leverage domain models –
in our case, the educational domain – as a conceptual
model taking into account all the topics related to this
specific task/domain.
Model-driven engineering is a form of genera-
tive engineering (Combemale, 2008) in the sense that
it follows an approach by which all or part of a
computer application is generated from models. To
achieve a given objective, some aspects of reality (or
a solution to a problem) are simplified. This modeling
can also be used to separate the different functional
needs and extra-functional concerns (such as reliabil-
ity, performance, etc.).
A model is therefore a concept or object, often
simplified, perceived as representative of another. It
can be more or less abstract, more or less precise. In
computer science, a model is used to define the de-
sign or operation of a set of computer programs. A
metamodel, in its turn, is a model which defines the
expression language of a model, i.e. the modeling lan-
guage (J
´
ez
´
equel et al., 2012).
A model is an operational resource created by the
modeler that designs the system. A metamodel is the
expression as well as the validation language of this
model. The method consists in generating artefacts
(code if we refer to software development, but other
areas can also be addressed) via the model validated
by the metamodel and a transformation algorithm.
One example of systems based on model-driven
engineering are digital publishing chains. Such sys-
tems use this approach to create models that will then
be used in document production.
4 PUBLISHING EDUCATIONAL
DOCUMENTS VIA MODELS
Pedagogical resources often have a well-known con-
sistency in structure, i.e the parts that compose the
document, and in semantics, i.e., what the type of con-
tent of each part is. For example, the parts could be
an introduction, a few sections on the topic in ques-
tion – a definition, an example, a practical illustration,
etc. –, and a series of exercises/tests aimed at compre-
hension and memorization. Some systems, such as
digital publishing chains, have specialized in assist-
ing the production and publication of such structured
CSEDU 2021 - 13th International Conference on Computer Supported Education
46

documents, especially in their design processes (Ar-
ribe et al., 2012).
Crozat proposes the following definition of pub-
lishing chains: “A publishing chain is a technological
and methodological process consisting in producing a
document template, assisting in content creation tasks
and automating formatting” (Crozat, 2007, p.2, our
translation).
Digital publishing chains allow for documents ho-
mogeneity via systems that logically connect editing
and publishing large amounts of documents. Natu-
rally, the design of models is strongly linked to the
profession in which it fits. The document needs are
analyzed and then formalized in a model, including
structural diagrams. Moreover, such systems support
the separation of content and form (Bachimont and
Crozat, 2004), allowing for authors to concentrate on
the content itself as the form is automatically applied
according to each type of the parts composing the
content. In this way, one format is used for the pro-
duction of content and one (or several) for its publi-
cation, which can include PDF, Web, or presentations
(Bachimont and Crozat, 2004).
According to (Guillaume et al., 2015), other ad-
vantages of using such systems are making teach-
ing practices explicit, sharing of practices, optimizing
production management, and reducing costs in docu-
ment production.
Typically, the document will be based on a model,
that is itself based on a metamodel and sometimes a
metametamodel can also be in place, depending on
the level of abstraction needed. In this context, a doc-
ument primitive (primitive documentaire) works like
a “building brick” as it is the foundation from which
the actual document model will be constructed. It is a
computer code abstracting the essential principles of
documentary objects that later in the chain will allow
the generation of specific code instantiating multiple
document models (Arribe et al., 2012). We illustrate
this process in the next section, allowing to under-
stand the phases and actors involved when publishing
a document using (1) model-driven engineering as the
underlying methodology, and (2) publishing chains as
the context/tool of editing, publishing and diffusing
resources.
4.1 Illustration of the Publishing
Processes
In our context, developers have defined “building
bricks”, called document primitives, which will serve
as a basis for the creation of the document’s models.
This corresponds to having a metamodel in an model-
driven engineering approach (cf. example below).
In the next phase, a modeling tool allows the defi-
nition of any document model desired. In practice, the
so-called modeler, will define a document model us-
ing the available document primitives. The challenge
of this metamodel is to abstract the technical aspects
as much as possible.
Later, an author (a teacher, for example) will use
this document model to create his or her document
such as a course module. The design tool (s)he uses
includes transformation algorithms that automatically
publish the document in several formats such as PDF,
Open Document, Web, synthetic presentation, etc. As
stated before, the interesting aspect here is the sepa-
ration of the content and its format (Bachimont and
Crozat, 2004). We are particularly interested in the
document in its Web format and in the ways in which
it will later be used by its final users (learners).
4.1.1 A Practical Example
In order to understand the phases and roles of the
stakeholders involved in the process of designing doc-
uments for educational purposes via model-driven en-
gineering, we describe here a very simplified prac-
tical example. This example uses the vocabulary of
the Opale model
2
, which is suitable for creating aca-
demic courses (on-site training, distance or blended
learning). Other open-source models are available
to carry out case studies with a gamified twist, cre-
ate exercisers with different modes of execution (self-
learning, evaluation), build question banks for evalu-
ations, etc.
First Phase: The Developer. At first, a developer
defines document primitives such as “text”, “multi-
media”, “quiz”, “organization”, etc. Each of these
bricks (cf. figure 1) is used to build the document
model. They can look like a multimedia block or quiz
in Moodle for instance. It is from these bricks that the
modeler will work, by defining a document model that
meets the needs of a given community of users. Be-
sides the elements created, the language used is there-
fore appropriate for this group/domain, the same ap-
plies to the available transformation functions.
TEXT ORGANIZATIONQUIZMULTIMEDIA
Figure 1: First Phase: Metamodel with the document prim-
itives for our illustrative document modeling.
Second Phase: The Modeler. A modeler then uses
the available primitives on the design tool to define
document models. For example, using a particular
2
Available at: https://doc.scenari.software/Opale/en/
Towards Learning Analytics Metamodels in a Context of Publishing Chains
47

primitive (called organization primitive), one can de-
fine a very simplified model of a “learning activity”
as having one or more:
• “Introduction” (text primitive)
• “Concept” (text or multimedia primitives)
• “Content” made up of parts (text and multimedia
primitives) titled “Information” and “Example”
• “Conclusion” (multimedia primitive)
• “Practice” made up of quizzes (quiz primitive)
As seen in figure 2, the modeler also defines that
a learning module can have one or more “learning
activities”. A “learning activity” must have exactly
one “introduction”, one “conclusion” and a “practice”
part at the end, and include between “introduction”
and “conclusion” one or more “concept” and/or “con-
tent” parts. A “practical” part must have one or more
quizzes.
COURSE MODULE
Learning Activity (n)
Content (n)
Introduction (1)
Concept (n)
Conclusion (1)
Practice (1 - end)
Information (n)
Example (1)
Concept
(n)
Concept
Figure 2: Second Phase: Metamodel used to define the
model for our illustrative document modeling.
If publishing in Web format, the modeler may choose
to have a page created for each “learning activity”.
They may also choose to have a menu reflecting the
document structure created and displayed on the left,
allowing learners to browse the module, either by the
pages names or by jumps to these internal parts of the
page, the blocks.
The modeler therefore defines the structure (each
block and its possible/obligatory components) as well
as the basic semantics (what each block is supposed
to contain) for each document based on this partic-
ular document model, and this information will also
be used by the publishing algorithm. In other words,
the different possible “parts” of the document are pre-
established at the time of modeling and the content
type of each part is defined by the chosen blocks. Sub-
sequently, the semantics is known beforehand, when
creating each document, depending only on the block
types chosen by authors.
Knowing the semantics, for example that a “con-
cept” block was used 15 times in a course, may al-
low the creation of a table of concepts at the end of
the course and to automatically create a sheet-cheat
with the list of concepts and to format them differ-
ently from the rest. Thus, 1/ the author must choose
the model corresponding to the needs of his profes-
sion (or type of course, in our case) and 2/ this will
also have consequences in the phase of trace analysis,
in particular with regard to semantics analysis.
Third Phase: The Author. An author, such as a in-
structor, uses this model to create a course. Its course
consists of four “learning activities”, each with an “in-
troduction”, two “concepts”, four “contents”, a “con-
clusion”, followed by a “practice” activity to check
the understanding of the theoretical content. Once the
course has been created, the instructor can publish it
in a Web format.
CHEMICAL REACTIONS
Combustion of Methane in Oxygen
Introduction - In this module we...
The concept of oxygen combustion is...
[video] We can see how...
[image] To conclude, we see that...
Stages of Experiment A
1. Pour the liquid in the container...
Test your knowledge
Figure 3: Third Phase: Document model used in the instan-
tiating process of our illustrative document modeling.
Fourth Phase: The Learner. Finally, learners access
the published content, open pages in whatever order
they want, scroll through them, take quizzes, etc.
It is worth noting that the framework where the
publishing chains just described are implemented also
include components for the dissemination and ex-
ploitation. These components are themselves con-
ceived using a model-driven approach that simpli-
fies developing new approaches/platforms and main-
taining existing ones, makes those platforms repro-
ducible, and allows including an analyst in the plat-
form design without forcing them to go into the core
code. To summarize, this preexisting system, based
on a model-driven engineering approach, allows the
design of resources production, the publication of
such resources, to define users, store data and interact
with learning management systems via, for example,
Learning Tools Interoperability (LTI).
CSEDU 2021 - 13th International Conference on Computer Supported Education
48

Figure 4: Fourth Phase: Document transformed into a Web format, ready to be used by learners. We added as an example the
visualization of an indicator following the menu (structure) of the course.
5 ADDING LEARNING
ANALYTICS TO THE CHAIN
In a context where the production of document re-
sources for educational purposes is based on a model-
driven engineering approach, we argue that using this
same methodology to implement a learning analytics
environment to analyse the use of these documents
has several benefits.
We started by isolating the concept of a LA indi-
cator. We consider that a learning indicator used in
a learning analytics approach is a calculated measure
(quantitative or qualitative) linked to a behavior or an
activity of one or more learners. The result of the
calculation of the indicator is given back to a human
(administrator, learner, instructor, etc), in one way or
another. It may also be used in the calculation of
other (more advanced) indicators. A simple indica-
tor could be the time spent by students in each section
of a course, whereas a more complex could be the pre-
diction of dropout at week 3 (which calculation could
rely, among other things, on how long students spent
on each section of a course).
Subsequently, we used the model-driven engineer-
ing approach to create the corresponding learning an-
alytics primitives, by abstracting processes and com-
ponents of a learning analytics indicator, dedicated to
the traces analysis cycle.
This metamodel allows modelers to cover the col-
lection of usage traces of the documents. It has the ad-
vantage of allowing to determine, for each indicator,
the traces needed and the information it holds. Thus
instead of collecting traces first and then trying to find
what can be done with them, our approach allows to
start by asking the question of what indicator might
be useful for each situation/course and only then cre-
ate the tracing necessary to do so. This is also an asset
regarding compliance with legal and ethical norms as
only the traces needed for the indicators calculation
are collected, and the purpose of such collection is
clear to the user. Another great advantage here is that
it allows to add to traces the information regarding
the semantics/structure of the document, that is well
known beforehand (cf. section 3).
Furthermore, the metamodel let modelers define
how the calculations will be done and, if it is the case,
from whom any input should be entered. For exam-
ple, the number of concepts visualized before a feed-
back message is shown could be added by the instruc-
tor. It is also possible to determine any preprocess-
ing, post-processing and frequency of (re)calculations
where necessary.
Finally, completing the analysis cycle, the meta-
model allows to determine how results will be pre-
sented. It can range from a raw format (i.e. algorithms
results, patterns), the use of visual representations
(i.e. in a dashboard and using a certain graph, along-
side the menu as a percent bar) or as an automated
action (a notification, an alert with a suggestion, etc.);
and to whom (i.e. roles that can include administra-
tors, pedagogical assistants, instructors, learners, etc).
Thereafter, we describe the phases and roles of im-
plementing a LA cycle using our metamodel by pro-
viding an illustration of the implementation of an in-
dicator. We emphasize how it differs from a classical
Towards Learning Analytics Metamodels in a Context of Publishing Chains
49

cycle regarding the succession of the steps, actors in-
volved and, naturally, its proximity to the content(s).
5.1 Illustration of the Learning
Analytics Processes
For easiness of description we will use a simple indi-
cator – the time spent in each part of a course module
– to illustrate the roles and steps of using the proposed
metamodel. A more complex indicator – aimed at
predicting completion – will also be used as an exam-
ple allowing to indicate the differences of implement-
ing this type of previous data-dependent indicators.
5.1.1 First Step: Assessing Needs
The first step relates to the identification of the ques-
tion to be answered (user needs). Usually, a need
is expressed by one of the stakeholders. This stake-
holder comes from the community using the docu-
ment model in question: an instructor, learner, edu-
cational administrator, etc.
In our example, an instructor wishes to identify
the time spent on each type of the different parts of
his course, he will use the information to understand
the usage of such resources by learners. With this in-
formation, he wishes to understand the importance of
each type of resource and identify sections that may
need a re-design.
Note that this first step does not differentiates
significantly from a classical learning analytics ap-
proach, besides of the actors involved (when the com-
munity discuss the changes to the model).
5.1.2 Second Step: Defining Indicators
The second step consists of defining the indica-
tors that will meet the expressed need. Modeling
stems from the aforementioned definition of indica-
tor. Therefore, on the one hand the modeler will have
to understand the needs of the stakeholder and, on the
other hand, he or she may consult an analyst about
the indicator to conceive it holistically: To whom it is
addressed? Has it already been proposed in the litera-
ture? If it is the case, with what results? How should it
be shown to the users who will consult it (dashboard,
type of graph, warning message, etc.)?
In our example, we assume that the instructor pro-
poses the indicator to the modeler that confirms it is
possible to implement it.
This step differs from a classical approach. Usu-
ally, the e-learning interaction traces are already col-
lected and there is a need to select the relevant ones.
Often this is done by the learning environment expert,
that has in-depth knowledge of the traces collected
and their structure and the analyst will need to work
closely with him.
5.1.3 Third Step: Modeling Indicators
Once all the information has been gathered, the mod-
eler proceeds with the modeling of the indicator. This
modeling concerns three main parts: traces, indicator
and visualization(s).
First, the modeler defines the traces to be gen-
erated to compute the indicator. He or she decides
among other things the type of triggering event of a
log. In our example, the event corresponds to each
block being shown/not shown on the screen (focus in
and focus out). The modeler also indicates the content
of the trace, i.e. the recorded information, – in our ex-
ample, the ID of the block shown and its type/name,
among others. (S)He can also define which parts of
the document are concerned: all the pages, all the
pages and each sub-part (blocks) of the pages (our
case), just the blocks which are “concept” and “in-
troduction”, any attempt to answer a quiz, etc. The
modeler also defines how these traces will be period-
ically converted into ready-to-use tables when calcu-
lating the indicator.
Then, the modeler proceeds to model the indica-
tor itself. He or she defines the inputs necessary. It
can range from a type of trace, as just described, to
an input of a start/end date coming from the instruc-
tor, or another indicator used as input, among others.
The calculations to be performed are coded (applica-
tion of operators) and the type of output indicated. In
our example, a JSON matrix containing the total time
spent grouped by each type of the parts of the docu-
ment. Any preprocessing and post-processing can be
done either in this code or in the previous step by di-
rectly registering information within the stored data,
which can be particularly useful if it is used by mul-
tiple indicators. The modeler also defines the calcu-
lation schedule for each indicator, with the possibility
to identify any incremental processing. The idea is
that this way more efficient calculations can be done,
avoiding to recalculate everything each time an indi-
cator is shown. This logic is not always in place as
usually the interest relies on the result of an analysis,
whereas here the modeler can better care about these
optimization questions and this impacts all users of
the indicator thereafter.
Finally, the modeler defines the transformer used
to produce the visualization through a widget. One
has to define (1) how the result will be returned to the
users (i.e. a bar chart), (2) where it will be included
(i.e. a dashboard), and (3) for whom (i.e. instructors
and learners).
CSEDU 2021 - 13th International Conference on Computer Supported Education
50

Regarding the dropout prediction indicator: as it
is a case of previous data-dependent analysis, the ex-
ploratory analysis is recommended to be made using
data from a previous version of the course to carry out
feature engineering and run different algorithms in or-
der to identify the best performing one related to the
data at hand. Once this analysis has been done (out-
side of the current system) and a data model has been
identified (for example, a decision tree), it is this data
model that will be embedded into the metamodel of
the indicator.
This step is certainly the one that differs the most
from a classical approach of a LA implementation, as
an indicator is usually defined a posteriori.
5.1.4 Fourth Step: Evaluating Indicators
The fourth step consists of making sure results are
beneficial to the stakeholders. As for any educa-
tional intervention there are risks associated such as
incorrect or imprecise interpretation of the informa-
tion provided, for instance a bad interpretation of a
graph or an unexpected effect, such as motivation de-
crease when comparing to others.
Finally, the expected improvement linked to the
need expressed at the start of the project can be as-
sessed, formally or informally, using any research
method allowing to assess the implementation effects,
as in a classical approach. The advantage here is that,
since the document model is used in different con-
texts, an analysis of the results can be more consis-
tent, for example, comparing access to “concepts” in
documents from courses across different knowledge
areas or universities.
6 PROOF OF CONCEPT
6.1 Reification
As indicated in section 5.1, when compared with a
classical learning analytics implementation, the main
difference is in step 3, where the actual model of in-
dicator is defined. Another difference is in the im-
plication of different actors/roles. As the modeler is
already an expert on the document model(s), he or she
can define the traces needed, that relate specifically to
each model structure and semantics, and by doing so,
there is no need to rely on traces generically collected
that frequently require the intervention of an environ-
ment expert.
We implemented the components of the proposed
metamodel in the same tool used to create document
models, as seen in figures 5 and 6. Note that the trans-
formations needed for it to be functional are still un-
der consideration. The components of the metamodel
are currently under evaluation by modelers in order
to assess if the components are sufficient to model a
variety of indicators in different contexts and if any
improvements can be made at this time.
6.2 Potential Benefits
As stated before, the differences on the approach used
possibly allow for an improvement in productivity,
specially regarding scalability. In this section, we
describe different measures and cases that could po-
tentially be improved by using an model-driven engi-
neering approach to implement a LA cycle in a pub-
lishing chain context. Naturally, some of the advan-
tages come from the approach used, some from the
context and, some from the strong integration of both.
6.2.1 Detailed Analysis of a Document
A first aspect to be considered is that, by using model-
driven engineering to produce both the document it-
self and the indicator, allows to create detailed indi-
cators (or add details to existing one) taking into ac-
count (in the traces themselves) the document seman-
tics and/or structure. This fact allows, for instance,
to easily create the indicator given as an example in
section 5.1, i.e. time spent in each type of content
parts (our blocks, i.e. “introduction”, “concept”, “ex-
ample”, etc.), as the information (type of block used)
can be added to the traces to be collected with a few
clicks, linking the document primitive to the learn-
ing analytics primitive. Whereas in a classical ap-
proach one would need to tag a posteriori each part
(having the premise that the document is structured
in a consistent way) that would have to be done al-
most manually, linking each part identifier to a type
of content. And any modification of the content of
the course would either require this tagging to be re-
done, or it would be the instructor’s responsibility to
make sure the tagging remain valid – an error-prone
extra task that they are not an expert at.
The easiness of the implementation of this level
of detailed analysis, integrated to the system, can cer-
tainly be seen as an advantage when considering indi-
cators meant at re-designing courses. Moreover, us-
ing this detailed information as inputs when carrying
out feature engineering for more complex indicators
such as prediction, sequence analysis, among others,
is a promising path we are willing to address in the
future.
Towards Learning Analytics Metamodels in a Context of Publishing Chains
51
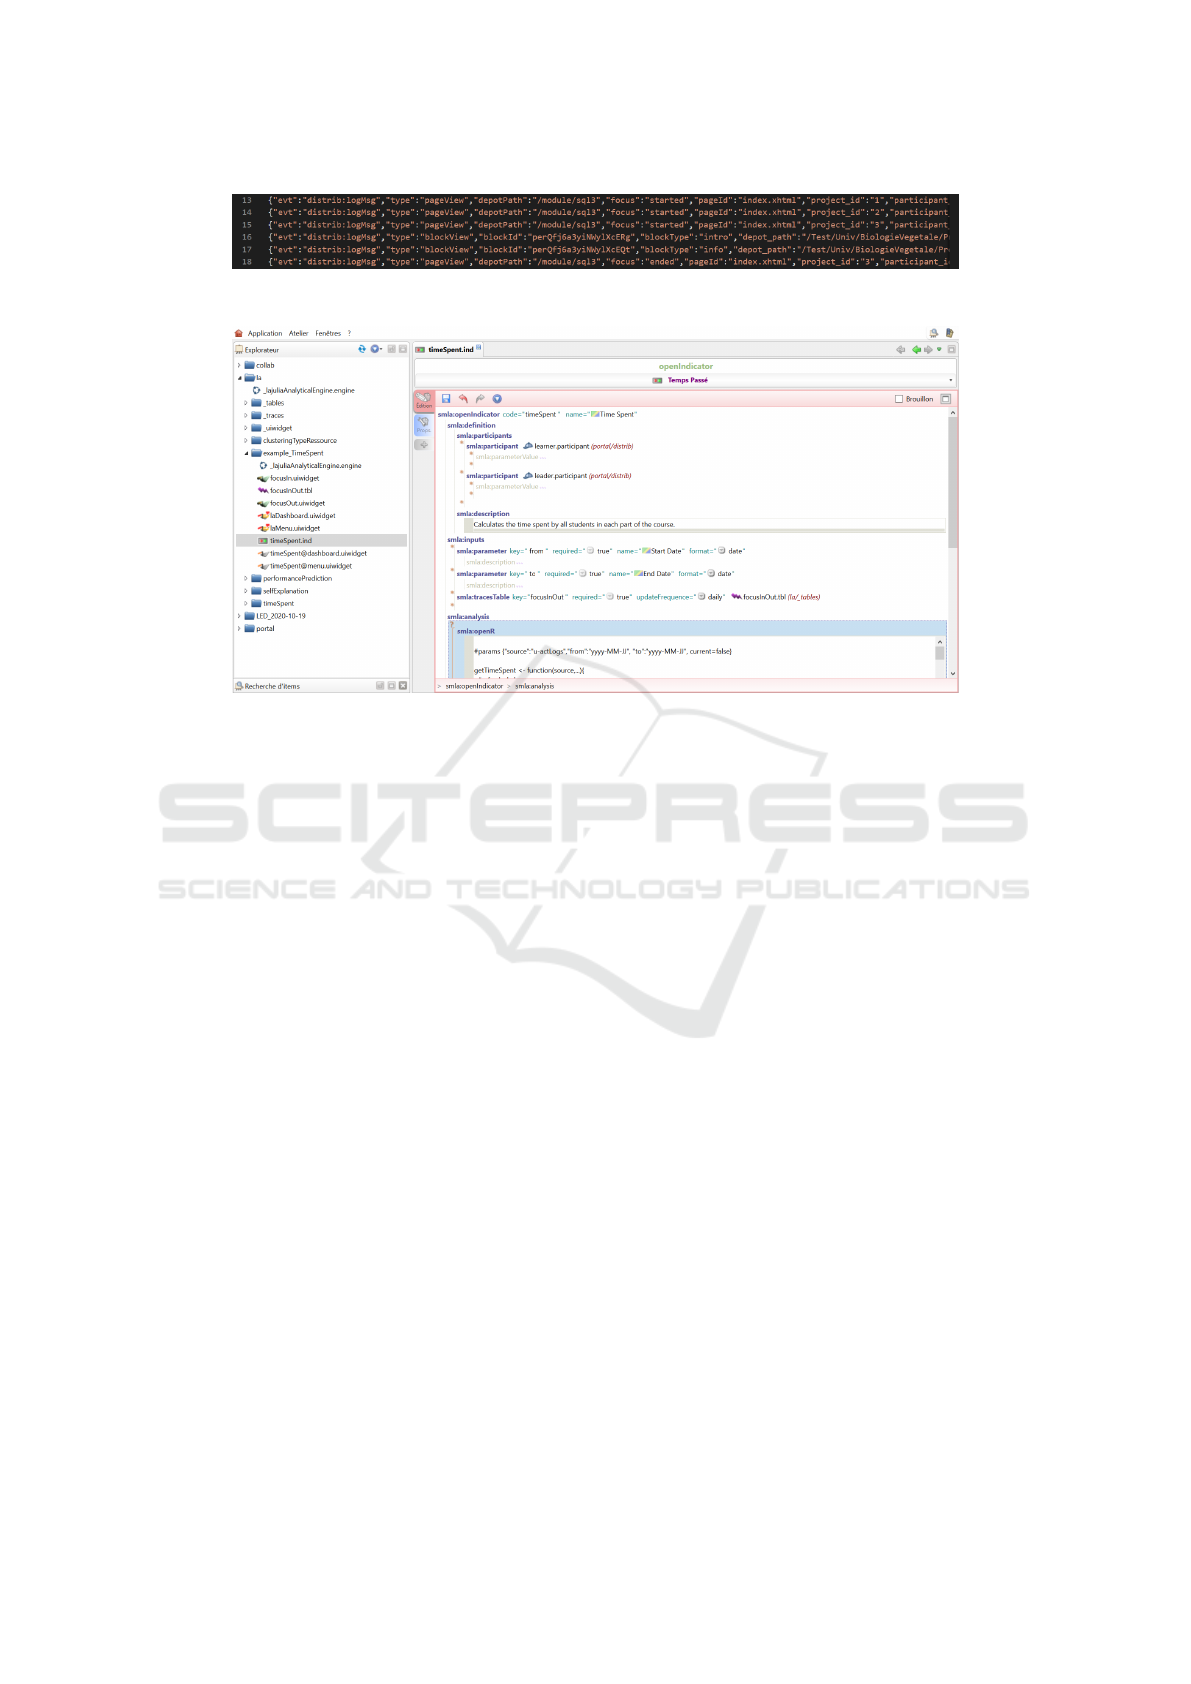
Figure 5: Traces generated with the information of the document included.
Figure 6: The learning analytics modeling of an indicator.
6.2.2 Separation of Content and Form
Habitually, indicators are implemented using one spe-
cific chart as the desired result, often available for
consultation in a dashboard.
Having different learning analytics primitives for
calculation and visualization of an indicator has the
advantage of separation of content and form, in the
same way as documents created using publishing
chains (see section 4. As a result, we can imagine sit-
uations where the same calculation result can be used
in a dashboard, intended at the instructor, and side by
side with the course menu for learners (figure 4. For
our example, the time spent in each part: the former
will go directly to a dashboard to see which parts are
the most time consuming for learners, while the later
can see the time spent without having to stop con-
sulting the content and going to check a dashboard,
maintaining the flow of a studying session.
6.2.3 Interoperability
The interoperability of a LA system ensures the com-
patibility of any type of virtual learning environment
by allowing the integration of different data sources
(Dyckhoff et al., 2012). More broadly, according to
systems engineering, it is a characteristic of a system
allowing it to work with other products or systems,
currently or in the future, whether in its implementa-
tion or in access.
As stated above, traces produced using the pro-
posed approach have the potential of being enriched
with document details. However, if needed by cer-
tain situations – this may be needed when traces will
be analyzed by an external tool –, it is also possible to
create such traces using any given standard (for exam-
ple, xAPI). Doing so may increase the interoperability
of the system, but decreases the advantage of working
with enriched traces.
6.2.4 Compliance with Data Privacy
Compliance with various data privacy laws is cer-
tainly an increasingly important point regarding the
innate requirements of a personal data analysis pro-
cess. The data collected as well as access to it and its
processing thereof must be carefully documented.
In order to justify the tracing, for each piece of
data, the documentation must determine and justify
why this tracing is done, who has access to it, the re-
sulting uses and treatments, etc. In addition, explicit
consent from users is required.
This point has been briefly mentioned before, as
a key difference in the approach discussed here is the
fact that traces are collected because they are going
to be used when calculating a certain indicator that
was modeled as required by a stakeholder. This is a
twist from the approach where all actions performed
in the learning environment are collected and only
later stakeholders will decide how they could use it.
CSEDU 2021 - 13th International Conference on Computer Supported Education
52

As traces are connected to indicators, it will likely
be easier to create a documentation that conforms
to GDPR
3
principles such as communicating specific
purposes for data collected and actors involved in the
data processing. The key idea of only tracing what is
necessary to answer to predefined questions is also an
inherently very GDPR-compliant approach.
6.2.5 Maintainability
Another fundamental benefit in this approach is the
maintainability of the proposed solution. Maintain-
ability measures the effort required to correct or trans-
form the software, but also its extensibility, that is
to say the little effort required to add new functions.
This is potentially where we can find the greatest ad-
vantage of using model-driven engineering in order to
create the learning analytics implementation.
Given our context where many document models
and contexts of use will rely on the same solution,
being able to easily choose and adapt indicators is
essential. Thereby, a modeler can create an indica-
tor for a specific document model and, the fact that it
will potentially be used by a number of users in dif-
ferent contexts, i.e. any document produced using the
document model, from a single source (the modeling)
is a great improvement in maintainability. Moreover,
on the long term, any changes or corrections needed
are to be made at one single code/modelling, reducing
development time, resources and sources of potential
errors.
6.2.6 Performance
The ratio between the quantity of resources required
(means including personnel, time, material, etc.) and
results delivered constitutes performance.
Regarding the proposed approach, we can speak
of performance with regard to the creation of an indi-
cator used in many contexts (any using the same doc-
ument model), of a series of indicators – in a dash-
board, for example – or even of a kind of industrial-
ization of analysis processes, which would allow the
creation of different dashboards adapted to the spe-
cific needs of a series of document models, with a po-
tential saving of time to do this task.
6.2.7 Multi Format
As we saw, in our context a single pedagogical re-
source can be automatically transformed into several
formats as PDF, Open Document, Web, synthetic pre-
sentation, etc. In a situation where a learner will print
3
https://gdpr.eu/
one or two chapters of a course in order to study dur-
ing his or her vacations, we can imagine that, on the
resulting PDF an indicator – say the time he or her has
already spent on each part of each chapter – will be
printed alongside the content. Needless to say, there
will be no trace recorded of his or her studying session
from the resulting PDF, but any data already available
at the time of the transformation of the resource at
hand could be appended to it.
6.2.8 Customization
The possibility of customizing an indicator or a dash-
board has been studied by several authors (Dabbebi
et al., 2017). This may involve offering filtering al-
ternatives or different viewing modes, the choice of
which is made by users according to their preferences
and needs felt during their practices. The fact that
each document model can have its specific indicators
related to its actual usages can also be understood as
a form of customization.
Providing the possibility of customization is cer-
tainly an asset, nevertheless requires ensuring that
users understand the choices available to them, as
well as special attention not to overwhelm the user
with a number of choices – and therefore decisions
– too important to make, which could consequently
inhibit the use of the system.
Using the proposed approach, it is possible to cus-
tomize an indicator in two ways: (1) by proposing
more than one option, such as a visualization inside
a dashboard or alongside the menu, allowing users
to choose the one they prefer; and (2) by remodeling
an indicator, for instance, starting with the model of
an indicator analysing the time spent in each sub-part
(blocks within a page) of the document and chang-
ing it to only show the results of the main parts (each
page) can be done with a few clicks.
6.2.9 Reproducibility
Another important aspect regarding LA implementa-
tions is linked to the need to allow the reproducibil-
ity of any indicators already in place. According to
(Lebis et al., 2018), reproducibility is made up of
three properties, namely:
Replication: the ability to reproduce an identical
analysis, without necessarily taking into account the
variables linked to the context. More precisely, in an
analysis process, replication is considered as the or-
dered succession of operators of such process. This
is because the operators involved in this process are
clearly identified and their order of application is also
well defined (Lebis et al., 2018). An indicator that
Towards Learning Analytics Metamodels in a Context of Publishing Chains
53

has being modeled in one document model can eas-
ily be used (with or without adaptations) in another
document model as the operators needed and their or-
der of application are known, only changes to the en-
try traces (as model’s parts are not the same) should
be adapted, as well as visualization modes, if neces-
sary/desired from the new context.
Repeatability: the property of an analysis process
to be carried out several times, on the same set of data
and with the same configurations, having the same
output results. In other words, this quality makes it
possible to trace the results produced and their con-
sistency (Lebis et al., 2018). Checking the repeata-
bility quality of implemented indicators should be fa-
cilitated as the same implementation would be avail-
able/tested in various practical contexts.
Reuse: the ability of software (or an analysis pro-
cess) to be reused in an application other than that
for which it was designed or in another context. The
same process must then be easily reused on another
data set which is more or less similar to the initial
one. Thus, possible adaptations can be made in order
to adapt the analysis to a similar context, for example,
to another document model, but with particular atten-
tion to guarantee that the foundation of the analysis
process (a learning, theory from which the indicator
was envisaged, for example) are respected and remain
consistent.
Lastly, by using our approach, a large variety of
indicators can be modeled, but it is also possible to
envisage the proposition of a given set of an indica-
tors ready to use (as a single “primitive”/component).
Specifically, an indicator, or series of indicators seen
as most useful/standards, can be modeled with the
primitives we propose and, at a later time, be “con-
densed” as a single primitive to be added to model-
ing processes, facilitating even more their implemen-
tation into other document models.
7 DISCUSSION
In this work we analyse the potential benefits of
implementing learning analytics solutions using a
model-driven approach in conjunction with digital
publishing chains that are also based on the same ap-
proach. The metamodel proposed aims at being suffi-
ciently abstract in order to allow the implementation
of the vast majority of learning analytics indicators,
with the advantage of counting on the prior knowl-
edge of documents semantics and structure.
Future work will be conducted aiming at modeling
a variety of indicators and measuring in more detail
the benefits discussed here.
REFERENCES
Arribe, T., Crozat, S., Bachimont, B., and Spinelli, S.
(2012). Cha
ˆ
ınes
´
editoriales num
´
eriques : allier effi-
cacit
´
e et variabilit
´
e gr
ˆ
ace
`
a des primitives documen-
taires. In Actes du colloque CIDE, pages 1–12, Tunis,
Tunisie.
Bachimont, B. and Crozat, S. (2004). Instrumentation
num
´
erique des documents : pour une s
´
eparation
fonds/forme. Revue I3 - Information Interaction In-
telligence, 4(1):95.
Choquet, C. and Iksal, S. (2007). Mod
´
elisation et
construction de traces d’utilisation d’une activit
´
e
d’apprentissage : une approche langage pour la
r
´
eing
´
enierie d’un EIAH. Sciences et Technolo-
gies de l’Information et de la Communication pour
l’
´
Education et la Formation, 14(1):419–456.
Combemale, B. (2008). Ing
´
enierie Dirig
´
ee par les Mod
`
eles
(IDM) –
´
Etat de l’art.
Crozat, S. (2007). Scenari, la cha
ˆ
ıne
´
editoriale libre. Ey-
rolles.
Dabbebi, I., Iksal, S., Gilliot, J.-M., May, M., and Garlatti,
S. (2017). Towards Adaptive Dashboards for Learning
Analytic: An Approach for Conceptual Design and
Implementation. In Proceedings of the 9th Interna-
tional Conference on Computer Supported Education
(CSEDU), pages 120–131, Porto, Portugal.
Djouad, T., Mille, A., Reffay, C., and Benmohamed, M.
(2009). Ing
´
enierie des indicateurs d’activit
´
es
`
a partir
de traces mod
´
elis
´
ees pour un Environnement informa-
tique d’apprentissage humain. Sciences et Technolo-
gies de l’Information et de la Communication pour
l’
´
Education et la Formation, 16(1):103–139.
Dyckhoff, A. L., Zielke, D., Chatti, M. A., and Schroeder,
U. (2012). Design and Implementation of a Learning
Analytics Toolkit for Teachers. Educational Technol-
ogy & Society, 15(01).
Ga
ˇ
sevi
´
c, D., Kovanovi
´
c, V., and Joksimovi
´
c, S. (2017).
Piecing the learning analytics puzzle: a consolidated
model of a field of research and practice. Learning:
Research and Practice, 3(1):63–78.
Guillaume, D., Crozat, S., Rivet, L., Majada, M., and Hen-
nequin, X. (2015). Cha
ˆ
ınes
´
editoriales num
´
eriques.
Hutchinson, J., Rouncefield, M., and Whittle, J. (2011).
Model-driven engineering practices in industry. In
Proceedings - International Conference on Software
Engineering, pages 633–640, New York, New York,
USA. ACM Press.
J
´
ez
´
equel, J.-M., Combemale, B., and Vojtisek, D. (2012).
Ing
´
enierie dirig
´
ee par les mod
`
eles - Des concepts
`
a la
pratique. Ellipses, Paris.
Lebis, A., Lefevre, M., Luengo, V., and Guin, N. (2018).
Capitalisation of Analysis Processes : Enabling Re-
producibility , Openess and Adaptability thanks to
Narration. In LAK ’18 - 8th International Conference
on Learning Analytics and Knowledge, pages 245–
254, Sydney, Australia.
Siemens, G. (2011). Learning and Academic Analytics.
Wise, A. F. and Vytasek, J. (2017). Learning Analytics Im-
plementation Design. In Lang, C., Siemens, G., Wise,
A., and Ga
ˇ
sevi
´
c, D., editors, Handbook of Learning
Analytics, chapter 13, pages 151–160. SoLAR, first
edition.
CSEDU 2021 - 13th International Conference on Computer Supported Education
54
