
An Empirical Study on Low-cost, Portable Vehicle’s Weight
Estimation Solution using Smartphone’s Acceleration Data
for Developing Countries
Saima Mohan and Prashant Kumar
Hitachi India Private Limited, Research and Development Centre, Bangalore, India
Keywords: Accelerometer, Speed, Smartphone Sensor, Vehicle Weight Estimation, Intelligent Transportation System.
Abstract: One in every three trucks in developing countries are overloaded, causing damage to roads and susceptible to
accidents. Conventionally, vehicle’s weight is measured at fixed weigh stations and result in high traffic
congestions at toll booths. To improve highway traffic and enhance regulation, we propose a low-cost,
portable sensor-based system viable for continuous real-time assessment of vehicle’s weight. A smartphone-
based sensing device is installed in vehicle and weight is estimated by applying multiple linear regression
model on acceleration data. In this paper, we include statistical features having relationship with target
variable. A consistent model performance of vehicle’s weight estimated at all speed ranges is established; we
also evaluate the improvised model under engine idling state. An increased accuracy is obtained with error of
2% in engine idling state and overall system error of 6% with vehicle in motion. A heterogenous data source
(such as vehicle class, load condition, goods, sensor locations, etc.,) of vehicle operating on Indian highway
segment are collected to evaluate model robustness. With exploitation of big data and advanced analytics;
advent of this solution will leverage contribution in Intelligent Transport System, focused towards smart and
sustainable transportation for ASEAN region.
1 INTRODUCTION
Logistics is one of the important sectors for a
country’s economy. Efficiency improvement in this
area can boost economic growth, increasing export
through global supply chains and helps in generating
employment. The robust growth in manufacturing
envisioned in developing countries like India is
through Government initiatives like “Make in India”,
which demands high level of logistic efficiency. It has
been reported, due to poor logistics, management has
led to unsafe practices such as overloading of trucks,
compromising road safety both for truck drivers and
other road users. In reports from developing countries
such as India, it is stated that National highways
connecting the major corridors to metro cities like
Delhi, Kolkata, Chennai, Kochi, Mumbai account for
less than 0.5% of the road network capacity but still
carry more than 40% of the freight movement by road
(NITI Aayog, 2018). Trucks spend just 40% of their
time moving on the road. The rest of the time is taken
up at checkpoints and tollgates. India Government in
July 2018 announced the increase in axle load limit to
25%. While experts feel overloading will continue,
and industry players expect the “life of roads” to
decrease. With the revised permissible weight for the
transport vehicles, the state enforcement authorities
are requested to rigorously enforce the regulations
and take strict action against overloading by goods
vehicles on roads. Similar issue exists in other
developing countries too, for example according to a
case study of Indonesia as provided by (APEC
Vietnam, 2017), 22% of trucks exceed the legal 10
tonne single axle dual tyre limit. In Central Java, 38%
of trucks exceed pavement design limit. 6.5% of the
axle loadings that exceeded the 10-tonne limit caused
90% of pavement damage.
Overloaded trucks also add to air pollution in the
city as well, as emissions from such vehicles is
significantly higher than trucks weighing within the
prescribed limits.
Challenges associated with Weigh-in-Motion
(WIM) system is installing sensors in the roadway
pavement. They require temporary roadway closure,
pavement cuts for placing the sensors. Pavement at
the site must be sufficiently smooth for a minimum
44
Mohan, S. and Kumar, P.
An Empirical Study on Low-cost, Portable Vehicle’s Weight Estimation Solution using Smartphone’s Acceleration Data for Developing Countries.
DOI: 10.5220/0010402600440055
In Proceedings of the 7th International Conference on Vehicle Technology and Intelligent Transport Systems (VEHITS 2021), pages 44-55
ISBN: 978-989-758-513-5
Copyright
c
2021 by SCITEPRESS – Science and Technology Publications, Lda. All rights reserved

distance before and after the location of the weight
sensor to minimize the influence of vehicle dynamics
on the weight measurements as mentioned in (Weigh-
in-motion, Pocket Guide, 2018). A huge maintenance
and rehabilitation cost of WIM is required to increase
lifespan of WIM installation.
As a potential use case of ITS solution for Traffic
Safety on highways serving central and state
requirement to curb overloaded vehicle on national
and state highways, we propose a smart IoT sensor-
based technology. This system is easy to handle by its
users, portable, and requires minimum cost to
maintenance, difficult to defeat and provide reliable
information to the concerned regulators by
continuously monitoring and estimate weight from
moving vehicles on road.
Vehicle’s weight and its relationship to road
management is been identified as an important topic
of research in Transportation Engineering. In this
paper, we brief accelerometer-based sensing
techniques that are being used to determine
behaviours of vehicle dynamics in real-world
scenario of heavy-duty vehicles. The state-of-the art
Vehicle’s Weight Estimation by (Phong X. Nguyen et
al., 2018) uses smartphone’s acceleration data with
statistical features to predict the weight. However, the
method requires the vehicle to be at certain speed
range of 20-22 kmph to estimate vehicle’s weight
accurately and inconsistent for other speed ranges. In
real-time scenarios the vehicle’s weight requires to be
monitored continuously for violations, which limits
above method for such deployment.
In this paper, we aim to extend the method to
overcome the mentioned challenges, (a) evaluate
model performance consistency at different vehicle
speed profiles while vehicle is in motion on road, also
including vehicle in static state i.e., engine idling
condition; and (b) assess the optimal sensor location
for deployment on vehicle by evaluating with
heterogenous vehicle data.
Initially, a feasibility study was conducted to
estimate the vehicle’s weight method on data
obtained from different sources. The method failed to
provide a stable result due to variability of data source
as identified in Table 1. We then study in detail
different speed profiles of vehicle undergone during
the journey and propose an improved multiple linear
regression model by extracting more statistical
features from linear acceleration data which shows
high significance with load factor. The improved
method estimates vehicle’s weight with an average
error of 1800 kg, which accounts for 5.5% of true
average vehicle’s weight with vehicle in idling
condition; and 1932 kg, which accounts for 5.7% with
vehicle under constant speed range. We also compare
the model performance with other speed profile. We
extend the validation of our improvised method on
Indian road segment considering variability of data
with combinations of vehicle factors such as vehicle
class type, manufacture make, load, and goods. The
results obtained confirm the validity of applying the
improved method for determining the weight of
vehicle across vehicle class types and for all speed
ranges.
As a pilot project we likewise mount sensors on
three different locations in each vehicle to evaluate
the performance of our proposed solution and assess
which sensor location mount is ideal for our solution
considering as a system.
The rest of the paper is organized as follows.
Section 2 discusses related work on vehicle’s weight
estimation. Section 3 presents our proposed method.
In Sections 4 and 5 we present our experimental setup
and evaluation of the experimental results. In Section
6, we discuss the strengths and weaknesses of our
method. We conclude in Section 7 with a summary
and details on future work.
2 RELATED WORK
We identify that Weigh-in-Motion (WIM)
technology (Magdalena et al., 2020) is the closest
competitor to the technology under development,
some of which have accuracy more than 95%.
However, the technology is based on static sensors
over which the vehicle moves at low speed (LTBP,
2016). This solution however is limited to toll way
deployment. (Kadlecek et al., 2005) describes a
weight estimation method that measures the energy
output from engine of a given vehicle and measures
the acceleration derived of it. Here, we take the
inspiration of including energy as one of the
explanatory features to our model. (Jyotishman
Ghosh et al., 2017 and Nan Lin et al., 2019) describes
a real-time vehicle mass estimation from CAN data
and drivetrain torque observation. This technique
considers different driving forces acting on
longitudinal motion, where majority of contribution
is due to traction and braking forces. (Viengnam
Douangphachanh et al, 2014), describes collecting
sensing data from android smartphone. They find a
relationship of acceleration data with road roughness
condition and its significance partially dependent on
speed. This work is being investigated in frequency
domain to analyse the behaviour of road roughness on
an average speed. (Joshua E. Siegel et al., 2015),
explore a novel application of fault detection in
An Empirical Study on Low-cost, Portable Vehicle’s Weight Estimation Solution using Smartphone’s Acceleration Data for Developing
Countries
45
wheels tires and related suspension components in
vehicles. The smartphone is mounted vertical on
dashboard of a vehicle and validation is performed on
at least two different vehicle model. The approach
mentioned in this research, is referred for further
analysis in our proposed development. (Phong X.
Nguyen et al., 2018), uses smartphone-based sensor
to estimate vehicle overloading, and claims to achieve
an average 5.89% error on true vehicle's weight,
however the model requires the vehicle to run at
certain speed range only. For other speed ranges, the
model error is high, and smartphone is placed on
truck chassis within an encapsulated box. These two
factors inspire us to derive at a more robust solution
experimenting on different vehicle model and roads
of Indian highways.
The benefit with the proposed method is, we will
be able to assess at what speed zone the model
performance is high; and which placement of mobile
sensor on vehicle gives least accuracy error against its
actual weight. For vehicle overload detection as a
system, one can further make use of the classification
method, provided, payload weights are known prior;
and included as an exploratory variable to model as
described by the author, which is currently not in
scope of this work.
3 IMPROVISED VEHICLE’S
WEIGHT ESTIMATION
METHOD
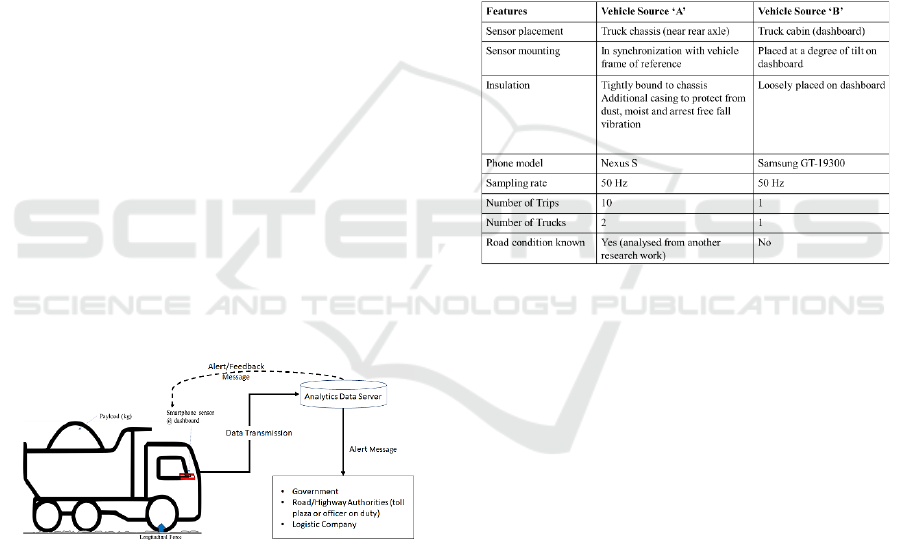
Figure 1: Vehicle Overloading Control System (Phong,
2018).
Described in Figure 1, is the proposed ubiquitous
system for detecting suspicious overloaded vehicle
running on highway and send notification to
concerned authorities in real-time. A smartphone
mounted on the vehicle is enabled for capturing the
vehicle registration, driver information and transmit
along with data collected by sensors via cellular
network to the centralized server. The capture of data
is enabled batch-wise, which is received at analytics
data server where our proposed model is deployed for
prediction of weight as part of backend process. The
estimated weight is compared with legal permissible
weight to determine if vehicle is overloaded in the
system. If vehicle is determined to be overloaded, the
vehicle and driver information are notified to the road
authorities, traffic police, and logistic company.
Based on the event information shared to the
authorities a penalty will also be processed and sent
to the driver of vehicle. All these processes are
automated, and remotely monitored with high
efficiency.
Table 1: Comparison of data specifications from two
different sources.
To improve the accuracy of Vehicle’s Weight
Estimation (VWE), our methodology is based on the
significant correlation of vehicle’s payload on
vertical acceleration got from smartphone’s
acceleration sensor data. Heavier the payload lesser
dispersed are the vertical acceleration and vice versa
for vehicle with no payload or partial payload. The
payload material also significantly plays a role which
can be considered as a future work considering the
amount of data availability. Along with the statistical
features being considered from the baseline method,
we propose more features considering the higher
order analysis and frequency analysis of vertical
acceleration data. We continue to improve the
multiple linear regression model to improve accuracy
of VWE solution. The model is evaluated on 75-25 %
ratio of dataset. In our observation, the vehicle at
static i.e., idling condition and vehicle with constant
speed profile shows stable response of vehicle’s
vertical acceleration. Due to minimum impact from
road surface condition; and engine response on
acceleration/deceleration event.
VEHITS 2021 - 7th International Conference on Vehicle Technology and Intelligent Transport Systems
46
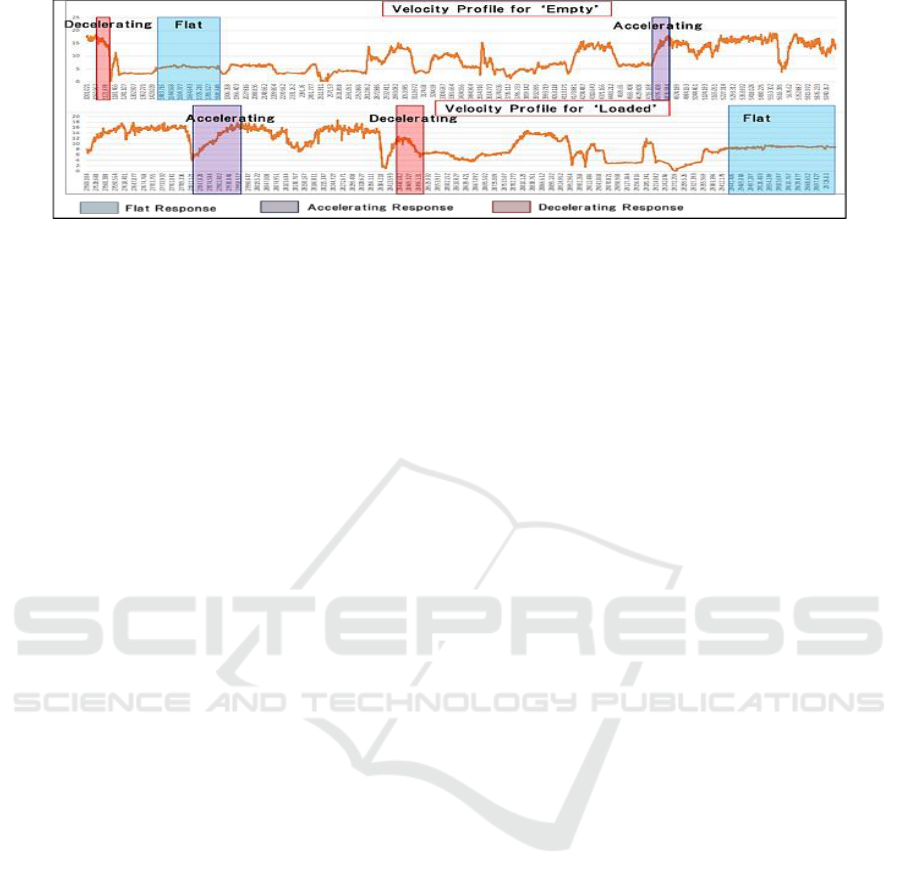
Figure 2: Depiction of random pair of velocity profile segments ‘Flat’, ‘Accelerating’, and ‘Decelerating’ for ‘Empty’ and
‘Loaded’ vehicle.
Therefore, it is essential to consider the influence
of such statistical factors including the vehicular
velocity while considering a generic estimation
model to predict weight.
In this section, a comparison of data specification
got from two different sources; observations of data
analysis with vehicle under ‘Empty’ and ‘Loaded’
conditions; identification of vehicular speed
category; and construction of estimation model are
described below. Here, we do not consider the
different load category within the class of vehicle
model, since it is already proved in baseline model
(Phong X. Nguyen et al., 2018). The supervised
classification model result for identifying different
vehicle load category, can be included as an encoded
exploratory variable to improve estimation accuracy
of multiple linear regression model.
As indicated in Table 1 the accelerometer data
received from vehicle source ‘A’ is compared with
accelerometer data got from vehicle source ‘B’. It is
observed, the sensor placement, mounting, insulation
and vehicle trip parameters as mentioned are
different; and thus, sets the challenge to existing
baseline model to predict accuracy with high
precision. Here, we compare the results and propose
features which can be utilized for prediction of
vehicle weight at different speed categories and
smartphones positioned at different locations.
3.1 Velocity Profile Analysis
We observe in total the trip information has had
varied range of speed pattern, which may be due to
(a) terrain, (b) traffic conditions, and (c) road
conditions. To evaluate the obtained data for
feasibility study, we investigate the response of
baseline VWE model with different patterns of
velocity profiles. The different velocity profile is as
presented in Figure 2.
From the velocity profile, we consider sub-portion(s)
of raw data as indicated in different colours in Fig. 2
comprising off and classified to categories such as:
i. Flat response (same range of speed)
ii. Accelerating response (velocity ramp up)
iii. Decelerating response (velocity ramp down)
3.2 Feature Extraction
The single trip vertical acceleration sensor data is
investigated both in time and frequency domain. In
time domain, we explore the relevance of statistical
features derived from ‘Empty’ and ‘Loaded’ dataset
to estimate vehicle weight. The details of time-
domain analysis are as mentioned in 3.2.1. In
frequency domain, we analyse the spectral
information of measured raw acceleration data,
details are as mentioned in 3.2.2.
3.2.1 Time Domain Analysis
Considering z-axis of tri-axial accelerometer i.e.,
linear accelerometer; the vertical acceleration
captures effect of longitudinal movement of a body
i.e., vibration from road with effect of mass. From
each dataset ‘Empty’ and ‘Loaded’, a defined length
of window sample (here we consider 5 second), non-
overlap in nature; from which ‘N’ number of
segmented outputs are generated. These segmented
raw data are further used for feature extraction.
To analyse in detail, we consider the vertical
acceleration (z-axis) data, with an average response
of 10 segmented data for a defined window size (5
seconds) is as shown in Figure 2.
The features derived are further described below.
i. Average of Upper and Lower Acceleration.
The upper and lower acceleration threshold value is
set +/- 1 of median value of vertical acceleration for
each window sample computed. The mean of data
points satisfying the condition is calculated.
Acceleration value along z-axis of source ’B’ data is
different from z-axis acceleration value of source ’A’
An Empirical Study on Low-cost, Portable Vehicle’s Weight Estimation Solution using Smartphone’s Acceleration Data for Developing
Countries
47
dataset; this is due to change in sensor placement,
orientation and vehicle model, refer Table 1. In case
of such variations, a possible method to rectify can be
by applying Euler transformation. To negate the
effect of different orientation with placement of
sensor, one possible solution is to consider the
transformation in android application interface. In
this experiment, we have considered the
transformation matrix to be included for sensor axis
correction in our second phase of evaluation where
we consider different sensor position.
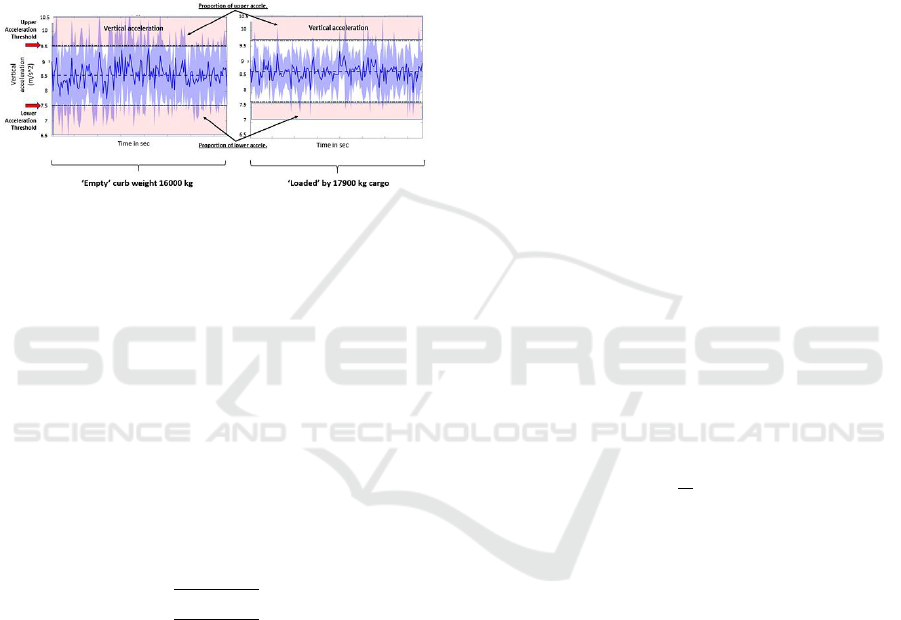
Figure 3: Average response of z-axis vertical acceleration
profile for ‘Empty’ and ‘Loaded’ dataset.
ii. Proportion of Upper and Lower Acceleration.
Based on the upper and lower acceleration threshold
value set, we consider the ratio of data points in upper
& lower proportion range to total number of samples
in the window (refer Figure 3, red highlighted
portion).
iii. Standard Deviation.
Is measured to quantify the amount of variation in
signal. Consider the random time-series signal
Number of variables available in the data distribution
and denoted by .
The standard deviation is calculated as shown in
Equation 1.
(1)
iv. Mean Absolute Difference.
Is measured to compute the average absolute
difference of discrete values within a window sample.
From Figure 3, it is observed the number of data
points considered in Proportion of upper and lower
acceleration (within highlighted red box), is lower in
‘Loaded’ set when compared to ‘Empty’ set. This
constitutes the relationship between mass and
acceleration. The magnitude information got from
continuous time-series data alone is in-sufficient for
a model to predict the vehicle’s weight.
Henceforth, in this feasibility study, in addition to
already considered baseline features, we explore the
influence of statistical features derived from higher
order moment of probability distribution of each
dataset.
The primary hypothesis of this research is that the
accelerometer data parameters both unique and
derived has significant impact on the weight
estimation of a vehicle. To validate the hypothesis,
we consider the probability distribution of sample of
data from each ‘Empty’ and ‘Loaded’ cases,
respectively. The statistical hypothesis considered to
evaluate the relation of histogram to weight is;
The formulation of test statistic is to compute the
measure of significance of feature set and weight. We
use p-value to weigh the strength of evidence against
the null hypothesis. One-sample T-test in R is
considered for the features mentioned here after,
whose p-value <2.2e-16, indicates strong evidence
against the null hypothesis.
Probability distribution function (PDF) is a
statistical function that describes all the possible
values and likelihoods that a random variable can take
within a given range. Here, we normalize the relative
probabilities by a number (number of elements in
the input data) as shown in Equation 2:
(2)
where,
is the bin value
is the number of elements in the bin
From PDF of 2 consecutive segmented data of
‘Empty’ and ‘Loaded’ datasets (refer Figure 4), the
corresponding ‘Median and ‘Standard Deviation’ are
plotted. The green dotted line plotted in Figure 4,
marks the median for (a) Empty (8.25 g) and (b)
Loaded (8.65 g). The red dotted line indicates the
Standard deviation (Sd) computed for (a) Empty
(1.31) and (b) Loaded (0.52).
The Standard deviation (Sd) has reduced for
‘Loaded’ case, but not sufficient to validate
.
Henceforth, we consider alternative indicators of
distribution, i.e., third and fourth order moment of
distribution Skewness and Kurtosis.
VEHITS 2021 - 7th International Conference on Vehicle Technology and Intelligent Transport Systems
48
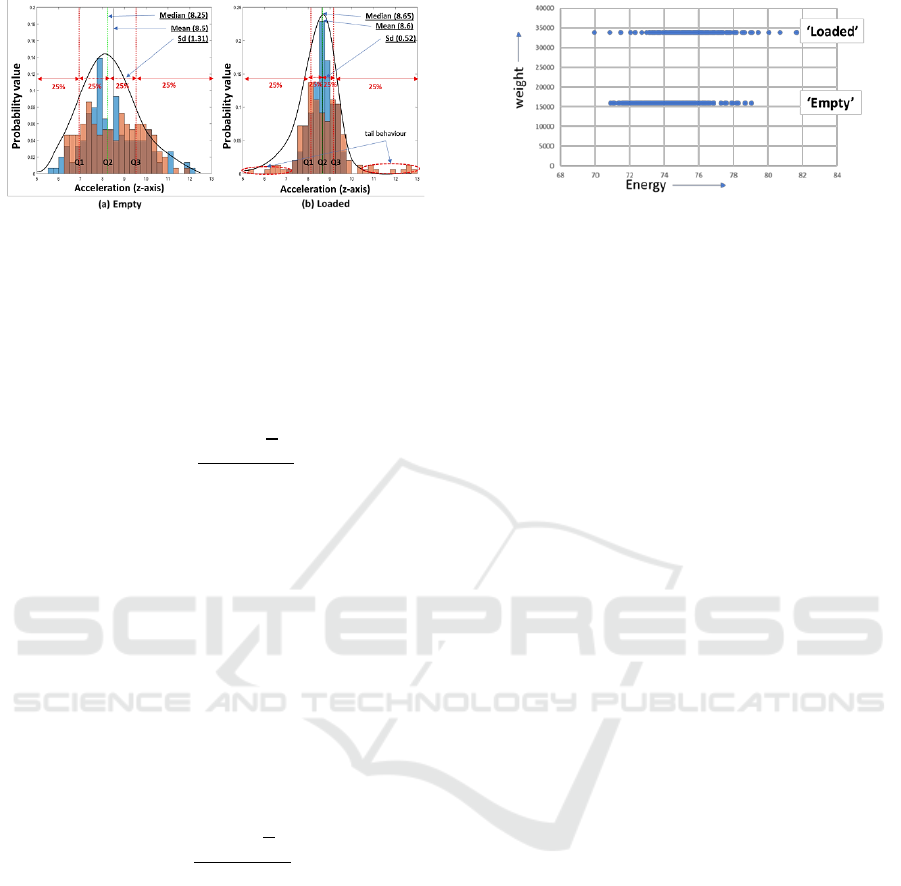
Figure 4: An example of Probability density with quartiles,
Sd, Median, and Mean for (a) ‘Empty’ and (b) ‘Loaded’
case.
v. Skewness and Kurtosis.
Skewness, measures the degree of distortion from the
symmetrical bell curve or normal distribution. It is
measured as the third moment of probability
distribution as indicated in Equation 3.
(3)
In general terms, a normal distribution will have a
skew of zero under a bell curve; in our
experimentation for Flat Response of velocity profile,
on an average shows positive skewness; ‘Empty’ (on
an average = 0.13) case being more skewed than
‘Loaded’ (on an average = 0.037). This response is
subject to vary case to case.
Kurtosis is measured as the fourth moment of
probability distribution as indicated in Equation 4.
They measure extreme values in either tail, here
in Figure 4(b), it is observed persistence of tail
behaviour highlighted in red as an example; and
narrow Peakiness of distribution for ‘Loaded’ (-0.02),
when compared to ‘Empty’ (0.02) as seen in Fig. 4(a).
(4)
vi. Quantiles.
Is statistical measure with cut points dividing the
range of a probability distribution into continuous
intervals with equal probabilities. In our experiment,
it was observed the Standard deviation (σ) for normal
distribution is not sufficient; hence Quantiles (2σ, 3σ)
i.e., Q1, Q3 are considered.
vii. Energy.
From Figure 5, it is observed there is high
significance of vehicle weight with amount of energy
dissipated from vehicle. Heavier the load, higher the
range of energy. Hence, in consideration to
improvement of baseline model we include ‘energy’
variable in final regression equation.
Figure 5: Relationship of Energy with weight of vehicle.
Thus, in this experiment, with measure of
Kurtosis, Skewness, Quantiles, and Energy derived
from sample windows; we can validate the rejection
of
.
3.2.2 Frequency Domain Analysis
In this research, the frequency response of
acceleration measured under two conditions with
vehicle Engine in ON state and with payload (kg) are
(a) vehicle idling and (b) vehicle in motion. For data
measurement, the assumption is as the vehicle’s
engine is ignited (ON), the sensor recording begins,
by which the accelerometer measurement starts
recording the vibration due to throttling of engine and
chassis; and with payload added to empty vehicle,
there is expected longitudinal force acting against the
mass lowering the vibration amplitude when
compared to information gathered from empty
vehicle alone. Further to this, our proposition is,
overload of vehicle occurs with payload added when
vehicle is brought to a halt and idling (stationary with
engine ON). Henceforth, we analyse for both vehicle
in idling state along with vehicle in motion. We
consider the Welch’s power spectral density (PSD)
method, also called the periodogram method for
estimating power of a signal at different frequencies.
The PSD is computed for (a) Vehicle at Rest/Idle, and
(b) Vehicle in motion with signals sampling
frequency at 50 Hz. From power spectrum in Figure
6, it is observed for (b) Vehicle in motion, there
appears presence of prominent signal strengths as
highlighted in red arrow in frequency range [5 to 20]
Hz infused due to certain external factors unknown to
trial. Whereas, in (a) Vehicle at Rest/Idle, the signal
has a smoother roll-off when compared to PSD in (b);
which indicates the signal is free from influence of
other external factors except that of vehicle’s engine;
and suitable for extracting information from vehicle’s
linear accelerometer sensor data and its relationship
with mass.
An Empirical Study on Low-cost, Portable Vehicle’s Weight Estimation Solution using Smartphone’s Acceleration Data for Developing
Countries
49

Figure 6: Power spectral density response of (a) Vehicle at
Rest/Idle and (b) Vehicle in motion with sampling
frequency of 50 Hz.
viii. FFT Function.
In addition, since the vibration component in this test
experiment is unknown, we limit ourselves to
compute amplitude and phase response of the signal
only from each sample window; and add to the feature
set list.
The additional indicator features of accelerometer
data derived from time-frequency analysis as detailed
in 3.2 are listed in Table 2. This table contains
features considered apart from time domain features
considered in baseline solution.
3.3 Estimation of Vehicle’s Weight
During the evaluation process, stepwise bi-directional
Akaike information criterion (AIC) regression
algorithm is used to derive the best features from the
accumulated feature set list (Total of 20 in number)
as mentioned in 3.2. The final model may contain
smaller number of features to reduce the complexity
but maintain same level of accuracy or better. For
evaluation purpose, 75% of data sample created are
used for Training and remaining 25% for Testing.
AIC regression algorithm was implemented over a
batch of data samples considering the new set of
feature list; a set of best features were provided as
output and referred as final model.
Table 2: Summary list of additional time-frequency
statistical indicators considered.
Results of evaluation on improvised method and its
comparison with baseline model is presented in
section 4 for further discussion.
4 FEASIBILITY STUDY AND
PRELIMINARY RESULTS
Based on the input shared as ground truth, we identify
the trip begin and end time-stamp in seconds for
‘Empty’ and ‘Loaded’ vehicle trip respectively; here
a continuous 2 hour sensor inputs of vehicle running
with and without load condition are extracted from
raw data for experiment evaluation. The sensor inputs
extracted are GPS, 3-axis accelerometer, and
gyroscope data information. The data is processed at
a sampling rate of 50 Hz. As ground truth, for
example, Empty refers to vehicle (truck) curb weight
of 16000 kg; and Loaded refers to vehicle (truck)
gross weight of 33900 kg after loaded with goods
weighing 17900 kg. The reference to time of vehicle
running with and without load are also captured. The
afore mentioned analysis is conducted offline. We are
currently in final phase on development of system
that can automatically capture the above-mentioned
sensor information in real-time.
4.1 Baseline Evaluation
We evaluate the vertical acceleration with baseline
model considering the null hypothesis that velocity
has no relationship with weight of vehicle. In Table
3, in 2nd and 3rd column we project results of VWE’s
mean absolute percentage error (MAPE) for baseline
solution with and without velocity condition
respectively; in 4th column VWE response with
improved model without any velocity conditions, and
in 5th column i.e., last column we represent the
results obtained of improved VWE model
considering a flat response pattern of vehicle velocity.
Note: In this vehicle data, the highest speed range
observed is 15.0 to 20.0 m/s.
Table 3: Baseline vs Proposed model with and without
velocity condition.
VEHITS 2021 - 7th International Conference on Vehicle Technology and Intelligent Transport Systems
50
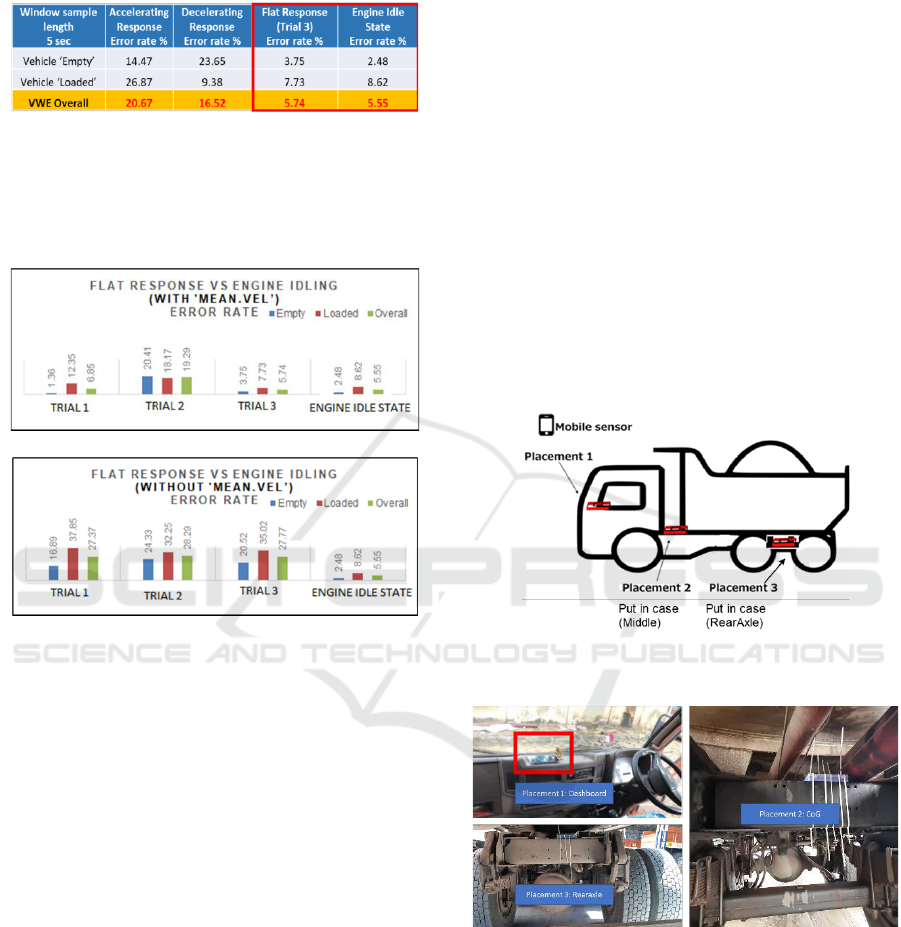
Table 4: Error rate (MAPE) of different velocity profile vs
engine idling state.
4.2 Evaluation on Velocity Profiles
Considering the improved model to efficiently predict
vehicle’s weight we continue to evaluate data for
possible different scenarios.
(a)
(b)
Figure 7: Error rate measure of flat response trials vs Engine
idle state (a) with ‘mean.vel’; (b) without ‘mean.vel’
variable.
As described in Figure 2, section 3.1, different
velocity profile of vertical acceleration is considered,
and their respective MAPE (error rate) are tabulated
in Table 4. We also compare results against the
Engine Idle state as explained in frequency domain
analysis in 3.2.2. For this experiment, a 5 sec window
size for each of the responses are considered; the
prediction performance is gathered individually for
‘Empty’ and ‘Loaded’ case and an overall error rate
of model against each of the response is tabulated in
last row in Table 4.
Additionally, we evaluate the VWE model and its
dependency with velocity for various random pair of
flat response segments as shown in bar graph in
FigureFigure 7. The error rate results are projected
where (a) refers to VWE response considering its
dependency with velocity within the segment, and (b)
without considering velocity variable in improvised
model.
5 RESULTS OF ACTUAL DATA
After the feasibility study of improved VWE method,
we evaluate this model on actual data collected from
Indian road segment. Here, the smartphones are
mounted at three different locations on to the chassis
of each vehicle as shown in Figure 8. The smart-
phones in Placement 2 &3 are put in a case to restrict
any free movement of smartphone within the case
during the journey as shown in Figure 9. The
smartphone in Placement 1 is placed over the
dashboard of the vehicle and tapped to avoid any
lateral shifts or any accidental fall-off. We do not
make use of mobile holders here, as it may lead to
additional vertical vibration infused to the
acceleration data.
The process flow considered for VWE model is as
shown in Figure 10. Each of the steps are explained
in detail in below sub-section.
Figure 8: Illustration on placement positions of mobile
sensor on vehicle planned for data collection.
Figure 9: Examples of smartphone placements on vehicle.
5.1 Data Collection
The data collection method is carried out based on the
below mentioned conditions and were collected from
Indian roads.
▪ To confer two or more reference vehicles from
target vehicle group with repeated runs (trips).
▪ The reference vehicles will be driven on its
regular routes, with different load condition, thus
An Empirical Study on Low-cost, Portable Vehicle’s Weight Estimation Solution using Smartphone’s Acceleration Data for Developing
Countries
51

study is conducted under dynamic vehicle
environment unlike in a controlled setup.
▪ Details of each vehicle regarding their
manufacture make, age, suspension types,
number of axles, goods being carried, route(s)
considered, running start and end time, and goods
loading factor are gathered in a checklist and
referred as ground truth information per trip.
▪ The actual gross weight (GVW) of vehicle are
also recorded for each vehicle trip as ground truth
to evaluate the model.
Figure 10: Process flow of VWE project.
5.2 Smartphone Orientation
Calculation
Knowledge of smartphone’s placement on vehicle at
three different position is important to assess the
reliability of collected data. On vehicle’s placement-
1 position, a mobile phone is installed on dashboard
secured with double tape. In placement-2 and
placement-3 the smartphones are packed inside an
insulated case and secured at the bottom of the vehicle
chassis at around centre of gravity (CoG) and near
rear axle suspension. The two smartphones are
restricted of free movement inside the box. However,
it is observed, with different vehicle make, the
provision for tying the insulated case with
smartphone would need to be different (as shown in
Figure 11); which in turn results in rotation of sensor
axis with reference to vehicle’s reference frame (x-
axis, y-axis, and z-axis).
Figure 11: Smartphone installation under vehicle chassis
and their different orientations.
In order to acknowledge the relation between
smartphone-to-vehicle orientation as referenced by
(Johan et al., 2019), in their study on “Smartphone
placement within vehicle” and the smartphone’s
placement in the vehicle, we compute a 3-axis Euler
rotation in Equation 5, as a pre-liminary step to
correction.
(5)
where,
refers to counter clockwise rotation
around x-axis;
refers to counter clockwise rotation around y-
axis and
refers to counter clockwise rotation around z-
axis.
5.3 Data Calibration or Conditions
It is observed the model performance alters for
varying input sets such as (i) speed zone (very low,
low, medium, high to very high); and (ii) sample
window size (1 sec to 5 sec of epoch size).
For automating the process of computation, we
consider the following sequence combination of
parameters of input vertical acceleration data i.e.,
sensor location, load condition (vehicle is loaded or
empty), window size and speed zone.
Initially, we considered the model performance
evaluation, with varying non-overlapping sampling
window ranging from 1sec to 5sec, at a sampling rate
of 50 Hz. However, it was observed, as the sampling
window increases the performance of model drops
due to lack of continuous data; hence, for analysis
purpose we resort to minimum 1sec sampling window
with an assumption that each segment holds
continuous datapoints.
Additionally, we consider the average speed of
each segmented dataset as an independent feature to
regression model considered.
5.4 Feature Extraction
To evaluate the model, we make use of all the time
and frequency domain features mentioned in section
3.2.
5.5 Model Evaluation
We confer to two or more reference vehicles
availability for this experiment. From 21 vehicle trips
data available, four of the trip information had to be
discarded due to loss of data. For model evaluation,
from 17 trips, we identify three vehicle class dataset
and their use cases defined are as indicated in Table
5. The results of considered cases 1, 2 & 3 as
mentioned are evaluated considering the statistical
features derived from vertical acceleration data,
including the average of speed considered per
segment. Evaluation is represented in three different
conditions of data sample.
VEHITS 2021 - 7th International Conference on Vehicle Technology and Intelligent Transport Systems
52
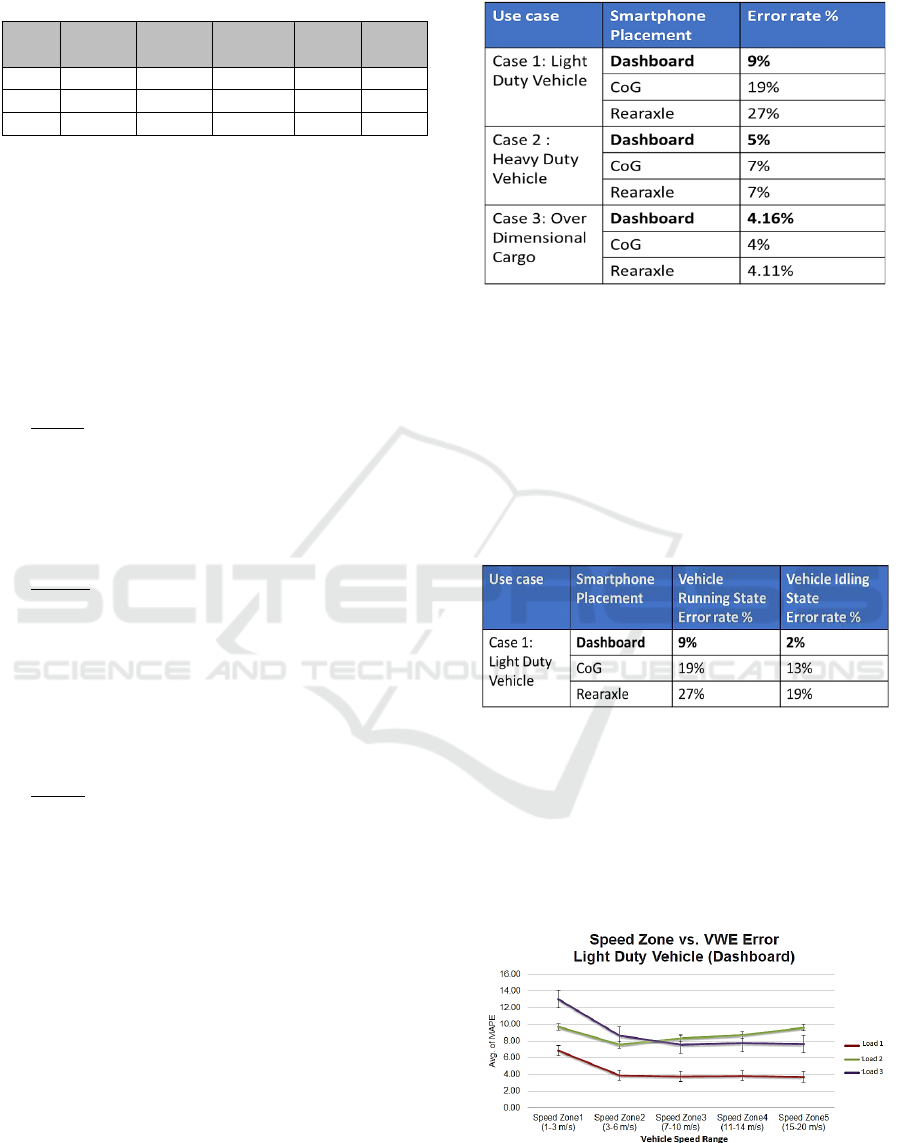
Table 5: Test cases with varying vehicle and load
conditions.
Test
Cases
Vehicle
Criterion
Load
Capacity
Load
Condition
Goods
Route
Case1
Single
Single
Different
Different
Different
Case2
Different
Different
Single
Single
Different
Case3
Different
Single
Single
Single
Different
5.5.1 Vehicle Running State
We fit a multiple linear regression model which
minimize sum of the squared residuals using
accelerometer features. In this section, each of the
smartphone placement results are presented for
running condition of vehicle. We compare estimated
results with actual weight as ground truth to evaluate
the model. For error determination, we consider
MAPE as before. This defines on an average what is
the error of the model trained.
Case 1: Light Duty Vehicle – Evaluation of single
vehicle (12T capacity), with varying load condition
(<50%, 75%, 100%), carrying different goods
material. Consider all four loaded datasets; a k-fold
cross-validation based evaluation method is carried
out as the given number of data sample to split is
limited with varying load condition.
Case 2: Heavy Duty Vehicle – Evaluation of
different vehicles, carrying different goods and load
condition.
For training we consider trips all loaded with same
material, for example, cement on vehicle having
tonnage capacity of 49T, 43T and 35T respectively.
For testing, we consider unseen trips loaded with
capacity of 49T, 31T, 36T and 43T carrying
similar/same material.
Case 3: Over Dimensional Cargo – Evaluation of
Trailer type truck. Dataset comprises of different
vehicle, same manufacture makes, with full load
condition (100%), carrying same goods material, but
comprises of only 3 instances.
Considering the above cases, on an average the
accuracy of different vehicle classes considered are as
listed in Table 6.
5.5.2 Vehicle Idling State
Additionally, we also analyse the data for idling
condition of vehicle. For comparison, we consider the
vehicle running and idling state of Case1: Light Duty
vehicle, since a single vehicle is being used for
multiple trips. The accuracy measure of vehicle in
idling state is as indicated in Table 7; however, the
number of datapoints available are less.
Table 6: Summary of VWE for different use cases.
We then consider evaluating VWE with different
speed condition of vehicle. The speed calculated from
smartphone’s GPS feeds are divided into 5 different
speed zones such as, speed zone1 range 0 to 3 m/s (0
– 10 km/h); speed zone2 range 3 to 6 m/s (10 – 20
km/h); speed zone3 range 7 to 10 m/s (20 – 40 km/h);
speed zone4 range 11 to 14 m/s (40 – 55 km/h); and
speed zone5 range 15 to 20 m/s (55 – 80 km/h).
Table 7: Summary of VWE for Case1 with Vehicle
Running and Idling State.
Since, speed is considered as a feature, and to
assess robustness of model, we further examine if
model’s accuracy is consistent across different
driving speed zones identified. Here, we consider all
loaded data Placement1-Dashboard position of Light
Duty vehicle only, to verify the variability or
relationship of VWE with vehicle speed information
as referenced in Figure 12.
Figure 12: Graph of speed zone vs model error for all loaded
conditions of Light Duty vehicle case.
An Empirical Study on Low-cost, Portable Vehicle’s Weight Estimation Solution using Smartphone’s Acceleration Data for Developing
Countries
53

6 DISCUSSION
VWE technology based on acceleration and GPS data
collected by smartphone in logistics vehicle is
validated using multiple linear regression model. We
identified additional statistical features derived from
vertical acceleration whose response shows
significant importance pertaining to vehicle vibration
information.
• Considering the improvised multiple linear
regression model, we evaluate real data with
different velocity profile. From table 4, it
indicates that (i) ‘Flat response’ shows better
performance i.e., reduced error rate when
compared to (ii) Accelerating response and (iii)
Decelerating response.
• Flat response shows reduced error rate of 6%.
• To test further, we conducted few more trials by
selecting random pairs of flat response segment.
It is observed, vehicle speed responses with flatter
(constant) velocity profile shows reduced error
rate in prediction of VWE, when compared to
trials which shows some amount of variation in
vehicle speed. These variations can be attributed
due to road surface condition and/or traffic
conditions.
• In this experiment, we confirm that in moving
vehicle scenarios the “velocity of vehicle” has
high influence in accurate prediction of vehicle’s
weight.
• Case 1: Light Duty Vehicle placement1-
Dashborad, sensor location shows on an average
accuracy error of 6.87% for vehicle data
comprising of 12T and 10T.
• Since, single vehicle was used for to-and-from
trips, we validate with assumption that vehicle is
being driven by a single driver; hence, assuming
driving pattern influence on vibration data to be
unchanged. Stats from Figure 12, shows
consistent model performance across varying
speed zone, whereas, in (Phong et.al., 2018)
research work it is observed model performs best
under speed zone of 20 – 22 km/h.
• We also validate results with vehicle in idling
state, under the assumption, external factors such
as vehicle dynamics, road condition, and other
environmental parameters will not affect vibration
data captured from sensors. We observe the idling
values of data got from Light Duty vehicle class,
shows improved accuracy by at least 5 % from its
running state, i.e., with overall highest accuracy
of 98% when compared to state of vehicle in
motion as referenced from Table 7.
• Case 2: Heavy Duty Vehicle from Table 6,
considering model accuracy error on an average
across all trips, shows that placement1 –
Dashboard has an MAPE value of 5% lower error
rate when compared to the other two sensor
location.
• When vehicle trip carrying different goods
material was tested against Heavy Duty vehicle
class model, the performance drops. This
indicates the carrying goods material also has an
inference on feature engineering during model
learning process. However, it requires to be
confirmed with exploratory data approach.
• Case 3: Over dimensional cargo the configuration
of vehicle regarding its design, axle distribution,
number of wheels are different and require further
studies.
7 CONCLUSIONS
A machine learning model considering statistical
parameters of vertical acceleration applied for
evaluation of overloaded vehicle using Indian vehicle
dataset is introduced in this paper. The developed
VWE model shows improved and consistent accuracy
considering vehicle engine idle state and flat response
of velocity for both ‘Empty’ and ‘Loaded’ dataset
scenario. It is observed from our studies moving
vehicle’s acceleration response is highly influenced
by velocity measure of vehicle. For validation on
installation location, three sensor placements on the
vehicle are considered to determine the feasible
sensor position for system integration. For which, the
developed model was evaluated considering different
vehicle class type based on their tonnage. It is
observed, on an average, model performance gives
low MAPE error on dashboard, for vehicle carrying
same goods to full capacity. The model accuracy is
observed to be consistent at all speed range of vehicle
motion, which makes our technology reliable for real-
time assessment of vehicle’s weight.
As a continued research we are investigating deep
learning-based regressor model on time series data
considering different rate of load filling on vehicle.
Other candidates for research improvements are:
• To study the impact of different axle
configuration and vehicle’s suspension type
on accelerometer data.
• The impact of road grade condition, driving
behaviour pattern, which in-turn influences
vibration on vehicle.
VEHITS 2021 - 7th International Conference on Vehicle Technology and Intelligent Transport Systems
54

As a system, we propose integration of VWE
technology to on-board unit alike AIS-140 vehicle
system which abides to the law enforcement
regulation mandated by the government.
REFERENCES
NITI Aayog and Rocky Mountain Institute, 2018. Goods on
the Move: Efficiency & Sustainability in Indian
Logistics.
PWC Survey, 2019. Project Esquire- Digital India Market
Study – Final Report, Apr.
LTBP Program's Literature Review on Weigh-In-Motion
Systems, 2016. WIM Systems Overview, Federal
Highway Administration Research and Technology
Coordinating, Developing, and Delivering Highway
Transportation Innovations, Chapter 3, June.
Weigh-in-motion Pocket Guide, Part 1, 2018. WIM
Technology, Data Acquisition and Procurement Guide,
U.S. Department of Transportation, Federal Highway
Administration, Office of Highway Policy Information,
Publication No. FHWA-PL-18-015, June.
APEC Vietnam, 2017. The Economic Costs of Overloading
– Case Studies, Workshop on Regulating High Mass
Heavy Road Vehicles for Safety, Productivity, and
Infrastructure Outcomes.
Phong X. Nguyen, Takayuki Akiyama, Hiroki Ohashi,
Masaaki Yamamoto & Akiko Sato, 2018. Vehicle's
weight estimation using smartphone's acceleration data
to control overloading, International Journal of ITS.
Kadlecek B, Pejsa L., Svitek M., Sep 2005. Experimental
verification of the method used in gauging the weight of
moving vehicles, Proceedings of the 8th International,
IEEE Conf. on Intelligent Transportation Systems.
Jyotishman Ghosh and Stéphane Foulard, March 2017.
Vehicle mass estimation from CAN data and drivetrain
torque observer, SAE Mobilus.
Viengnam Douangphachanh and Hiroyuki Oneyama, 2014.
A model for the estimation of road roughness condition
from sensor data collected by android smartphones, J.
JSCE, Ser. D3 (Infrastructure Planning and Mana-
gement), Vol.70, No.5, Special Issue, I_103-I_111.
Joshua E. Siegel, Rahul Bhattacharyya, Sanjay Sarma, Ajay
Deshpande, 2015. Smartphone based wheel imbalance
detection, American Society of Mechanical Engineers,
Oct. 28.
Johan Wahlstrom, Issac Skog, Peter Handel, Bill Bradley,
Samuel Madden, and Hari Balakrishnan, 2019.
Smartphone Placement Within Vehicles, IEEE
Transactions on Intelligent Transportation Systems.
Yongjie Lu, Shaopu Yang, Shaohua Li, and Liqun Chen,
2010. Numerical and experimental investigation on
stochastic dynamic load of a heavy-duty vehicle,
Applied Mathematical Modelling, Elsevier.
Magdalena Bacharz, Jacek Chmielewski, Sylwia Stawska,
Kamil Bacharz, Andrzej Nowak, July 2020.
Comparative Analysis of Vehicle Weight Measurement
Techniques Evaluation of Siwim System Accuracy,
Auburn University, Department of Civil Engineering.
Nan Lin, Changfu Zong and Shuming Shi, 2019. The
Method of Mass Estimation Considering System Error
in Vehicle Longitudinal Dynamics, Energies.
An Empirical Study on Low-cost, Portable Vehicle’s Weight Estimation Solution using Smartphone’s Acceleration Data for Developing
Countries
55
