
Total Cost of Ownership for Automated and Electric Drive Vehicles
Lambros Mitropoulos
1 a
, Konstantinos Kouretas
1 b
, Konstantinos Kepaptsoglou
1 c
and Eleni Vlahogianni
2 d
1
School of Rural and Surveying Engineering, National Technical University of Athens, Athens, Greece
2
School of Civil Engineering, National Technical University of Athens, Athens, Greece
Keywords: Electric Vehicle, Total Cost of Ownership, Automated Vehicle, Economic Evaluation.
Abstract: Advances in technology and alternative fuels change the on-road vehicle fleet mix, which traditionally
depends on internal combustion vehicles. These changes affect also the total cost of ownership (TCO) per
vehicle technology and their market penetration rates. The goal of this paper is to identify indicators for a
TCO based analysis for three vehicle technologies: A Hybrid Electric Vehicle (HEV), an Electric Vehicle
(EV) and an Automated Electric Vehicle (AEV). The study is conducted by using data for the French market,
for existing vehicle models; thus, the level three or “conditional driving automation” is used for the AEV. The
assessment shows that while the EV is the most economical vehicle when considering the TCO, the HEV is
more economical during the first two years. The high purchase cost of the AEV does not compensate during
the vehicle lifetime compared to the other two technologies, although it profits from lower maintenance and
time costs. The HEV approximates the AEV TCO at the end of its lifetime, however the higher expected
resale value of the HEV make it attractive for consumers that desire lower purchase cost and higher resale
value.
1 INTRODUCTION
The ever-increasing urbanization of cities worldwide
urges authorities into addressing challenges with
respect to the environment and the quality of life of
their inhabitants. The latest EU targets and policy
objectives for the 2020-2030 period include a
reduction of 40% of GHGs relative to 1990 levels and
a share of 35% of zero or low-emission new cars and
vans by 2030 (EC, 2018). The promotion of Electric
Vehicles (EVs) is one of the key policies of the
European Commission towards achieving the GHG
reduction target. This is stressed through EU planning
for a 100% zero-emissions fleet in cities by 2050, and
the goal that several EU countries have set to ban
internal combustion engine vehicles from urban areas
by 2032 (EAFO, 2018). For example, Norway plans
to ban gasoline and diesel engine vehicles from urban
areas by 2025; whereas other countries, including the
Israel, Holland, Iceland, Denmark, Switzerland and
Scotland plan to follow by 2032 (Burch and Gilchrist,
a
https://orcid.org/0000-0002-6185-1904
b
https://orcid.org/0000-0003-0645-9077
c
https://orcid.org/0000-0002-5505-6998
d
https://orcid.org/0000-0002-2423-5475
2018).
Automakers focus on introducing more EV
models, while they advance their technological
aspects and levels of automation. Automated
Vehicles (AV) have recently emerged in the market,
with growing potential. Although full automation is
not yet commercially available, extensive testing is
being carried out by technology and car
manufacturers. The autonomous/driverless vehicle
market was valued at $24.10 billion in 2019, while in
Europe reached $12.9 billion in 2019 (Research and
Markets, 2020a; 2020b). Over 5,800 autonomous
vehicle patents were filed globally between 2010 and
2017, from which Germany accounted for 51% of
them (Research and Markets, 2019).
Based on literature review findings, promotion of
new vehicle technologies depends greatly on
incentives. Incentive policies usually focus on the
vehicle and aim to reduce the direct cost of vehicles
for the user; however, research usually focuses on the
34
Mitropoulos, L., Kouretas, K., Kepaptsoglou, K. and Vlahogianni, E.
Total Cost of Ownership for Automated and Electric Drive Vehicles.
DOI: 10.5220/0010398800340043
In Proceedings of the 7th International Conference on Vehicle Technology and Intelligent Transport Systems (VEHITS 2021), pages 34-43
ISBN: 978-989-758-513-5
Copyright
c
2021 by SCITEPRESS – Science and Technology Publications, Lda. All rights reserved

optimal allocation of charging infrastructure for EVs
(Bhatti et al.,2015; Gnann and Plotz,2015).
There is a limited number of tools used to model
and optimize incentive policies in EU and US; the
components selected in these tools are those, which
can often be influenced by policy makers. The Fleet
Purchase Cost and the Total Cost of Ownership
(TCO) models are useful tools for policy makers to
gain insights into the costs and benefits of the
transition to electric vehicles. The TCO model relies
on two components: the capital costs and operational
costs, as the cost of purchase and annual maintenance
are probably the most profound and understood costs
by customers.
A TCO that integrates costs for vehicle
technologies is developed in this study to compare the
performance of three different vehicle technologies
by providing absolute TCO values. Instead of
considering high level of automation for which no
real-life data exists, this study focuses on existing
vehicle technologies; thus, the level three or
“conditional driving automation” is considered in the
assessment. for the AEV.
On-road vehicle technology options examined in
this study include hybrid electric vehicle, electric
vehicle and automated electric vehicle. The Hybrid
Electric Vehicle (HEV) combines a
conventional internal combustion engine with
an electric propulsion system. The Electric Vehicle
(EV) refers to a vehicle that is powered entirely by
electric energy, stored in a large battery pack which
is charged from an external power source. The
Automated Electric Vehicle (AEV) is an advanced
version of an EV, for which selective driving tasks are
carried out by the vehicle itself rather than the driver.
Different types of sensors collect information on the
environment which lead to decisions by using a
computer, with algorithms, machine learning or/and
Artificial Intelligence (AI) systems.
2 ELECTRIC DRIVE TRENDS
AND SALES
Five years ago, EVs were considered an expensive
mobility solution that targeted only fleet operators or
elite social classes. Although several EU countries
adapted policies to increase the share of EVs in their
fleets, electric passenger vehicles accounted for just
1.2% of new cars sold in 2015, while the total EV
fleet represents only 0.15% of all passenger cars in
Europe (EEA, 2016). Although several policies and
incentives, have been developed and adopted, to
support the promotion of electric drive vehicles, the
adoption rate is still low.
Electric, hybrid plug-in and hybrid vehicle sales
in EU market recorded a high in July 2020, by
accounting for 18% of the total European passenger
vehicles, to reach 230,700 units in one month. The
increased sales are also attributed to the additional
vehicle models and segment options (e.g., city car,
sedan, executive, etc.) being occupied by electric
vehicles, including the Peugeot 209, Mini Electric,
MG ZS, Porsche Taycan and Skoda Citigo, resulting
in July 2020 in 38 different electric vehicle models in
Europe, as compared to 28 in 2019. (Compared to
around 11 BEV models in Australia and 18 total
model variants in US) (Gaton, 2020). Norway is the
segment leader, with a market share in hybrids and
electric vehicles of 18% and 31%, respectively, in
2018 (ICCT, 2019) followed by Finland and Sweden.
By comparison, Germany had one of the lowest
shares out of all European countries recorded.
More than 3 million hybrids vehicles have been
sold in Europe between 2000 and July 2020. The top-
selling hybrid markets in EU in 2015 were France,
followed by the UK, Italy, Germany, Spain,
Netherlands, and Norway (ACEA, 2016). Nearly
60 % of all new vehicles manufactured by Toyota
which are sold in the EU are hybrid electric; other
automakers that follow are Ford, Mercedes-Benz,
Peugeot and Audi (ICCT, 2019). It took Toyota 15
years to reach the milestone of 1 million hybrid sales
(2000-2015) and only five more years to reach 3
million sales in July 2020. Top-selling Toyota
hybrids are the Auris Hybrid, the Yaris Hybrid, the
Prius and the RAV4 Hybrid. The top-selling Lexus
models include the Lexus RX 400h/RX 450h , and
the Lexus CT 200h (Toyota, 2018).
A total of 165,915 hybrid cars have been
registered in France between 2007 and 2014,
(AVERE, 2014) including diesel-powered hybrids.
Among EU Member States, France had the second
largest hybrid market share in 2014, with 2.3% of new
car sales. Although, hybrid vehicle shares of new
vehicles increased in France in 2018 (3.7%), other
countries such as the Spain, the Netherlands and
Denmark surpassed it. Despite private vehicle sales
decreased in France by 31.9% in 2020 compared to
2019, hybrid vehicle sales increased for the same
period by 136.8% (i.e., 38,334 versus 90,785 sales)
(Alvarez, 2021).
3 AUTOMATED VEHICLES
Autonomy is pursued both by car manufacturers and
ride-sharing companies, offering mobility services
(e.g., Uber, Waymo), and, offering advanced versions
Total Cost of Ownership for Automated and Electric Drive Vehicles
35

of already available models (e.g., Tesla, Nissan,
Volkswagen).
From basic driving assistance systems to full
autonomy, there are several steps in-between.
Although several definitions have been proposed, six
levels of autonomy (level 0 – 5) are commonly
accepted today and are being used in industry
standards. A simplified way of describing each Level
is (Wevolver, 2020):
- Level 0 (L0): No automation
- Level 1 (L1): Advanced Driver Assistance
Systems (ADAS) - Adaptive cruise control that
automatically accelerates and decelerates based
on other vehicles on the road.
- Level 2 (L2): Partial driving automation - Both
steering and acceleration are simultaneously
handled by the autonomous system; the driver still
monitors the environment and supervises the
support functions.
- Level 3 (L3): Conditional driving automation -
The system can drive without the need for a
human to monitor and respond; however, the
system might ask a human to intervene.
- Level 4 (L4): High driving automation - These
systems have high automation and can fully drive
themselves under certain conditions.
- Level 5 (L5): Full automation, the vehicle can
drive wherever, whenever.
The most advanced commercially available AVs
are classified between Levels 2 and 3 (Tesla
AutoPilot, Nissan ProPilot, Audi etc.). As of 2020,
there are no commercially available vehicles
classified in Levels 4-5 are (Wevolver, 2020). Freight
transport and ride-sharing companies seem to more
actively pursue full automation for their fleet. For
example, the Waymo company already offers
driverless taxi cars within a specified Operational
Design Domain (ODD) in Phoenix (Waymo One) and
has expanded its services and research in freight
trucks (Waymo Via). Shuttle services are also a
promising field. NAVYA provides autonomous
shuttles for passengers and tow-tractors for logistics,
implemented with promise in private industrial sites
or other specific ODDs.
In spite of their rapid development, the legislative
framework around the world does not fully cover
autonomous vehicles. The Vienna Convention on
Road Traffic since 1968 describes that every driver of
a vehicle shall in all circumstances have his vehicle
under control so as to be able to exercise due and
proper care and to be at all times in a position to
perform all manoeuvres required of him (UNECE,
1968). New Amendments that were put into force
since 2016 allow automated driving technologies to
transfer driving tasks to the vehicle, provided that
these technologies are in conformity with the United
Nations vehicle regulations or can be overridden or
switched off by the driver (UNECE, 2014). Further
regulation amendments are being considered in
countries where AV technology is more advanced and
there is a growing market interest, such as Germany
and the US.
3.1 AV Components and Performance
The specific components that differentiate an AV
from a conventional electric or hybrid vehicle are:
(Wevolver, 2020; Gawron, 2018; Stephens et al.,
2016):
- AI platform/Computer (Sensor processing, AI
computations, path planning, vehicle control).
- Cameras (Detection and classification of static
(signs, lanes, boundaries, etc.) and dynamic
objects (pedestrians, cyclists, collision-free space,
hazards, etc.))
- RADAR (Detection of motion in a wide range of
light and weather conditions)
- SONAR (for close proximity)
- LIDAR (High-precision detection in all light
conditions)
- GNSS/ IMU / INS (Rough positioning and motion
compensation for some sensors)
- DSRC/ C-V2X (Dedicated Short-Range
Communication, Cellular V2X, for
communication between vehicles and other
vehicles or devices directly without network
access through an interface called PC5).
Although these sensors and systems may also
exist in conventional vehicles, the computational
requirements for AVs can be up to 100 times higher
than the most advanced vehicles in production today
(NVIDIA, 2019).
Several approaches have been used to quantify the
effects of AV utilization in travel behaviour, travelled
distance, travel patterns, etc related to conventional
vehicles. It is often suggested that high automation
will enable higher speeds and fuel consumption
(Fleming and Singer, 2019). At the same time,
smoother driving patterns by avoiding unnecessary
braking/ acceleration and optimum trajectories would
have the opposite effect. Stephens et al., (2016)
estimated a 2-8% increase in fuel consumption due to
higher speeds and a 7-16% decrease due to eco-
driving, resulting (combined with other factors) to an
overall 5-22% fuel reduction (average 14%). Another
study (Taiebat et al., 2019) estimated that time cost is
reduced by 38% and fuel economy is reduced by
20%. While combined effects are hard to be
quantified, efforts have been also made to estimate
the overall impact of AVs to the environment. The
energy consumption is found to be reduced by 2-4%
(Wadud et al., 2016).
Kockelman and Lee (2019), estimated that an AV
requires 4-15% more processing power (because of
VEHITS 2021 - 7th International Conference on Vehicle Technology and Intelligent Transport Systems
36

sensors and computers) compared to the equivalent
basic electric vehicle version. Sensors and computers
place a significant burden on AV power consumption.
A medium subsystem for a connected-AV could
demand an additional 240 W of power, place 22.4 kg
of weight and need 1.25 MJ/GB (over a 4G network)
for communications (Gawron, 2018). A larger system
could reach up to 327 W and 55.4 kg of weight.
Powertrain types vary among AVs.
Other effects which are difficult to quantify
include costs incurred by traffic violations (expected
to be lower for AVs), time for parking, changes in
residence location and daily travel behavior.
Additionally, several industries are directly or
indirectly affected, such as land development, digital
media, medical, construction, legal etc. (Clements
and Kockelman, 2017).
4 METHODOLOGY
4.1 Model and Indicators
The Total Cost of Ownership (TCO) model accepts
input by suitable cost indicators and data. The TCO
can be used for cost-benefit analysis and evaluation
of transportation policies, for vehicle taxation
programs, and for evaluating vehicle performance
and trade-offs by developing different scenarios. The
six indicators that compose the TCO in this study, are:
1) vehicle purchase cost including depreciation and
subsidies 2) fuel cost, 3) maintenance and repair cost,
4) vehicle resale value, 5) insurance and taxes, and 6)
time cost. The estimated TCO per vehicle technology
represents costs over the vehicle lifetime. The TCO
per vehicle is estimated for the base year 2019 for
France; and all conversions are based on the country’s
inflation rate. Indirect costs related to emissions,
safety or congestion are not included in this study.
The present worth of costs that occur in future
years is estimated with the Present Value of an
ordinary Annuity (PVA), which is the value of
expected future payments that have been discounted
to a single equivalent value today. The PVA is
calculated by Eq.1.
(1)
R is the amount of recurring cost, n is time expressed
as number of years, i is the real discount rate derived
from Eq.2.
(2)
The nominal interest rate is assumed to be 6.0% and
the inflation rate is assumed to be 1.1%, resulting to a
real discount rate of 4.9%.
4.2 Vehicles and Characteristics
4.2.1 Vehicle Assumptions
This study uses specific vehicle characteristics to
estimate the cost indicators of the three vehicle
technologies. The analysis for costs provides insights
for the total impact in monetary terms of any fleet
scenario containing these three vehicle technologies:
HEV, EV and AEV. The most popular HEV and EV
models are selected (i.e., the vehicle with the highest
annual sales for this technology). The C segment is
selected for all vehicle types (small family).
Identifying specific vehicle models was necessary for
extracting impacts based on specific vehicle
characteristics. The car models used are the Toyota
Corolla 1.8 (HEV) and the Nissan Leaf 40kW (EV).
A lot of debate focuses on the ownership status of
AVs, as these may also be used satisfactory in
Mobility as a Service (MaaS) and on-demand services
(Yap et al., 2016). These transport concepts should be
also supported by full automation (Level 5). For the
AEV there are no commercially available L4, L5
vehicles for private use. Tesla’s AutoPilot and
Nissan’s ProPilot fare at Level 2. Just lately (2020)
Tesla and Nissan claimed to reach Level 3 with their
latest upgrades to Self-Driving Mode (Tesla) and
ProPilot 2.0. In this study the AV is considered to
operate at Level 3 (L3) and as a personally owned
vehicle, so as to be able to utilize existing
information, and assess vehicles in the short-term.
Since L3 could be seen as a more limited version of
L4-L5 capabilities, we select lower bound estimations
for the vehicle’s performance, as these were found in
literature. For contingency reasons, the AEV is built
on the EV model characteristics.
Due to more balanced driving (eco-driving)
automation lowers fuel costs by 10% (Stephens et al.,
2016). However, increased system power demands
are required for internal operations. A conservative
estimation (-5%) is assumed for combined effects of
increased system power demands and reduced
consumption because of eco-driving, based on
common ground in literature (Gawron, 2018; Pierre
Michel, 2016; Stephens et al., 2016; Kockelman, and
Lee, 2019). The vehicle characteristics are shown in
Table 1.
Total Cost of Ownership for Automated and Electric Drive Vehicles
37

Table 1: Characteristics per vehicle technology.
units
HEV
EV
AEV
Weight
kgs
1,348
1,610
1,635
b
Fuel
efficiency
a
l/100km
4.9
270
c
297
c
Battery
energy
kWh
0.75
40
40
Max output
kW
90
110
110
Consumption
Wh/km
-
171
154
a
Based on the WLTP (World harmonized light-duty vehicles
test procedure)
b
Estimated based on additional sensors’ weight for “medium”
size equipment (Gawron, 2018).
c
Electric range in kilometers, achieved using the WLTP test
procedure. Figures obtained after the battery was fully charged.
Due to data availability, in this analysis the TCO
model is applied in France for year 2019. The average
annual distance travelled of 11,900 kilometres is used
for all vehicle models and the average vehicle
ownership period is considered to be 9.0 years (i.e.,
107,100 kilometres over lifetime) (AIC, 2020). We
do not assume any change in total travel for the AV
at L3 automation. All costs are estimated for privately
owned vehicles.
4.2.2 Purchase and Depreciation Cost
For the vehicle purchase cost, the official price
released by the official automaker of each model is
used, including the VAT (value added tax) of 20% in
France.
The addition of semi-autonomy options on
existing vehicle models varies and may increase the
original vehicle purchase price between €1,000
(Nissan ProPilot) and €7,500 (Tesla). Both systems
rank at L2 autonomy, with Tesla recently claiming to
be closer to L3. (Nissan, 2020; Tesla 2020).
Automakers follow different pricing policies
regarding AV technologies. For example, Tesla
vehicles are equipped with the necessary hardware for
self-driving and autonomous drive; thus, unlocking
semi-autonomy options is a matter of a software
upgrade. The AV’s purchase price is increased by
€5,000 in comparison to the EV (the most economical
version of Nissan Leaf version at L2 ProPilot is priced
at € 38,400, and Tesla’s L3 self-driving option
requires an additional € 7,500).
A subsidy of $7,000 is applied to the EV and AV,
whereas the HEV is not subjected to any type of
subsidy.
Vehicles are undervalued over time, and there is a
greater loss of their value during the first years of their
life time. The depreciation or resale value is
considered at the end of the ownership period (9
years). The HEV and the EV retain approximately
20% and 5%, respectively, of their initial value after
9 years (Lebeau et al., 2013). Depreciation for the
AVE is assumed to follow the EV pattern, applied
over its purchase price.
4.2.3 Operation Cost
The frequency of fuelling/charging per vehicle over
their lifetime is estimated by dividing the lifetime
kilometres travelled by the vehicle efficiency. The
new released WLTP 2019 (World harmonized Light-
duty vehicles Test Procedure) measurements per
vehicle are considered in this study. The fuel cost is
estimated by considering gasoline and electricity
prices for France in year 2019 (EC, 2020). The
average gasoline price is 1.50 €/litre and the
electricity price is 0.190 €/kWh.
The annual insurance cost is estimated for a 30-
year-old driver who has a driving license for 12 years
and lives in the region of Paris (Danielis et al. 2018;
Hagman et al. 2016). The HEV annual insurance is
€643. The average difference was 14% higher for EV
(with a high of 37%) compared to petrol and diesel
vehicles due to costs to repair or replace specific
vehicle parts (Fleet Europe, 2019). As the number of
EVs increases in Europe, their insurance cost
approximates conventional vehicles’ insurance cost.
The annual insurance cost for the EV in France is
estimated to be €730.
Autonomy features are considered by insurance
companies as a positive addition because many car
crashes are attributed to human errors. The large-
scale presence of Advanced Driver Assistance
Systems (ADAS), (which do not constitute full
automation), such as forward collision warning
(FCW), automatic emergency braking (AEB), lane
departure warning (LDW) and lane keeping
assistance (LKA), could prevent about 40% of all
passenger-vehicle crashes, 37% of injuries and 29%
of deaths (Benson et al., 2018). Previous studies
assumed that safer driving would lower insurance
rates by 50%. This is regarded as conservative, as
today's Tesla Autopilot is reported to have already
decreased accident rates by 40% (NHTSA, 2017).
The authors acknowledge, how-ever, that this
estimate is highly uncertain, given the profound
changes ahead for the insurance industry, which are
beyond the scope of this research.
In the last quarter of 2019 (pre-COVID19 era)
Tesla claimed 1 accident per 3.1 million miles driven
with autopilot (Level 2). When all systems were
disengaged, 1 accident per 1.6 million miles ocured.
This is significantly better than NHTSA’s equivalent
data showing 1 accident per 479k miles (Tesla, 2020).
Βased on accident rates, Stephens et al., (2016)
VEHITS 2021 - 7th International Conference on Vehicle Technology and Intelligent Transport Systems
38

assumed a 10%-40% reduction in insurance
premiums for partial automation and 40-80% for full
automation. However, when road crashes occur, the
cost of repair may be significantly higher. For
example, a typical windshield in US may cost $250-
$400 (Nissan Rogue, 2018), while for an ADAS
equipped vehicle may reach up to $1,200-$1,650
(Benson et al., 2018).
For the AEV, a conservative lower-bound
reduction of 10% is assumed (Stephens et al., 2016)
over the estimated EV insurance cost. Incurring costs
due to accidents are not considered.
Registration and tax costs include all
governmental taxes and fees payable at time of
purchase, as well as annual fees to keep the vehicle
licensed and registered. The annual vehicle taxes in
France depend on the taxable horsepower and CO
2
emissions of each vehicle and on the geographical
area. All vehicle drivers are exempt from regional
taxes so the cost of registration will be significantly
lower. The final annual estimated amount is €187.
4.2.4 Maintenance Cost
The EV’s maintenance requirements are lower
compared to the HEV. Based on the mechanical
components of vehicles it is assumed that the
maintenance cost for an EV is 30% less than the costs
for an Internal Combustion Engine Vehicle (ICEV)
(Prevedouros and Mitropoulos, 2018; DeLuchi and
Lipman, 2001; Bakker, 2010). Two studies in the US
(Duvall, 2002) and the EU (Propfe et al., 2013),
concluded that maintenance costs for EVs (excluding
the battery replacement cost) would be 30% and 50%,
respectively, lower compared to an ICEV. This study,
uses the results from these two studies and isolates the
battery replacement cost from maintenance. Thus, the
EV maintenance cost is estimated to be €0.033 per
kilometre. The HEV embraces all the components of
an ICEV but due to its regenerative braking there is
less brake wear. It is estimated that its maintenance
cost is €0.053 per kilometre (Duvall, 2002).
For AVs it is expected that during their early
introduction period the maintenance cost will be
higher compared to internal combustion vehicles, due
to new skills and expertise that will be required
(similarly to EVs). In addition, to mainstream vehicle
components, the vehicle sensors require monitoring
and calibration. Sensor calibration will likely be
required during a routine inspection, or/and when
sensors are damaged in the event of an accident or
during uncommon weather phenomena. Maintenance
of AI and advanced IoT sensors and technologies
such as computer vision, and machine learning, will
be dictated by experts in these fields, rather than
mechanic repair shops; a change that will likely
increase their overall maintenance cost.
On contrary, lower acceleration and deceleration
for AVs will likely reduce wear and tear, and reduce
maintenance costs (Bosch et al., 2018; Wadud, 2017).
The predictive maintenance techniques that will be
used in AVs will inform users in advance, which will
minimize regular vehicle checks, and likely reduce
the impact of a total damaged vehicle component that
leads to higher cost replacement.
Opposed to Wadud (2017), it is believed that
maintenance cost will play a significant role to the
TCO of AVs, and policy of each company to tackle
these costs will contribute towards increasing their
market share (e.g., similar to battery replacement
cost).
For the AEV in this study, it is expected that the
built-in sensors need periodic maintenance, hence the
maintenance cost of EV is adjusted to exclude labour
costs for a car mechanic and include labour costs for
an electrical engineer. This adjustment results to an
overall increase of 21% or €0.0398 per kilometre
(based on hourly wages in France) (Salary explorer,
2020).
Nissan guarantees the Leaf’s battery for a total
period of 8 years or 160,000 kms. Lexus is the first
company to feature a 10 year or 624,371 miles
(1,000,000 kms) battery pack warranty for the model
UX300e (InsideEvs, 2020). Accordingly, no battery
replacement is considered for the 9 years of
ownership.
The cost of tires is the same for all three vehicles
as their tire type would be similar. Tires are expected
to be changed every 40,000 kms and an additional
15% of tires’ cost is added for replacing the tires at
the car dealership. Tire type (205/55 R16) and prices
per vehicle were found online (Norauto, 2020).
4.2.5 Time Cost
Studies on automated impacts studies integrate into
their assessment the travel time savings, as waste of
time is considered as a driving cost (Wadud, 2017).
Level 3 autonomy does not provide any time saving
as drivers can safely turn their attention away from
the driving tasks but they must still be prepared to
intervene within a limited time. However, this study
integrates the time a driver wastes to fuel/charge a
vehicle during its lifetime (Mitropoulos and
Prevedouros 2015). Time loss reflects the loss of
productivity and it is estimated for all vehicle
technologies. The number of stops for
fuelling/charging is calculated by considering the
lifetime distance travelled, the vehicle fuel efficiency,
Total Cost of Ownership for Automated and Electric Drive Vehicles
39

the fuel tank capacity (HEV) and the battery pack size
(EV and AEV).
For the HEV it is assumed that each driver
requires on average six minutes to complete the
fuelling procedure (i.e., to enter the fuel station, wait,
fuel, pay and leave the fuel station) (Mitropoulos and
Prevedouros 2015). In the EV/AEV case, the fuel
tank is replaced by the battery pack; thus for an EV
user it is assumed that 40 minutes charging are
required by using a 50 kWh DC quick charger at
home or work (Nissan, 2020) to charge a depleted
battery in order to complete a trip, and this event will
occur for 2% of the annual total charging cycles
(Mitropoulos and Prevedouros 2015). For the rest of
the charging cycles, it is assumed that no time is
wasted by users for charging batteries (i.e., charging
occurs overnight or at stops/destinations with
charging stations).
5 RESULTS AND DISCUSSION
The TCO for the three vehicle technologies are
presented in Table 2 and show which vehicle is more
attractive for consumers. The most attractive vehicle
for a lifetime of nine years is found to be the EV,
while the HEV ranks second among the three vehicle
technologies. Similarly, when accounting only for the
purchase and fuel costs, the EV cost is 10% and 15%
lower compared to the HEV and the AEV,
respectively. However, when considering only the
purchase cost, the EV cost is 5% higher compared to
the HEV and 16% lower compared to the AEV.
Table 2: Total cost of ownership per technology.
HEV
EV
AEV
Purchase
25,550
33,900
38,900
Subsidy
-
-7,000
-7,000
Depreciation
-4,988
-1,763
-2,023
Fuel
7,600
2,910
2,512
Insurance
5,587
6,343
5,708
Registration
1,625
1,625
1,625
Maintenance
& tires
6,210
4,192
4,848
Time
293
127
116
Total
41,877
40,335
44,867
Cost (€)/km
0.391
0.337
0.419
Research findings, state that obstacles to the
adoption of plug-in vehicles among other factors is
the higher purchase price compared to similar
conventional gasoline vehicles (Carley et al., 2013).
Therefore, the main goal of policy makers should be
to decrease the purchase cost for vehicles that plug-in
or use automated systems. Time cost composes a
small share of the TCO, and its lowest value (€116) is
attributed to the AEV. The EV/AEV are assumed to
stop for charging in 2% of their total charging cycles.
If EV/AEVs are used exclusively for short trips, and
as their battery efficiency is enhanced, then time cost
for charging EVs and AEVs will be minimal.
Figures 1 shows the TCO per mile per vehicle
technology as it accumulated per distance travelled
over their life cycle. The EV may be adopted as the
most economical vehicle bases on the overall TCO,
however, the HEV is the most economical vehicle for
the first 20,000 kilometres. It is important to note that
the HEV starts with an initial low purchase cost and
becomes competitive to the AEV, after 100,000
kilometres, while the EV maintains the first place to
the end of their lifetime.
The final vehicle ranking appears to be affected
by the depreciation cost (Figure 1) as it assumed that
the vehicle is sold at 107,100 kms. In this case the
HEV has higher salvage value because of less
technological advances on the vehicle that pose a high
uncertainty to it, including the battery pack and built-
in sensors. Although, depreciation cost for hybrid
vehicles can be estimated based on experience, for
EV and AEV is highly uncertain, as there is no
available data for the latter one. Therefore, HEVs
become more attractive for consumers that value
significantly the purchase cost, desire higher salvage
value, drive longer distances and may feel anxious
about electricity infrastructure aspects.
The nine years of ownership appear to be an
adequate period of time for vehicle costs to spread
over their lifespan and present cost changes. The high
initial purchase cost for the AEV is compensated after
roughly 8 years of ownership when considering the
HEV TCO, which might be a long period of time for
a significant share of consumers when purchasing a
new vehicle (the average of passenger cars in EU is
10.7 years). Therefore, to maintain electric vehicle
competitive, the automobile manufacturers must
provide battery warranty for the vehicle lifetime (i.e.,
nine years in this case). In the case that battery
replacement cost is included, the TCO of the EV and
the AEV increases significantly (i.e., roughly
€6,200), and the HEV is ranked clearly as the best
vehicle in terms of TCO. To compensate for this
additional battery cost, the ownership of the vehicle
should be increased to 130,000 kilometres or 11 years
and assume that by that time all vehicles have lost
completely their original worth.
Wadud, (2017) estimated costs for fully
automated vehicles and various vehicle sectors,
income groups and user types. He concluded that
VEHITS 2021 - 7th International Conference on Vehicle Technology and Intelligent Transport Systems
40
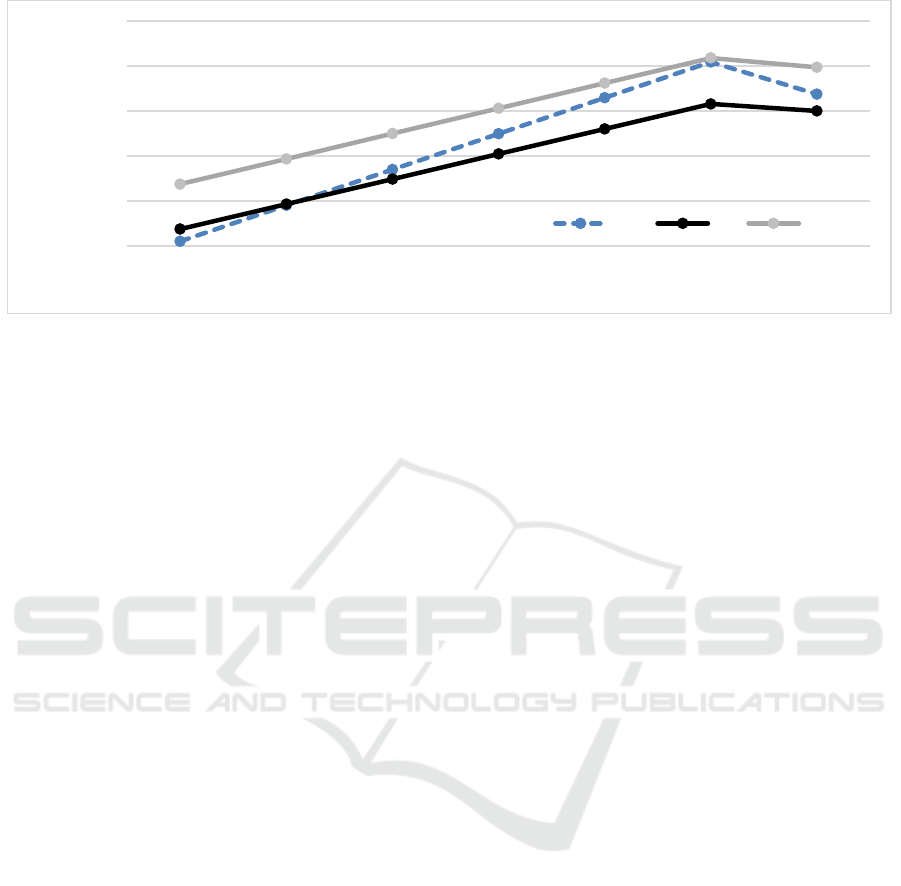
Figure 1: Vehicle travelled distance and total cost of ownership.
high-income households would benefit more by AVs.
Also, more benefits are expected for specific
transport uses, such as for taxis. This study shows that
for lower levels of automation there is a necessity to
form additional policies to support their adaption
when purchasing the vehicle, otherwise this vehicle
technology will fail to increase its market share.
Automation’s positive impacts include safety and
time, and since level three automation does not
provide considerable time savings to drivers, the
safety impacts need to be quantified and integrated
into the purchase cost or/and insurance costs.
Otherwise, they risk to have minimum penetration
into the automobile market.
If these aspects will not be considered, then Level
3 automation will likely serve as a transition
technology between electric and fully automated
(Level 4 and 5) vehicles. However, in this case the
interested consumers will belong to higher income
levels or will be technology geeks with great
willingness to overpay additional vehicle features.
However, in the presence of well-studied impacts per
level of automation and integration into the purchase
cost (or as a form of subsidy), the AEV has the
potential to compete other vehicle technologies in the
short term and achieve a significant market
penetration.
6 CONCLUSIONS
This study estimates, in absolute values, the total cost
of ownership for private small family HEV, EV and
AEV in France. Six indicators were used to build the
TCO and provide insights about vehicles’
performance in economic terms over a lifetime of
nine years. The results showed that HEV and EV,
which are available in market for 20 and 10 years,
respectively, have lower purchase cost compared to
the AEV. The HEV is the most economical vehicle
for the first two years/20,000km, whereas, the EV
becomes more economical after the second year and
until the end of its lifetime. Thereafter, the EV
increases its lead and in year 8/100,000km achieves
its highest difference between the HEV and the AEV.
The rapidly changing field of AV technologies
and their uncertainties (e.g. insurance, maintenance,
depreciation) may lead to a range of cost estimates.
Level 3 AEV are more energy efficient (because of
smoother driving, offsetting the increased power
needs for the sensors and computers) and will likely
reduce road crashes. Still, AEV initial higher
purchase cost is making them less attractive to
consumers compared to the EV and HEV. The AEV
is found to have a higher TCO value than the EV
throughout its lifetime and approximates the HEV’
cost after 100,000 kms. It has to be noted, that this
estimate does not include incidental costs such as
crashes, which are expected to be significantly less
for AEV.
In the short-term, the HEV is an option for
consumers that value significantly the purchase cost,
desire higher salvage value and drive longer
distances. The EV is a better option for users that are
willing to pay an additional amount to purchase a
vehicle, desire more fuel-efficient vehicles, are not
interested to resale their vehicle, and commute shorter
distances. Level-3 AEV would attract high-income
users that are mainly interested in improved safety
features. Subsidies bridge the price gap between
vehicle technologies; however, impacts have to be
well-studied, quantified and integrated within the
lifetime of each vehicle to represent cost differences
to users with diverse travel behaviour.
25 000
30 000
35 000
40 000
45 000
50 000
0 20 000 40 000 60 000 80 000 100 000 107 100
Total Cost of Ownership (€)
Cumulative traveled distance (kms)
HEV EV AEV
Total Cost of Ownership for Automated and Electric Drive Vehicles
41

ACKNOWLEDGEMENTS
“This research is co-financed by Greece and the
European Union (European Social Fund- ESF)
through the Operational Programme «Human
Resources Development, Education and Lifelong
Learning 2014-2020» in the context of the project “A
Total Cost of Ownership Model for Automated and
Electric Vehicles (TCO4AEV)” (MIS 5049185).”
REFERENCES
ACEA, 2016. New passenger car registrations by
alternative fuel type in the European Union – Quarter
4 2015, European Automobile Manufacturers
Association. Retrieved from https://www.acea.be/
AIC, 2020. Average age of passenger cars in some
European countries, Automotive Information Centre.
Retrieved from https://www.aut.fi/
Alvarez, 2021. The best-sellinghynrid cars in France
(2020). L’auto journal. Retrieved from https://www.
autojournal.fr/economie/voitureshybrides-plus-vendue
s-france-2020-260958.html#item=1.
AVERE, 2014. Hybride: un marché en recul en 2014,
l'hybride essence tient le coup" (in French). France
Mobilité Électrique.
Bakker, D. 2010. Battery electric vehicles performance,
CO
2
emissions, lifecycle costs and advanced battery
technology development, Master thesis, Sustainable
Development, Energy and Resources Copernicus
Institute, University of Utrecht, Holland.
Benson, A. J., Tefft, B. C., Svancara, A. M., & Horrey, W.
J., 2018. Potential reductions in crashes, injuries, and
deaths from large-scale deployment of advanced driver
assistance systems. AAA Foundation for Traffic Safety.
Bhatti, S.F., M.K., Lim, H.Y. Mak, 2015. Alternative fuel
station location model with demand learning, Annals of
Operations Research, 230, 1, 105–127.
Bösch P.M, Becker, F., Beckerm H., Axhausen, K.W.,
(2018).Cost-based analysis of autonomous mobility
services, Transport Policy, 64, 76-91.
Burch, I., Gilchrist, J., 2018. Survey of global activity to
phase out internal combustion engine vehicles, Center
for Climate Protection.
Carley, S., Krause, R.M., Lane, B.W., Graham, J.D., 2013.
Intent to purchase a plug-in electric vehicle: a survey of
early impressions in large US cities, Transportation
Research Part D: Transport and Environment, 18, 39-45.
Clements, L., Kockelman, K., 2017. Economic effects of
automated vehicles, Transportation Research Record:
Journal of the Transportation Research Board, 2606
(1), 106-114.
Danielis R, Giansoldati M, Rotaris L., 2018. A probabilistic
total cost of ownership model to evaluate the current
and future prospects of electric cars uptake in Italy,
Energy Policy, 119, 268-281.
DeLuchi, M. A., Lipman, T. E., 2001. An analysis of the
retail and life cycle cost of battery-powered electric
vehicles, eScholarship University of California, Davis.
Retrieved from http://escholarship.org/
uc/item/50q9060k.
Duvall, M, 2002. Comparing the benefits and impacts of
hybrid vehicle options for compact sedan and sport
utility vehicles, EPRI.
EAFO project, 2018. The transition to a zero emission
vehicles fleet for cars in the EU by 2050.
EC, 2020. Emergy, Weekly oil bulletin. European
Commission Energy. Retrieved from https://ec.europa.
eu/energy/data-analysis/weekly-oil-bulletin_en?redir=1.
EC, 2018. Emission performance standards for new
passenger cars and for new light commercial vehicles.
European Commission. Retrieved from https://oeil.
secure.europarl.europa.eu/oeil/popups/ficheprocedure.
do?reference=2017/0293(COD)&l=en.
EEA, 2016. Fuel efficiency improvements of new cars in
Europe slowed in 2016, European Environmental
Agency.
Fleet Europe, 2019. New insurance policy launched for
EVs. Retrieved from https://www.fleeteurope.com.
Fleming, K., and Singer, M., 2019. Energy implications of
current travel and the adoption of automated vehicles,
National Renewable Energy Laboratory.
Gaton, 2020. Electric vehicle and hybrid sales hit record
share of 18 per cent in Europe, The Driven. Retrieved
from https://thedriven.io.
Gawron, J. H., Keoleian, G.A., De Kleine, R.D.,
Wallington, T. J., Kim, H.C., 2018. Life cycle
assessment of connected and automated vehicles:
Sensing and computing subsystem and vehicle level
effects, Environmental Science Technology, 52, 5,
3249–3256.
Gnann,T., Plotz,P., 2015. A review of combined models for
market diffusion of alternative fuel vehicles and their
refueling infrastructure, Renewable and Sustainable
Energy Reviews 47, 783–793.
Hagman J, Ritzén S, Stier J, Susilo Y., 2016. Total cost of
ownership and its potential implications for battery
electric vehicle diffusion, Research in Transportation
Business & Management, 18, 11-17.
ICCT, 2016.European vehicle market statistics-Pocketbook
2015/16, International Council on Clean
Transportation. Retrieved from https://theicct.org/
InsideEvs, 2020. How long do electric car batteries last.
Retrieved from https://insideevs.com/features/ 434296/
video-how-long-batteries-last/.
Kockelman, K.M., Lee, J., 2019. Energy implications of
self-driving vehicles, 98th Annual Meeting of the
Transportation Research Board. Transportation
Research Board, Washington D.C.
Lebeau, K., Lebeau, P., Macharis, C., van Mierlo, J., 2013.
How expensive are electric vehicles? A total cost of
ownership analysis, World Electric Vehicle Journal, 6,
996–1007.
Mitropoulos, L.K., Prevedouros, P.D., 2015 Life cycle
emissions and cost model for urban light duty vehicles,
VEHITS 2021 - 7th International Conference on Vehicle Technology and Intelligent Transport Systems
42

Transportation Research Part D: Transport and
Environment 41, 147–159.
NHTSA, 2017. Automatic vehicle control systems – Tesla
motors system. Investigation: PE 16-007. Office of
defects investigation. National Highway Traffic Safety
Administration.
Nissan, 2020. Official website. Retrieved from https://
www.nissanusa.com.
NVIDIA. 2019. Self-driving safety report. Retrieved from
https://www.nvidia.com/en-us/self-driving-cars/safety-
report/
Norauto, 2020. Retrieved from https://www.norauto.fr.
Pierre, M., Karbowski, D., Rousseau, A., 2016. Impact of
connectivity and automation on vehicle energy use,
SAE International.
Prevedouros, P., Mitropoulos, L., 2018. Impact of battery
performance on total cost of ownership for electric
drive vehicle. Proceedings of the 21st IEEE
International Conference on intelligent Transportation
Systems. November 4-7, 2018, Maui, Hawaii.
Propfe, B., Redelbach, M., Santini, D.J., Friedrich, H.,
2012. Cost analysis of plug-in hybrid Electric Vehicles
including maintenance & repair costs and resale values,
Proceedings of the EVS26 International Battery,
Hybrid and Fuel Cell Electric Vehicle Symposium, Los
Angeles, California, May 6-9, 2012.
Research and Markets. 2020a. Autonomous/driverless car
market - Growth, trends, and forecast (2020 - 2025).
Research and Markets, 2020b. Europe autonomous vehicle
(AV) market 2020-2030 by offering, automation level
(Level 1 - Level 5), vehicle type, power, ADAS feature,
ownership, and country: Trend outlook and growth
opportunity.
Research and Markets, 2019. Europe autonomous car
market research report: by vehicle autonomy, vehicle
type, application, regional insight - Industry trend,
competition analysis and forecast to 2030.
Salary Explorer, 2020. Average salaries in France 2020.
Retrieved from: http://www.salaryexplorer.com.
Stephens, T. S., Gonder, J., Chen, Y., Lin, Z., Liu, C.,
Gohlke, D., 2016. Estimated bounds and important
factors for fuel use and consumer costs of connected
and automated vehicles. NREL. National Renewable
Energy Laboratory.
Toyota, 2018. Toyota sells 1.52 million electrified vehicles
in 2017, three years ahead of 2020 target. Retrieved
from https://global.toyota/en/newsroom.
Taiebat, M., Stolper, S., Xu, M., 2019. Forecasting the
impact of connected and automated vehicles on Energy
use: A microeconomic study of induced travel and
energy rebound, Applied Energy Journal, 247, 297-308.
Tesla, 2020. Official website. Retrieved from https://
www.tesla.com/en_eu.
UNECE, 1968. Convention on road traffic, UNECE.
UNECE, 2014. Report of the sixty-eighth session of the
working party on road traffic safety, United Nations
Commission for Europe.
Wadud, 2017. Fully automated vehicles: A cost of
ownership analysis to inform early adoption.
Transportation Research Part A: Policy and Practice,
101, 163-176.
Wadud, Z., MacKenzie, D., Leiby, P., 2016. Help or
hindrance? The travel, energy and carbon impacts of
highly automated vehicles, Transportation Research
Part A Policy and Practice, 86, 1-18.
Wevolver, 2020. Autonomous vehicle technology report,
Wevolver.
Yap, M. D., Correia, G., van Arem, B., 2016. Preferences
for travellers for using automated vehicles as last mile
public transit of multimodal train trips, Transportation
Research Part A: Policy and Practice, 94, 1–16.
Total Cost of Ownership for Automated and Electric Drive Vehicles
43
