
Kubernetes Autoscaling: YoYo Attack Vulnerability and Mitigation
Ronen Ben David
a
and Anat Bremler-Barr
b
Interdisciplinary Center, Herzliya, Israel
Keywords:
Distributed Denial of Service (DDoS), Economic Denial of Sustainability (EDoS), Kubernetes, Containers.
Abstract:
In recent years, we have witnessed a new kind of DDoS attack, the burst attack(Chai, 2013; Dahan, 2018),
where the attacker launches periodic bursts of traffic overload on online targets. Recent work presents a new
kind of Burst attack, the YoYo attack (Bremler-Barr et al., 2017) that operates against the auto-scaling mech-
anism of VMs in the cloud. The periodic bursts of traffic loads cause the auto-scaling mechanism to oscillate
between scale-up and scale-down phases. The auto-scaling mechanism translates the flat DDoS attacks into
Economic Denial of Sustainability attacks (EDoS), where the victim suffers from economic damage accrued
by paying for extra resources required to process the traffic generated by the attacker. However, it was shown
that YoYo attack also causes significant performance degradation since it takes time to scale-up VMs.
In this research, we analyze the resilience of Kubernetes auto-scaling against YoYo attacks. As containerized
cloud applications using Kubernetes gain popularity and replace VM-based architecture in recent years. We
present experimental results on Google Cloud Platform, showing that even though the scale-up time of con-
tainers is much lower than VM, Kubernetes is still vulnerable to the YoYo attack since VMs are still involved.
Finally, we evaluate ML models that can accurately detect YoYo attack on a Kubernetes cluster.
1 INTRODUCTION
The burst attack is a new trend in DDoS attacks. In
a burst attack, the victim is attacked with recurring
high-volume traffic bursts, lasting from a few seconds
up to several minutes, while the total duration of the
attack can span hours and even days (Dahan, 2018;
Zeifman, 2019). In 2017, it was reported that 42%
of organizations experienced such attacks (Cimpanu,
2017). Burst attacks have become feasible due to re-
cent improvements in botnet technologies that allow
them to be perpetrated in a scheduled and synchro-
nized manner. A burst attack, when carried out cor-
rectly, is cost effective to the attacker, who can divert
the attack traffic between multiple end-point targets,
leveraging a high degree of resource control. More-
over, it confused conventional DDoS mitigation and
detection solution (Chai, 2013).
Recent work presents a new kind of Burst attack
(Bremler-Barr et al., 2017), the YoYo attack, that op-
erates against web services implemented as native
cloud applications using VMs. We note that cloud
applications are resilient to many of the classic DDoS
(i.e.,attackers operate a flat vector attacks) due to their
a
https://orcid.org/0000-0002-2577-1333
b
https://orcid.org/0000-0002-8165-2558
high bandwidth pipe, built-in anti-spoofing mitiga-
tion in the load-balancers, and the common use of
a content distribution network (CDN). Amazon lists
the auto-scaling mechanism such as using AWS layer
DDoS mitigation as one of the best practices for deal-
ing with Distributed Denial of Service (DDoS) (AWS
Best Practices, 2019) attacks that target web applica-
tions. In flat DDoS attack the auto-scaling mechanism
translates a DDoS attack into an Economic Denial of
Sustainability attack (EDoS), incurred by paying the
extra resources required to process the bogus traffic of
the attack. However, there is no performance damage,
since the extra machines handle the extra traffic.
The YoYo attack (Bremler-Barr et al., 2017) op-
erates against the auto-scaling mechanism of VMs
in the cloud. The periodic bursts of traffic loads
cause the auto-scaling mechanism to oscillate be-
tween scale-up and scale-down phases. The YoYo
attack causes significant performance degradation in
addition to economic damage. During the repetitive
scale-up process, which usually takes up to a few
minutes, the cloud service suffers from a substantial
performance penalty. When the scale-up process fin-
ishes, the attacker stops sending traffic and waits for
the scale-down process to start. When the scale-down
process ends, the attacker begins the attack again, and
34
Ben David, R. and Bremler-Barr, A.
Kubernetes Autoscaling: YoYo Attack Vulnerability and Mitigation.
DOI: 10.5220/0010397900340044
In Proceedings of the 11th International Conference on Cloud Computing and Services Science (CLOSER 2021), pages 34-44
ISBN: 978-989-758-510-4
Copyright
c
2021 by SCITEPRESS – Science and Technology Publications, Lda. All rights reserved

so on. Moreover, when the scale-up process ends,
there are extra machines, but no extra traffic. Thus,
the victim pays unwittingly for extra machines that
are not utilized.
A recent trend in cloud applications is to use con-
tainers, adding an additional virtualization layer by
loading multiple containers on a single VM. Contain-
ers are light-weight with lower space and time over-
head than VMs. Thus, the question arises whether
containerized applications are less vulnerable to the
YoYo attack. One might speculate that this is the case
due to their short scale-up and scale-down times while
the performance penalty is proportional to scale-up
time, and the economic penalty is proportional to
scale-down time.
In this paper, we analyze Kubernetes, the most com-
mon container orchestration engine for containerized
applications. We show that the YoYo attack can still
have a huge impact. This is due to the Kubernetes
cluster architecture, which combines two levels of vir-
tualization, Pods (container level) and Nodes (VM
level), and uses a two-stage auto-scaling mechanism:
Pods are scaled first until they fill allocated nodes and
trigger new node allocations. The root observation is
that the increase in the number of nodes increases the
economic damage of the attack but also the perfor-
mance damage, since it takes time to scale up Node.
In Section 2 we present a model of Kubernetes auto-
scaling mechanism. We then present a formal model
of YoYo attack on Kubernetes in Section 3. In Sec-
tion 4 we evaluate YoYo attack on Google Cloud in-
frastructure. We compared the damage caused by the
attack, economic and performance wise, while con-
ducting YoYo attack on Google Cloud Engine (GCE)
that is VMs based, and YoYo attack on Google Ku-
bernetes Engine (GKE) that is containers based. We
show, that Kubernetes, with the fast Pod scale-up re-
duces the performance damage, but does not elimi-
nate it. We also evaluate the classic DDoS attack on
Kubernetes and show that the YoYo attack is more
cost effective to the attacker than a flat DDoS attack.
In Section 5, we propose a detection mechanism
of YoYo attack on Kubernetes, based on machine-
learning technique. Previous machine learning based
techniques in the literature (Deepa et al., 2018;
Ravichandiran et al., 2018) are not applicable to YoYo
attack, since they rely mainly on traffic bandwidth and
attempt to assign a score that reflects the severity of
the attack. Our solution suggests the XGBoost clas-
sifier to detect a YoYo attack on a Kubernetes cluster.
We show high accuracy results based on a compre-
hensive analysis using that model, exploiting unique
data (i.e., response time, Pod count, Node count and
CPU load) acquired from the Kubernetes cluster.
2 KUBERNETES
2.1 Kubernetes Background
Kubernetes is an open-source container orchestration
engine for automating the management and deploy-
ment of containerized applications. In this paper,
we focus on Google Kubernetes Engine (GKE), but
note that other implementations of Kubernetes in the
cloud, such as AKS(Azure) and EKS(AWS), share
the same behavior. We describe the Kubernetes basic
mechanism, focusing on the aspects relevant to auto-
scaling. Kubernetes is a cluster of machines, called
Nodes, that are used to run user workloads called
Pods. A Pod is the basic compute unit. It has one or
more containers running together, according to spe-
cific configuration parameters such as network uti-
lization, storage, CPU utilization, memory and con-
tainer image name. Nodes are virtual machines in the
cloud environment, and usually several Pods run on
the same Node.
Applications use a simple Kubernetes Controller
called Deployment, which provides declarative up-
dates for Pods. Each Pod gets its own IP address. In
a Deployment where Pods are created and destroyed
dynamically, the set of Pods running at one moment
might differ from the set of Pods running that appli-
cation a moment later. However, when there is a re-
quirement to track Pods and their IP address, Kuber-
netes defines a Service, which is a logical set of Pods
and a policy (aka microservice). The set of Pods tar-
geted by a Service is determined by a selector. When
a Node is closed, all the Pods that run in the context on
the Nodes are also closed. Pods can run in standalone
configuration but are usually grouped by Controllers.
The Controller is responsible for maintaining the cor-
rect number of Pods for every replication. For sim-
plicity, we demonstrate the impact of the YoYo attack
on a deployment object and a deployment controller.
Deployment objects represent a set of multiple, iden-
tical Pods (that can be parts of multiple Nodes). De-
ployments are well-suited for stateless applications.
We note that there are other types of objects, such as
StatefulSets, which are designed for stateful applica-
tions.
2.2 Kubernetes Autoscaling
The GKE autoscaling is done by two components, the
Horizontal Pod Autoscaler that automatically scales
the number of Pods and works on the application ab-
straction layer, and the Cluster Autoscaler that au-
tomatically resizes the number of Nodes in a given
Node pool and works on the infrastructure layer.
Kubernetes Autoscaling: YoYo Attack Vulnerability and Mitigation
35

Kubernetes also defines the Vertical Pod Autoscaler
(VPA) that automatically sets the resource request and
limit values of containers based on usage. VPA is not
in the scope of this work.
2.2.1 The Horizontal Pod Autoscaler (HPA)
The HPA is responsible for automatically scaling the
number of Pods (Kubernetes.io, 2021). The controller
periodically adjusts the number of Pods needed based
on the observed metric to the target configured by the
user. Each scale rule is defined by a threshold, scale
interval and action, s.t. if the threshold exceeds the
duration of the scale interval, the action will be per-
formed. We denote by I
p
up
\I
p
down
the scale interval for
scale-up and scale-down of a Pod. Note that the de-
fault values (correct to the time of writing this paper)
are 1 minute for I
p
up
and 5 minutes for I
p
down
. The
most common metric for a threshold is the relative
CPU utilization, measured as the actual CPU usage
of a Pod divided by the CPU requested by the Pod.
Note that the different metrics are measured on a ser-
vice level. Let P be the number of Pods, let U
target
be
the relative target CPU of the Pod, defined as the re-
cent CPU divided by the CPU requested by the Pod,
and let U
i
be the relative CPU utilization of the Pod
i measured across the last 1 minute. Note that the
relative CPU utilization can have a value higher than
100%, since the Pod CPU usage is configured in milli
CPU units. Thus, 200 milli CPU is equal to 0.2 CPU,
and if in peak time the Pod uses 500 milli CPU, then
U
i
= 250%. We define the Average Relative CPU Uti-
lization (Current CPU Utilization Percentage in Ku-
bernetes terminology (Kubernetes.io, 2017)) as:
∑
1≤i≤P
U
i
P
(1)
Note that, similar to relative CPU utilization, the av-
erage CPU utilization can be higher than 100%. The
goal of the HPA is that the value will be close to the
target value, in our case CPU utilization, U
target
. In
order to avoid oscillation, the HPA triggers scaling
actions only if the value is below 0.9 or above 1.1 of
the target value (i.e., 10% tolerance) (Kubernetes.io,
2021). Thus, the target number of Pods is:
d
∑
1≤i≤P
U
i
U
target
e (2)
We note that other possible metrics are the relative
memory and storage. The HPA uses an internal ser-
vice called a metric server to periodically test the met-
rics of the cluster and act accordingly (scale-up/scale-
down) (Kubernetes.io, 2021). After a scaling decision
is made, it takes relatively little time until the Pod
is ready to function. We call this time the Warming
time and we denote it by W
p
up
. Similarly, we also have
W
p
down
, the time until the Pod is destroyed. We ob-
served very fast warming time, less than 30 seconds,
and downtime of 5 seconds.
2.2.2 The Cluster Autoscaler (CA)
The CA interacts with the HPA and the metric server.
It monitors and populates pending (newly created)
Pods and releases idle Nodes after the Pods are
closed. Specifically, the CA checks every 10 seconds
for pending Pods that cannot be allocated in existing
Nodes due to the lack of computer resources. If such
Pods are found, it initiates the creation of new Nodes
to which the pending Pods are scheduled. The num-
ber of Pods in the Nodes is according to the machine
type of the Nodes and the deployment configuration
(cluster autoscaling, 2021). The machine type is con-
figured by the system administrator (per Node pool),
and the system allocates as many Pods as possible to
a Node. The bound on the minimum and maximum
number of Nodes in a cluster can be configured. A
minimal Kubernetes cluster needs 3 Nodes for scala-
bility and high availability and can scale up to thou-
sands of Nodes (GKE Guides, 2020). We denote by
the I
n
up
\I
n
down
the scale interval for scale-up and scale-
down of Nodes and the warming time of Nodes by
W
n
up
and W
n
down
. We observed interval scale-up of
10 seconds, and interval scale-down of 10 minutes,
which corresponded to a scale-up warming time of 2
minutes and scale-down warming time of around 2
minutes. We note that none of these parameters can
be configured and are set by the Kubernetes infras-
tructure.
The Kubernetes autoscaling mechanism is well il-
lustrated in figures 1. It shows nicely how the cluster
scales-up Nodes and Pods to manage a flat DDoS at-
tack.
2.3 Kubernetes Pricing Models
As Kubernetes has become the leading container or-
chestration tool in the market, major Cloud vendors
have developed different pricing models to support
their customers in order to leverage Kubernetes from
the TCO (total cost of ownership) perspective. Cost
analysis is crucial to understanding the economic
damage of a YoYo attack on a Kubernetes cluster. We
have selected Google Kubernetes engine platform as
our choice to analyze YoYo attack experiments. How-
ever, our analysis and conclusions are relevant to Ku-
bernetes technology in general. The cost of running
a Kubernetes Cluster in GKE is mainly a function of
the number of Node instances. Customers are billed
for each of those instances according to the Compute
CLOSER 2021 - 11th International Conference on Cloud Computing and Services Science
36
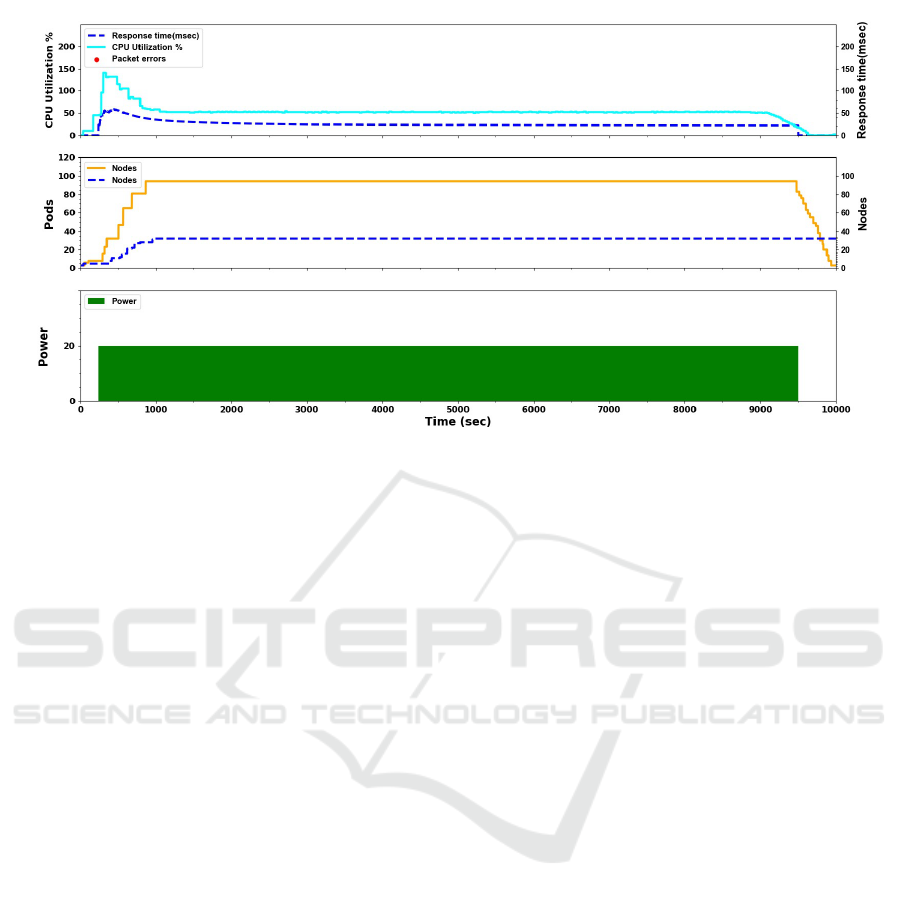
Figure 1: Classic DDoS attack with power k=20 on Kubernetes.
Engine’s pricing, until the Nodes are deleted. These
Node instances are billed on a per-second basis with
a one-minute minimum usage cost regardless of the
container workload in that instance. In addition, there
is an hourly flat fee for cluster management, irre-
spective of cluster size and topology, whether it is a
single-zone, multi-zone or a regional cluster. Amazon
EKS has a similar pricing model where customers us-
ing Amazon EC2 will pay for EC2 Node instances.
Amazon established an alternative pricing model for
their customers called AWS Faragate where the cus-
tomers are charged per vCPU workload, meaning per
resource (Amazon EKS pricing, 2018).
In a Faragate Kubernetes cluster, the instance
hours are proportional to the number of Pods in the
cluster and other resources allocated to those Pods.
Therefore, the cost of attack is derived from the per-
formance damage accrued, and the load of requests
that the cluster can process concurrently is influenced
by the number of Pods and their elasticity.
3 YoYo ATTACK
We follow the notation of the original YoYo attack
(Bremler-Barr et al., 2017) and adapt it to the Kuber-
netes model. Consider a Kubernetes environment that
includes autoscaling with identical service machines
behind a load balancer. Requests arrive with average
rate of r requests per unit time, and the load balancer
distributes them to N
p
Pods that are divided between
N
n
Nodes in the steady state. Let R be the number of
Pods that can be in one node. The number of Pods
in a Node is determined by the Node machine type; a
stronger machine will have a higher number of Pods.
The YoYo attack is composed of n cycles, and
each cycle duration is T , comprised of an on-attack
period, denoted as t
on
, and an off-attack period, de-
noted as t
o f f
. Thus T = t
on
+ t
o f f
. We define the
power of the attack as the extra load on the cluster.
Let k be the power of the attack and r the average re-
quest rate per second in a steady state. We assume
that in the on-attack period, the attacker adds fake re-
quests k times more than the rate in the steady state
(i.e. a total rate of (k + 1) · r), while in the off-attack
period t
o f f
, the attacker does not send any traffic. See
Table 1 for notation summary. The following is the
best strategy from the adversary side: We assume that
the attacker aims to optimize the economic damage of
the attack, with the main goal of being active as little
as possible while still scaling up to extra k · N
n
nodes.
A secondary goal is to cause performance damage.
Autoscaling will occur as a result of Pod cre-
ation, which automatically activates the creation of
new Nodes. Two conditions must be met in order
to activate autoscaling: First, the extra load of k · r
should burden the system such that the threshold for
Pod scaling is fulfilled, regardless of the criterion
(e.g., CPU utilization, traffic). Second, t
on
should be
greater than or equal to the scale-interval of the Pods:
I
p
up
. That is, t
on
≥ I
p
up
. To maximize the performance
damage, the value of t
on
should be set such that the at-
tack continues the load up until all Pods are active and
it loads the largest possible number of Nodes set in
the cluster. Node loading occurs throughout t
on
since
there are not enough activated Pods to meet the per-
formance criterion.
That is, t
on
= I
p
up
+W
p
up
+ I
n
up
+W
n
up
.
Kubernetes Autoscaling: YoYo Attack Vulnerability and Mitigation
37
Figure 2: YoYo attack with power k=20 on Kubernetes.
Note that the dominant values are I
p
up
, which is
around 1 minute, and W
n
up
, which is around 2 minutes.
Therefore an optimal t
on
is around 4 minutes. More-
over, most of the parameters use the system default
configuration, but some of them can be modified. As
such, the attacker will know most of these parameters
and can take advantage of them to optimize the at-
tack. The t
o f f
should be large enough such that all the
Pods and Nodes perform scale-down as this is how we
maximize the run time of the Nodes and cause extra
spending. The mechanism first scales down all Pods,
after which it triggers the scale-down of the Nodes.
Hence, t
o f f
= I
p
down
+ W
p
down
+ I
p
down
+ W
n
down
. Note
that the dominant values are I
p
down
of 5 minutes and
I
n
down
of 10 minutes. Thus, the optimal t
o f f
is around
18 minutes.
An illustration of the YoYo attack can be seen in
figures 2. It shows nicely how the cluster oscillates its
auto-scaling mechanism bases on Pods and Nodes to
manage bursts of escalated traffic.
4 EXPERIMENT ANALYSIS
In this section, we present a proof of concept of the
YoYo attack on Google Kubernetes engine (GKE).
Our environment in GKE consists of a simple HTTP
server wrapped with a Docker container, front-end
side stateless without back-end. Each container is
wrapped into a Pod. We ran the Pods with the De-
ployment Controller, which is well-suited for stateless
applications.
4.1 GKE Parameter Settings
We set the HPA utilization target parameter, U
target
,
to 50%. The container runs a Web server where each
connection requires high CPU consumption. Each
request to the Web server will perform some com-
putation on the dynamic input of that query. We
used Google Stackdriver and the Kubernetes ”watch”
command to monitor cluster parameters while collect-
ing logs using the Kubernetes Core API about Pods,
Nodes, Relative CPU Utilization and the response
time. We used Apache JMeter (Apache JMeter
TM
,
2019) to simulate the load on the cluster. We evalu-
ated the performance and economic damage through-
out the attack. Our Cluster Autoscaler boundaries
were set to a minimum of 3 Nodes. For the Node ma-
chine, we use an N1-Standard-1 CPU, and we started
the experiment with 4 Nodes. In this configuration
there are 3 Pods per Node (R = 3). At the begin-
ning of the experiment there are 4 Nodes and 3 Pods
(N
n
= 4 , N
p
= 3). Hence, the system has enough
Nodes to populate newly created Pods (at least more
than N
n
∗ R − N
p
Pods). This is a common technique
that allows a fast response to a limited overload, while
paying for extra Nodes. We set the power of the attack
k, to 20. We set the on-attack time to t
on
= 10 min-
utes and the off attack time to t
o f f
= 20 minutes; a
substantial number of experiments showed these val-
ues to be the best (although not optimal bullet proof)
for the YoYo attack and can demonstrate YoYo attack
characteristics.
CLOSER 2021 - 11th International Conference on Cloud Computing and Services Science
38
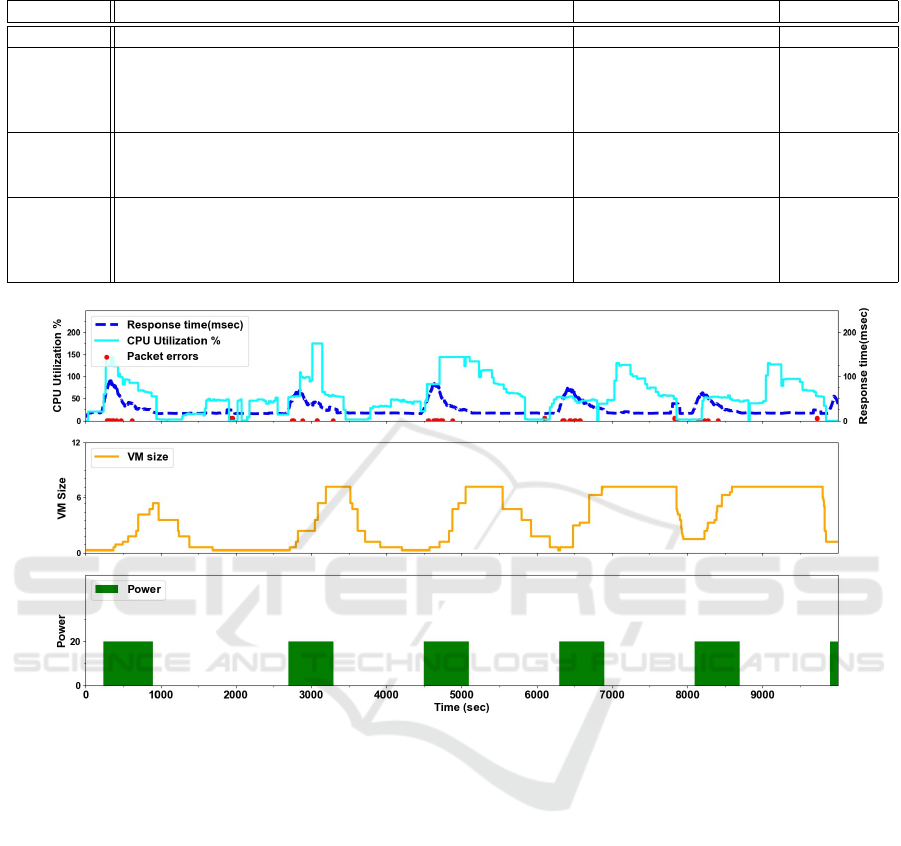
Table 1: Notation values of parameters given according to the experiments in Section 4.
Parameter Definition Configuration given by Value
r Average requests rate per second of legitimate clients System usage
N
p
Initial number of Pods 4
N
n
Initial number of Nodes System administrator 4
R Number of Pods per Node 3
I
p
up
\I
p
down
Threshold interval for scale-up and scale-down for a Pod 1min\5min
I
n
up
\I
n
down
Threshold interval for scale-up and scale-down for a Node 10sec\10min
W
p
up
\W
p
down
Warming time of scale-up and scale-down for a Pod Kubernetes infrastructure 30sec\5sec
W
n
up
\W
n
down
Warming time of scale-up and scale-down for a Node 2min\2min
k The power of the attack
n Number of attack cycles Attacker
T Cycle duration 10\20
t
on
\t
o f f
Time of on-attack phase and off-attack phase. T = t
on
+t
o f f
Figure 3: YoYo attack on Google Cloud Engine, VM Group.
4.2 Experiment Results
Figure 2 illustrates this attack: There are three sub-
graphs sharing the x-axis, that shows the attack time
series in seconds. The bottom sub-graph shows the
t
on
/t
o f f
attacks (on attacks are in filled green rectan-
gles) using the Power unit. The middle sub-graph de-
scribes the expansion of Pods (orange line) that the
victim loads throughout the attack. The dotted blue
line represents the number of nodes provisioned to ac-
commodate the Pods. The number of Pods increases
up to 120 and the number of Nodes increases to 32 as
a result of the increase in CPU utilization. When the
attack ends the cluster autoscaling keeps Pods in the
idle state for 5 more minutes and the Nodes remain
active for 10 additional minutes after all Pods are ter-
minated. The top sub-graph describes both the aver-
age relative CPU utilization in cyan solid line. The
CPU Utilization graph follows the equation 1, and as
explained, the value can be larger than 100%. The
HPA aims for a value of U
target
= 50, and the scal-
ing decision is made according to these values. The
dashed blue line in the sub-graph shows an average
response time to answer requests in the cluster.
In some cases when nodes are deleted we experi-
enced transient disruption interpreted as packet errors
and marked in red dots. This phenomenon is due to
the fact that our workload consists of a controller with
a single replica, whose Pod might be rescheduled to
a different node when its current node was deleted.
This can be solved by configuring critical Pods not to
be interrupted.
4.2.1 Comparing the YoYo Attack to the Classic
Attack
In order to understand the effect of the YoYo attack
on Kubernetes as compared to a traditional DDoS at-
Kubernetes Autoscaling: YoYo Attack Vulnerability and Mitigation
39

tack, we executed a constant power attack experiment
(k = 20). Figure 1 illustrates a classic DDoS attack
that employs the same power of attack on the cluster
as in the YoYo attack. The three sub-graphs share a
common x-axis which, as in Figure 2, shows the at-
tack time series in seconds. Likewise, the y-axis of
each sub-graph is as described in Figure 2.
We define D
attack
p
(k), the performance damage
caused by an attack as a function of k, the power of
the attack, and assess it as the average extra response
time to answer requests during the total attack time.
We note that this is a simplified assumption, since the
actual impact on client performance is more compli-
cated to analyze. We define the relative performance
damage as the ratio between the damage following
the attack and the corresponding value measured at
a steady state.
RD
attack
p
(k) =
D
attack
p
(k)
D
attack
p
(k = 1)
. (3)
Similarly, we define relative economic damage as the
ratio between the economic damage following the at-
tack and the corresponding value measured at a steady
state.
RD
attack
e
(k) =
D
attack
e
(k)
D
attack
e
(k = 1)
. (4)
D
attack
e
(k), is the economic damage caused by the at-
tack, and assess it as the average extra Nodes running
in the system for the duration of the attack. We re-
fer in Figure 4 to RD
attack
p
(k) and RD
attack
e
(k) as the
relative performance damage and relative economic
damage correspondingly.
In the YoYo attack, the attack cost is directly af-
fected by the power of attack k and by the t
on
period
relative to the attack cycle length. That is:
Cost(k) = k ·
t
on
T
(5)
The cost of a classic DDoS attack is equal to the
power of the attack, while the cost of the YoYo attack
is only a third of the cost of a classic attack.
Potency is a metric that measures the effectiveness
of DDoS attack from the attacker side. It is defined as
the ratio between the damage caused by an attack and
the cost of mounting such an attack. We denote P
e
(k)
as the Potency of the attack. An attacker would be
interested in maximizing the potency. We use the fol-
lowing definitions for cluster autoscaling (ca) attack:
P
e
(k) =
RD
e
(k)
Cost(k)
(6)
Figure 4 illustrates a comparison of the relative eco-
nomic damage and the potency incurred by the victim
had it been attacked by the two attack types. Fig-
ure 4 shows that the classic DDoS attack results in
RD
e
= 7 whereas the YoYo attack results in RD
e
= 5.
The top sub-graph shows the potency comparison be-
tween the YoYo attack and the classic DDoS attack.
In addition, the YoYo attack causes iterative perfor-
mance damages, incurred at the beginning of each it-
eration starting at t
on
. The classic DDoS attack causes
the least performance damage to a Kubernetes cluster
without any packet errors since Pods are not resched-
uled and Nodes are not scaled-down. The attack im-
pact is mainly in the beginning of the attack while
for the remainder of the attack a Kubernetes cluster
is fully resilient. We summarize the results in Table
2 and conclude that the YoYo attack on Kubernetes
is more cost effective for the attacker than a classic
DDoS attack.
4.2.2 YoYo Attack: Kubernetes Vs. VM
To emphasize that Kubernetes has better resilience
than VM against YoYo attacks (performance wise) but
shares a similar vulnerability to economic damage,
we repeated the experiments from the original YoYo
paper (Bremler-Barr et al., 2017) and compared them
to the experiments we conducted in this paper. We
built an instance of VM group in GCE and a load bal-
ancer based on a VM group template using machine
type n1-standard-1 (1 vCPU, 3.75 GB memory) iden-
tical to the one we built for the GKE cluster. The
VM group instance is set with auto-scaling capabil-
ity of up to 24 VMs and adaptive scaling where all
the machines that are ready to be scaled are scaled
up at once. We used same parameters used in the
YoYo Kubernetes attack and ran it for n cycles of du-
ration T. The power of the attack was k = 20. Fig-
ure 3 illustrates YoYo VM attack which can be com-
pared with the YoYo Kubernetes attack illustrated in
Figure 2. A key observation is that an attack on VM
group causes to an immediate slow response time and
packet errors through the burst of loads. That obser-
vation lasts until the scale-up process ends. This be-
havior repeats in every attack cycle. YoYo VM attack
results a relative performance damage RD
p
= 1.66.
The relative performance degradation recorded by a
YoYo Kubernetes is significantly lower with almost
no packet errors (except the transient disruption due
to Pods rescheduling). We can explain this since Ku-
bernetes loads Pods in seconds to absorb the increased
traffic until enough additional Nodes are ready with
new Pods. Like in Kubernetes the attack cost is di-
rectly affected by the power of attack k and by the
t
on
period relative to the attack cycle length. Figure
4 shows that the YoYo VM attack results almost the
same relative economic damage and Potency as the
CLOSER 2021 - 11th International Conference on Cloud Computing and Services Science
40

YoYo attack causes to a Kubernetes cluster. YoYo at-
tack may cause relatively the same economic damage
in the cloud to GCE VM group as to a Kubernetes
cluster, while the performance damage is more sig-
nificant to a victim in GCE VM group. We conclude
that a VM group is less resilient to YoYo attacks than
a Kubernetes cluster.
Table 2: Summary results: Classic DDoS:(k = 20), YoYo
Kubernetes and YoYo VM both:[t
on
= 10,t
o f f
= 20],(k =
20).
Parameters Classic DDoS YoYo Kubernetes YoYo VM
Cost 20
20
3
20
3
Relative Economic Damage 7 5 5
Relative Performance Damage 0.75 1.15 1.66
Potency Economic 0.3 0.75 0.75
5 YoYo ATTACK DETECTION
In this section we propose an enhanced detection
technique designed to protect Kubernetes autoscal-
ing from YoYo attacks. Detecting YoYo attack al-
lows cloud vendors to mitigate the attack by apply-
ing different strategies such as inline scrubbing or by
holding cluster downscale of Nodes to maintain the
short response time on the expense of high economic
damage. Unfortunately, we were unable to access real
life data from Kubernetes production clusters that can
supply big data to feed our model. Our research aims
to analyze a live Kubernetes cluster reacting dynam-
ically. Considering that, although our analysis is fo-
cused on ML methods evaluation and results high ac-
curacy detecting the YoYo attack, we can not guar-
antee at this point the same results on a production
Kubernetes cluster.
Time series data generated by the Kubernetes
cluster are the primary foundations of the features for
our model (e.g., response time, pod count, node count
and CPU load as you can see see in Figure 2). The in-
put data contains hundreds of thousands discreet fea-
tures (e.g., each value recorded is considered a fea-
ture). We evaluated a deep neural network approach
where a convolution neural network (CNN) was con-
catenated with long short term memory (LSTM) mod-
ule which is good fit for a sequential data, followed by
a linear layer to classify a YoYo attack. This deep neu-
ral network requires a large amount of data and long
training cycles, this method is not optimal to sparse
datasets. In order to match our unique input data to
machine learning methods we used a feature extrac-
tion principles. We found out that extracting statisti-
cal functions from the time series data (e.g mean, min-
imum, maximum,std,median) generating up to 20 fea-
tures per sample is ideal for our model to achieve ex-
cellent performance. We evaluated multiple machine
learning methods and selected the XGBoost (Chen
and Guestrin, 2016) algorithm. XGBoost is a non lin-
ear classifier that works well for our attack detection
evaluation.
5.1 Model Setup and Formulation
5.1.1 XGBoost Classification Algorithm
XGBoost is a state of the art method that addresses the
best speed and accuracy with limited datasets. XG-
Boost is a classifier and a regressor based on the gra-
dient boosting algorithm. It uses an ensemble of deci-
sion trees. Each tree corrects the mistakes of the trees
that came before it. It is both fast and efficient, per-
forming well on sparse data and on a wide range of
predictive modeling tasks.
We explain the XGBoost detection method (Chen
et al., 2018) in a nut-shell. R
m
is the space of regres-
sion trees. Let q represent the structure of each tree
that maps a sample to a corresponding leaf index. Let
T be the number of leaves in the tree. Each f
k
cor-
responds to an independent tree structure q and leaf
weights w. Each regression tree contains a continu-
ous score on each leaf. The final prediction for a given
sample is the sum of predictions from each tree. The
tree ensemble model is trained in an additive mode
and it greedily sums up the gradients on each leaf and
then applies the scoring value to improve the target
function, and brings the result to a minimum.
5.1.2 Methodology & Data Engineering
Our test-bed design for the YoYo attack on Kuber-
netes is documented in detail in Section 4 (Experi-
ment analysis). We built our datasets on a live cluster,
experimenting on labeled traffic loads with the fol-
lowing two classes: Attack (1) and Regular (0). Class
label Attack (1) represents a YoYo attack as described
above, and class label Regular (0) represents an av-
erage load on a site. Testing and training datasets
are a collection of balanced experiments of the two
classes taken with a range of parameters as describe
in 3. Note, the default setting for the on-attack time
to t
on
= 10 minutes and off-attack time to t
o f f
= 20
minutes. The default settings for the YoYo attack is
k = 20 and for Regular load is k = 2. The collec-
tion is split randomly with 70%:30% ratio for training
and testing datasets. We are interested in learning the
cluster autoscaling behavior when the system is un-
der attack and when the system is normally or highly
but legitimate loaded. The goal is to binary classify
the situation. We mimicked normal and attack distri-
butions loads by setting HTTP connections using the
Kubernetes Autoscaling: YoYo Attack Vulnerability and Mitigation
41
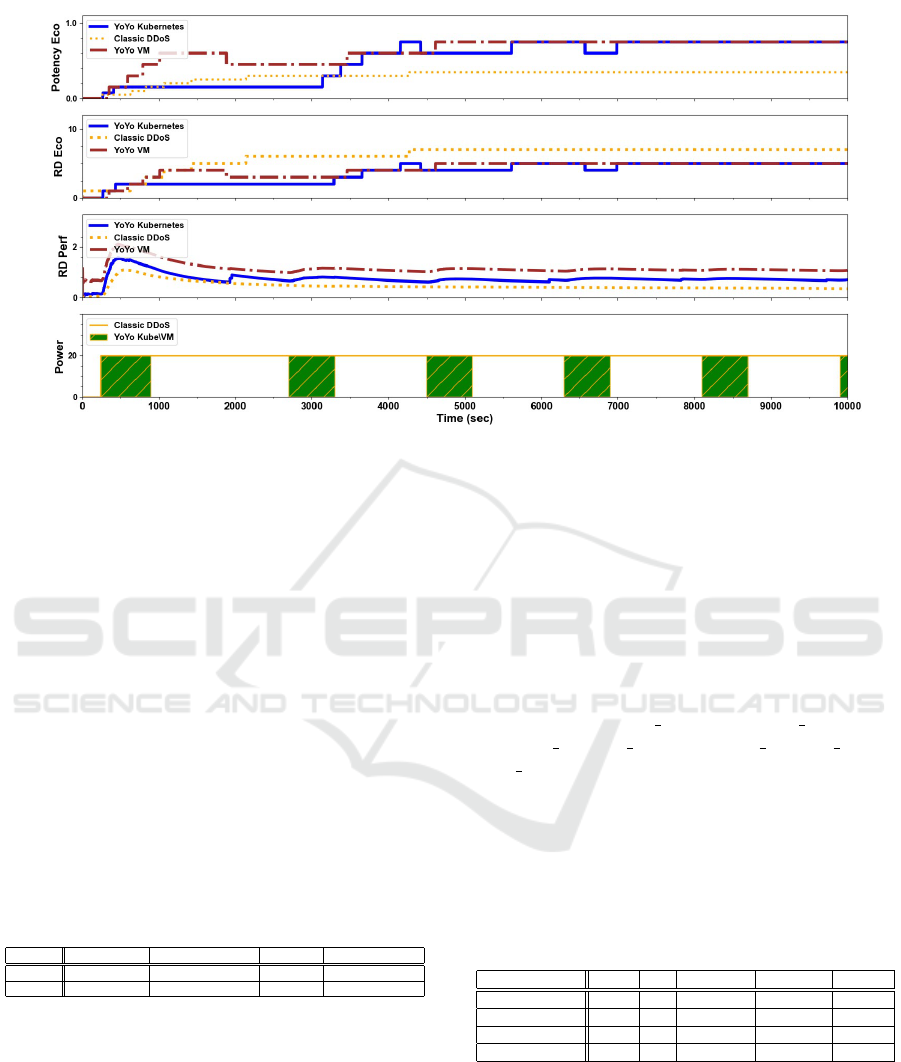
Figure 4: Measuring attack effectiveness: Classic DDoS Vs. YoYo on Kubernetes and VM.
popular JMeter v5.2 (Apache JMeter
TM
, 2019) net-
work tool. Hence we started by generating a workload
that simulates YoYo attacks. To increase the dataset
variance we populated multiple parameters and val-
ues. We trained the model with multiple t
on
and t
o f f
attacks, covering in each attack or regular sample at
least 3 cycles of duration T . Thus, our model requires
at least 3 of cycles of duration T for inference. We
configured threads ramp-up time (The ramp-up pe-
riod defines the duration the full number of threads
are loading) to control load scale-up in different lev-
els. Last, we used JMeter timers to set either a con-
stant or random delay between requests in the Regular
class. We believe that using all of these parameters
simulate similar conditions as best as possible of a
real distributed load on typical web applications. Ta-
ble 3 represents the variance of datasets created using
experiments parameters.
Table 3: Dataset parameters for YoYo classifier.
ramp-up(sec) t
on
/t
o f f
(min) Power(k) timers
Regular 30,60,120 continuous 1,3,5,7 constant,random
Attack 30,60,120 7/14, 10/20, 12/24 15,20,30 constant
5.1.3 XGBoost Optimization
We used Python Scikit-learn model selection in-
terfaces such as RandomizedSearchCV and Grid-
SearchCV to optimized the XGboost parameters. The
parameters of these estimators used to optimized our
selected method parameters by cross-validated search
over parameter settings and can apply scoring. The
parameters we optimized using these methods are:
number of estimator trees (The more trees defined,
the better are the estimates and longer is the compu-
tation time), max depth (parameter to control over-
fitting as higher depth will allow model to learn re-
lations very specific to a particular sample. The ab-
solute maximum depth would be N − 1, where N
is the number of training samples), max features
and criterion (Impurity function: gini vs entropy).
We found by using cross validation estimator the
following parameters values as the best to achieve
the highest performance: classweight = balanced,
criterion = gini, max depth = 1, max f eatures =
auto, min samples lea f = 10, min samples split =
40, n estimators = 10. In addition, we executed the
Explainable Boosting Machine package (EBM) to un-
derstand the most explainable features for the classifi-
cations among the 20 selected features. Table 4 ranks
each feature with a value between 0 and 10 where 0 is
the least important feature for the model and 10 is the
most important feature.
Table 4: Importance absolute score for XGBoost features.
Feature name Mean Std Maximum Minimum Median
Response Time 6.0 6.0 8.8 0.0 7.8
Pods 9.3 9.8 9.5 0.0 7.2
CPU load 4.4 4.5 10.0 0.0 1.0
Nodes 9.2 9.2 9.8 5.5 9.3
5.2 Evaluation Results
In this section we summarize the results of our
models as they perform on our dataset. We collected
experimental data from 21 samples of attacks and the
same regular load as described above. We provide
the results of classification measures for accuracy,
CLOSER 2021 - 11th International Conference on Cloud Computing and Services Science
42

precision, recall, F1, false positives (FP), false
negatives (FN), true positives (TP) and true negatives
(TN).
accuracy =
T P + T N
T P + FP + T N + FN
(7)
precision =
T P
T P + FP
(8)
recall =
T P
T P + FN
(9)
F1 = 2 ·
precision · recall
precision + recall
(10)
5.2.1 XGBoost Classifier Evaluation
The XGBoost classifier has the most accurate results
on our Datasets as you can see in table 5. We evalu-
ated multiple machine learning methods in addition to
XGboost. Among them are: Logistic regression, Ran-
dom forest, Decision trees and a deep neural network
based on CNN + LSTM. XGBoost model is a perfect
fit for experiments with either sparse data, it requires
less performance time (no epochs are required), and it
suffers the least from over-fitting.
Our proposed classifier can achieve the highest ac-
curacy score on the testing dataset, the XGBoost al-
gorithm reaches an accuracy score of 95% (F1=0.94),
while the CNN+LSTM, Logistic Regression, Deci-
sion Tree and Random Forest can achieve accuracy
score which is less than 90%. The running time of
XGBoost and other classic machine learning algo-
rithms is less than a second. The running time of
CNN+LSTM is much higher,it is counted in thou-
sands seconds due to the enormous number of epochs.
Therefore, overall, our selected model has the best
comprehensive performance.
Table 5: Algorithms performance comparison.
Recall Precision Accuracy % Training Time(sec)
XGBoost 1.0 0.89 94% 0.33
CNN+LSTM 0.85 1.0 93% 3600
Random Forest 0.83 0.82 83% 0.15
Logistic Regression 0.78 0.78 85% 0.5
Decision Tree 0.83 0.89 84% 0.04
6 RELATED WORK
DDoS prevention is crucial to cloud computing en-
vironments (Grobauer et al., 2011). Several works
(AWS Best Practices, 2019; Miao et al., 2014) rec-
ommend auto-scaling and Kubernetes specifically as
a possible solution to mitigate DDoS attacks. Some
works (VivinSandar and Shenai, 2012; Somani et al.,
2015) describe how a traditional DDoS attack can be
transformed into an EDoS in the cloud environment.
Other works have tried to mitigate EDoS attacks
(Shawahna et al., 2020; Nautiyal and Wadhwa, 2019;
Ravichandiran et al., 2018; Chen et al., 2018) using
machine learning classification techniques trying to
limit a malicious bot. A recent work uses the XG-
Boost classifier as a DDoS detection method (Chen
et al., 2018) in an SDN based cloud. Other studies
(Casalicchio and Perciballi, 2017) research container-
ized autoscaling but refer neither to cloud resilience
nor DDoS mitigation. A recent work (Ravichandi-
ran et al., 2018) focused on resource patterns with
cyclic trends with the aim of analyzing resource be-
havior on micro-services using auto-aggressive statis-
tical models on auto-scaling systems. Older works at-
tempt to prevent EDoS by directing suspicious traffic
to a scrubber service and using client puzzles to detect
legitimate users by identifying suspicious traffic using
a threshold policy (e.g., requests/sec)(Naresh Kumar
et al., 2012).
7 CONCLUSIONS
In this work we illuminate the potential of exploit-
ing the auto-scaling mechanism to perform an effi-
cient attack on Kubernetes that impacts the cost and
the quality of a service. We show that Kubernetes
is still vulnerable even with a light-weight container-
ized architecture. We also show that YoYo VM attack
results almost the same relative economic damage as
the YoYo Kubernetes attack. However, VM groups
are still less resilient to YoYo attacks than Kubernetes
clusters. In addition we conclude that the YoYo attack
on Kubernetes is more cost effective for the attacker
than a classic DDoS attack. We believe that the auto-
scaling mechanism alone is not enough, and therefore
we propose a unique approach based on XGBoost al-
gorithm to detect YoYo attacks and allow to mitigate
the DDoS damage. We also show that XGBoost al-
gorithm has an high accuracy and a lower false pos-
itive rate. To the best of our knowledge this work is
the first to detect DDoS burst attacks on a Kubernetes
cluster using a machine learning method, specifically
with XGBoost.
Future works will aim to evaluate YoYo attacks on
multiple applications from different tenants running
in the same Kubernetes cluster when only one of the
applications is the target. Future research may also
evaluate the resilience of cloud mesh services running
multi-tenant environments to YoYo and similar DDoS
attacks.
Kubernetes Autoscaling: YoYo Attack Vulnerability and Mitigation
43

ACKNOWLEDGEMENTS
This research was supported by Google Cloud Re-
search. We would like to thank also to Daniel Bachar
and Assaf Sinvani for helpful discussions and their
help with the experiments setup.
REFERENCES
Amazon EKS pricing (2018). Amazon eks pricing. https:
//aws.amazon.com/eks/pricing/.
Apache JMeter
TM
(2019). The apache jmeter
TM
. https:
//jmeter.apache.org/.
AWS Best Practices (2019). Aws best practices for ddos
resiliency,december 2019. https://d0.awsstatic.com/
whitepapers/Security/DDoS White Paper.pdf.
Bremler-Barr, A., Brosh, E., and Sides, M. (2017). Ddos at-
tack on cloud auto-scaling mechanisms. In IEEE IN-
FOCOM 2017 - IEEE Conference on Computer Com-
munications, pages 1–9.
Casalicchio, E. and Perciballi, V. (2017). Auto-scaling
of containers: The impact of relative and absolute
metrics. In 2017 IEEE 2nd International Workshops
on Foundations and Applications of Self* Systems
(FAS*W), pages 207–214.
Chai, E. (2013). Ddos attacks: Hit and run
ddos attack. https://www.imperva.com/blog/
hit-and-run-ddos-attack.
Chen, T. and Guestrin, C. (2016). Xgboost: A scalable
tree boosting system. In Proceedings of the 22nd
ACM SIGKDD International Conference on Knowl-
edge Discovery and Data Mining, KDD ’16, page
785–794, New York, NY, USA. Association for Com-
puting Machinery.
Chen, Z., Jiang, F., Cheng, Y., Gu, X., Liu, W., and Peng,
J. (2018). Xgboost classifier for ddos attack detection
and analysis in sdn-based cloud. In 2018 IEEE Inter-
national Conference on Big Data and Smart Comput-
ing (BigComp), pages 251–256.
Cimpanu, C. (2017). Pulse wave new
ddos assault pattern discovered. https:
//www.bleepingcomputer.com/news/security/
\\pulse-wave-new-ddos-assault-pattern-discovered/.
cluster autoscaling (2021). Cluster autoscaler.
https://cloud.google.com/kubernetes-engine/docs/
concepts/cluster-autoscaler.
Dahan, A. (2018). Behavioral burst-attack protec-
tion. https://blog.radware.com/security/2018/02/
burst-attack-protection.
Deepa, V., Sudar, K. M., and Deepalakshmi, P. (2018).
Detection of ddos attack on sdn control plane using
hybrid machine learning techniques. In 2018 Inter-
national Conference on Smart Systems and Inventive
Technology (ICSSIT), pages 299–303.
GKE Guides (2020). Guidelines for creating scalable
clusters. https://cloud.google.com/kubernetes-engine/
docs/concepts/scalability.
Grobauer, B., Walloschek, T., and Stocker, E. (2011). Un-
derstanding cloud computing vulnerabilities. IEEE
Security Privacy, 9(2):50–57.
Kubernetes.io (2017). Horizontal pod autoscaler.
https://github.com/kubernetes/community/blob/
master/contributors/design-proposals/
autoscaling/horizontal-pod-autoscaler.md.
Kubernetes.io (2021). Horizontal pod autoscaler.
https://kubernetes.io/docs/tasks/run-application/
horizontal-pod-autoscale/.
Miao, R., Yu, M., and Jain, N. (2014). NIMBUS: cloud-
scale attack detection and mitigation. In ACM SIG-
COMM Computer Communication Review, 2014, vol-
ume 44, pages 121–122. SIGCOMM.
Naresh Kumar, M., Sujatha, P., Kalva, V., Nagori, R.,
Katukojwala, A. K., and Kumar, M. (2012). Mit-
igating economic denial of sustainability (edos) in
cloud computing using in-cloud scrubber service. In
2012 Fourth International Conference on Compu-
tational Intelligence and Communication Networks,
pages 535–539.
Nautiyal, S. and Wadhwa, S. (2019). A comparative ap-
proach to mitigate economic denial of sustainability
(edos) in a cloud environment. In 2019 4th Interna-
tional Conference on Information Systems and Com-
puter Networks (ISCON), pages 615–619.
Ravichandiran, R., Bannazadeh, H., and Leon-Garcia, A.
(2018). Anomaly detection using resource behaviour
analysis for autoscaling systems. In 2018 4th IEEE
Conference on Network Softwarization and Work-
shops (NetSoft), pages 192–196.
Shawahna, A., Abu-Amara, M., Mahmoud, A. S. H., and
Osais, Y. (2020). Edos-ads: An enhanced mitiga-
tion technique against economic denial of sustainabil-
ity (edos) attacks. IEEE Transactions on Cloud Com-
puting, 8(3):790–804.
Somani, G., Gaur, M. S., and Sanghi, D. (2015).
DDoS/EDoS attack in cloud: affecting everyone out
there! In Proceedings of the 8th International Confer-
ence on Security of Information and Networks, 2015,
pages 169–176. ACM.
VivinSandar, S. and Shenai, S. (2012). Economic denial
of sustainability (EDoS) in cloud services using http
and xml based DDoS attacks. International Journal
of Computer Application 2012, 41(20).
Zeifman, I. (2019). Pulse wave ddos at-
tacks:. https://www.imperva.com/blog/
pulse-wave-ddos-pins-down-multiple-targets/.
CLOSER 2021 - 11th International Conference on Cloud Computing and Services Science
44
