
Structural Similarities of Emotion-exchange Networks: Evidence from
18 Crisis Events
Ema Ku
ˇ
sen
1
and Mark Strembeck
1,2,3
1
Vienna University of Economics and Business, Vienna, Austria
2
Secure Business Austria (SBA), Vienna, Austria
3
Complexity Science Hub (CSH), Vienna, Austria
Keywords:
Crisis Events, Emotion Analysis, Network Motifs, Online Social Networks, Twitter.
Abstract:
Online social networks (OSNs) play a significant role during crisis events by offering a convenient channel
for information seeking, social bonding, and opinion sharing. In this context, people express their fear, panic,
shock, as well as gratitude, well-wishing, and empathy as a crisis event evolves over time. Though emotional
responses during crisis events have been studied both in offline and online settings, it is yet unclear which
communication structures are representative for the exchange of specific types of emotions. In this paper,
we report on new findings which indicate that not all negative emotions are exchanged in the same way. In
particular, we used emotion-exchange motifs to compare the structure of emotion-annotated communication
networks that resulted from 18 crisis events. Our findings clearly indicate that 1) exchanges of sadness on
the one hand, and joy/love on the other show more structural similarity than any other pair of emotions,
2) emotion-exchange networks can be clustered into two families, each of which includes different types of
emotions, 3) membership in the two families of emotion-exchange networks fluctuates over time. A related
data-set is available for download from IEEE DataPort, DOI: 10.21227/yajb-6y77.
1 INTRODUCTION
Emotions motivate human behavior (Holyst, 2016)
and influence physiological and mental health
(Abdul-Mageed and Ungar, 2017). For example, they
trigger a flight reaction when people face danger or
provoke tears and sobbing when experiencing loss
and helplessness. In this light, emotions play a crucial
role in crisis events, which are described as sudden,
threatening, and traumatic events which cause intense
feelings of danger, shock, panic, and fear (Flynn,
1997). Thereby, emotions considerably shape the col-
lective experience of an event (von Scheve and Ismer,
2013).
Since online social networks (OSNs) are predom-
inantly networks of people, human emotions can sig-
nificantly influence user behavior and information dif-
fusion in OSNs. In this context, (Scheve, 2014) in-
dicated that the study of emotions and their roles in
OSNs may reveal dynamic processes and structures
that emerge due to interactions between OSN users.
For example, previous studies demonstrated that emo-
tions conveyed in OSN messages may boost or de-
crease the diffusion rate of a message within a so-
cial network (Kim et al., 2013; Tsugawa and Ohsaki,
2015). Other findings, such as (Berger, 2011), indi-
cate that emotions of the same affective valence
1
(e.g.,
anger and sadness) are not exchanged in the same way
and inspire different reactions in offline settings.
Although the existing body of literature provides
valuable insights into the emotions expressed during
various types of events, their influence on the pro-
cess of emotional contagion and message diffusion,
as well as the emergence of collective emotions, there
is a lack of studies which systematically examine
the underlying communication structures that arise
from emotional messaging. In this context, emotions
exchanged between pairs of users (so called dyads)
has been well studied. Yet, as noted by (Scheve,
2014), emotions exchanged within a dyadic structure
may further propagate to other connected individu-
als. Multiple authors further noted that strongly ex-
perienced emotions, such as anger or fear are shared
1
Affective valence is a term which distinguishes be-
tween pleasant (positive) or unpleasant (negative) emotions.
For example, negative emotions include anger, sadness,
fear, and disgust, while positive emotions include joy, trust,
and anticipation.
Kušen, E. and Strembeck, M.
Structural Similarities of Emotion-exchange Networks: Evidence from 18 Crisis Events.
DOI: 10.5220/0010397000250036
In Proceedings of the 6th International Conference on Complexity, Future Information Systems and Risk (COMPLEXIS 2021), pages 25-36
ISBN: 978-989-758-505-0
Copyright
c
2021 by SCITEPRESS – Science and Technology Publications, Lda. All rights reserved
25

with others as a form of one’s coping mechanism
(Fraustino et al., 2012). This phenomenon is rooted
in psychology and is referred to as the social sharing
of emotions (Rim
´
e et al., 1991). Through such a pro-
cess, emotions that are propagated from a dyad to a
larger group of people form a network structure.
In this paper, we report on a study that investigates
how emotions contribute to the underlying topologi-
cal structure of OSN messaging networks. In particu-
lar, we examine how emotions contribute to the emer-
gence of families of emotion-exchange networks. Our
findings clearly indicate that seemingly similar emo-
tions, such as the negative emotions of anger and sad-
ness, do not only inspire different reactions in terms of
forwarding or endorsing a message, but that the way
they are exchanged also results in structurally differ-
ent communication networks.
The remainder of this paper is organized as fol-
lows. In Section 2, we provide an overview of related
work followed by a description of our research proce-
dure in Section 3. Our findings are reported in Section
4 and discussed in Section 5. Section 6 concludes the
paper and provides directions for future work.
2 RELATED WORK
Structural similarity of networks has been studied
over a wide range of real-world networks, includ-
ing social networks, air navigation networks, or food
networks. Often, network structures are compared
via their global properties (network density, degree
distributions, average path length, network diameter,
transitivity, clustering coefficients) and local (node-
centric) properties (such as various centrality mea-
sures; see, e.g., (Sun and Wandelt, 2014),(Shi and
Macy, 2016)). Other approaches analyze the nodes’
influence in order to compare different networks con-
sisting of the same set of nodes (Koutra et al., 2013),
or the spectral clustering of graphs (see, e.g., (Gera
et al., 2018)).
In recent years, approaches studying network mo-
tifs (Milo et al., 2002) led to many interesting in-
sights that could not have been found by comparing
global network properties alone. In this sense, net-
work motifs reveal the underlying functional prop-
erties of complex networks (Masoudi-Nejad et al.,
2012) that would otherwise remain hidden.
For example, (Milo et al., 2004) correlated the
significance profiles (SPs) of network motifs found
in seemingly unrelated networks from different dis-
ciplines, such as WWW links, word-adjacency net-
works, genetic networks, and sensory transcription
networks. Moreover, (Klaise and Johnson, 2017)
compared food networks by correlating the SPs of
network motifs and applying a trophic coherence
measure which reveals how layered a network is.
Moreover, (Topirceanu et al., 2016) compared the
underlying structure of friendship graphs derived
from three online social networks (Facebook, Twitter,
Google+). Our paper follows a similar line of work
by exploring emotion-annotated communication net-
works derived from Twitter conversations.
3 PROCEDURE
Our research procedure includes seven main steps, as
depicted in Figure 1.
1. Data Extraction. We used Twitter’s Search API to
extract publicly available tweets that have been sent
during eighteen crisis events. In order to extract the
relevant tweets, we monitored Twitter and systemat-
ically selected a set of hashtags and key-terms asso-
ciated with each crisis event. The data was collected
from the first day of an event and stopped when the
event did not produce a considerable number of mes-
sages anymore (usually after seven to fourteen days).
After collecting the raw data, we removed duplicate
entries and messages that were uninformative with
respect to emotion detection. Our final data-set in-
cluded 23,308,071 tweets (see Table 1).
2. Emotion Detection. After data pre-processing,
we applied our emotion detection procedure (for de-
tails see (Ku
ˇ
sen et al., 2017)) which determines the
presence and the intensity of the eight basic emo-
tions found in Plutchik’s wheel of emotions (anger,
fear, disgust, sadness, joy, anticipation, trust, sur-
prise). Our approach uses the NRC emotion-word
lexicon (Mohammad and Turney, 2013) to identify
the presence of each basic emotion and the AFINN
lexicon to boost or decrease the intensity of an affect
(Hansen et al., 2011). In addition, we also applied
a set of heuristics that people naturally use to detect
emotions in written texts including amplifiers, maxi-
mizers, downtoners, and negation. Moreover, the al-
gorithm also considers characteristic features that are
frequently found in OSN messages (especially emoti-
cons and common abbreviations). For example, the
tweet “@screenname I am so very sorry to hear the
sad news about lieutenant Arnaud Beltrame. He has
displayed the true courage.” conveys an explicitly
named emotion and was annotated in the following
way: sadness = 3, fear = 2, trust = 1, the remaining
emotions = 0 (whereby the values refer to the emo-
tion intensity). Another example illustrates emotion
annotation for a tweet where an emotion is implied –
“@screennameA @screennameB f***ing idiot! How
COMPLEXIS 2021 - 6th International Conference on Complexity, Future Information Systems and Risk
26

1-Data
extraction
l
1
l
2
l
n
Emotion
labeling
2-
@-network
reconstruction
3-
Null model
generation
5-
Motif
detection
6-
7 - Discovery of
network families
4 - Define a
multiplex
model
Figure 1: Research procedure.
many shootings will it take for you to wake up and
change the law about gun control? #guncontrol”
which was annotated in the following way: anger =
2, disgust = 3, fear = 2, all remaining emotions = 0.
Our algorithm was designed to run on multiple CPU
cores and thereby parallelizes the emotion detection
procedure.
Testing the Accuracy. To test for the accuracy of
our procedure, we deployed two independent human
raters. To mitigate potential bias in emotion detection,
we chose the raters who were personally not involved
in any of the crisis events studied in this paper. Their
task was to assign 0 (emotion not detected), 1 (emo-
tion detected), or 2 (unsure) to a sample of 150 tweets
(50 tweets from each type of a crisis event) selected
randomly from a subset of our data-set that includes
only directed messages (n=1,396,709 tweets), as the
directed messages are used to derive the communica-
tion network in the subsequent step. Upon annotating
the tweets, the raters reached a substantial inter-rater
agreement (Cohen Kappa 0.71) and after resolving
discrepancies between the two raters, we computed
the F-measure score for each emotion and achieved
0.84 for anger, 0.84 for joy, 0.73 for fear, 0.68 for
sadness, 0.67 for anticipation, 0.62 for disgust, 0.61
for trust, and 0.50 for surprise. The score for surprise
is influenced by the relatively low number of tweets in
which “surprise” is the dominant emotion as well as
the ambiguity of surprise which is neither a positive
nor a negative emotion and its interpretation highly
depends on the context of a tweet.
3. Construction of the Messaging Network. On
Twitter, each user can send a direct message to an-
other user via @screenname. Based on such @-
traces, we reconstructed a directed messaging (DM)
network for each event. We allow for the presence
of multiple edges (i.e., a user can send multiple mes-
sages to another user) and self-loops (i.e., a user can
mention him or herself in a tweet to bypass the char-
acter restriction imposed by Twitter). Moreover, we
label each edge according to the dominant emotion
conveyed in the corresponding message.
The resulting emotion-annotated networks already
show first differences with respect to their global net-
work properties. For example, the networks repre-
senting anger-, fear-, and anticipation-exchange have
a comparatively large number of connected compo-
nents, compared to disgust- and surprise-exchange
networks (see Table 2). We also found that the aver-
age messaging rate per user (expressed as an average
node degree) assumes it’s highest value in the anger-
exchange network (degree
anger
= 1.70) and it’s low-
est value in the joy- (degree
joy
= 1.42) and sadness-
exchange (degree
sadness
= 1.39) networks.
4. Construction of a Multiplex Network. Next,
we derived one multiplex network for each day of
the data extraction period, separately for each event.
Each daily multiplex network consists of eight layers,
and each of these layers represents one of the eight
basic emotions. Moreover, in order to gain more in-
sight concerning the interlayer dependencies, we do
not only consider individual emotion layers (see Fig-
ure 2a) but also various derived layers. These de-
rived layers are: 1) a negative layer which includes
the edges found on the four negative emotion layers
(anger, fear, disgust, and sadness), 2) a positive layer
which includes the edges found on the three positive
emotion layers (joy, anticipation, and trust) (see Fig-
ure 2b)
2
. In addition, we derived a valence interlayer
which captures the vertices that are active on both de-
rived valence-specific layers (positive layer and neg-
ative layer) as well as those of their adjacent vertices
which are also active on the two derived valence lay-
ers (as shown in Figure 2c). Finally, we also aggre-
gated all positive- and negative-emotion layers as well
as surprise to derive the aggregated network (Figure
2d) for each day.
2
Note that “surprise” can be associated to positive as
well as negative emotions and is therefore treated sepa-
rately.
Structural Similarities of Emotion-exchange Networks: Evidence from 18 Crisis Events
27

Table 1: Basic information about the data-set used in our study: extraction period, number of tweets, vertices and edges of the
corresponding communication network, as well as hashtags and key-terms used for data extraction.
Extraction Period Tweets Vertices Edges Hashtags
NATURAL DISASTERS
Harvey hurricane 23.8.-11.9.2017 7,931,488 281,724 494,046 #Harveyhurricane, #HurricaneHarvey, hurricane harvey,
hurricane houston, hurricane texas, #HarveySOS, #Har-
veyRescue, #Houstonflood
Irma hurricane 4.9.-18.9.2017 5,421,054 189,969 348,089 #IrmaHurricane, #Irma2017, #hurricaneIrma
Mexico earthquake 7.9.-28.9.2017 1,713,618 45,882 54,796 #mexicoEarthquake, #earthquakemexico, earthquake mex-
ico
Maria hurricane 21.9.-4.10.2017 1,258,515 60,353 97,916 #hurricaneMaria, #mariaHurricane, hurricane maria
Costa Rica earthquake 12.11.-2.12.2017 15,492 601 512 earthquake costa rica, #earthquake costarica, earthquake
#costarica
Iran-Iraq earthquake 12.11.-2.12.2017 272,670 7,639 9,451 #earthquake iran, earthquake iran, #earthquakeinkurdistan,
#earthquakeiran, #earthquakeiraq, #iraniraqearthquake,
#kurdistanearthquake, #prayforkurdistan
Southern California
mudslide
7.1.-27.1.2018 168,303 8,609 12,719 california flood, #castorm, #Montecito, montecito, #mon-
tecitoflood, mudslide california, #mudslide california,
#santabarbara
Friederike windstorm 17.1.-28.1.2018 51,694 3,486 3,239 deutchland friederike, deutschland unwetter, ex-
tremeweather germany, extremeweather netherlands,
#friederike, germany hurricane, #orkanfriederike, wind-
storm netherlands
Lang’ata wildfire 28.1.-1.2.2018 11,113 695 915 #fireKijijini, #langatafire
TERROR ATTACKS AND SHOOTINGS
Tehama County shoot-
ing
14.11.-02.12.2017 123,659 3,884 4,140 california shooter, kevin jason neal, #KevinJasonNeal,
northern california shoot, #RanchoTehama, #RanchoTe-
hamaShooting
Trebes (France) shoot-
ing
23.03.-08.04.2018 142,255 4,199 4,414 #ArnaudBeltrame, #Beltrame, #Carcassonne, #French-
Hero, #redouanelakdim, #Trebes, Arnaud Beltrame, Re-
douane Lakdim, Trebes France
YouTube HQ shooting 03.4.-10.4.2018 648,501 34,611 47,262 #NasimNajafiAghdam, #PrayersForYoutube, #San-
BrunoShooting, #shootingYoutube#YoutubeHQShooting,
#YoutubeHQ Tragedy, #youtubeshooter, #youtubeshoot-
ing, #YoutubeStrong
M
¨
unster (Germany)
van attack
7.04.2018-14.04.2018 62,883 1,824 2,737 #MuensterAttack, #MuensterGermany, #Muensteramok-
fahrer, #Muensteramokfahrt, #MuensterAnschlag, #pray-
formuenster
Santa Fe school shoot-
ing
18.05.-25.05.2018 967,674 30,093 50,208 #DimitriosPagourtzis, #EnoughIsEnough, #SantaFe,
#SantaFeGunControl, #SantaFeGunControlNow,
#SantaFeGunViolence, #SantaFeHighschool,
#SantaFeShooting, #SantaFeStrong, #TexasShooting
RIOTS
Hamburg G20 summit 6.7-17.7.2017 653,568 25,429 58,768 #G20HH2017, #G20Hamburg, #G20HAM17, #G20HAM,
“#G20 #Hamburg”, “Hamburg riot”, “Hamburg Unruhe”
Charlottesville riot 10.8-16.8.2017 2,202,682 84,638 152,209 #Charlottesville, #UnitetheRight, “Charlottesville riot”
Catalonia riot 28.9-16.10.2017 1,640,829 27,432 54,266 #Catalonia, #CatalanReferendum, #RepublicofCatalonia,
“Catalonia violence”, “Catalonia protest”, “#1oct Catalo-
nia”
Philadelphia Super-
bowl riot
4.2-10.2.2018 22,073 1,164 1,022 #PhillyBurning, #Phillyriot, “#superbowl #Philadelphia”,
“#Philadelphia #riot”, and “Philadelphia riot”
5. Null Model Construction. A general procedure
for detecting network motifs is to determine the pres-
ence of specific subgraphs in the respective real-world
network and compare them to the subgraphs found in
a synthetically generated network that resembles the
real-world network (a so-called null model). For our
motif detection procedure, we generated null models
for each of the daily real-world multiplex networks
by using the stub-matching algorithm. This algorithm
uses the concept of stubs defined as “sown-off arrow
heads” (or dangling edges), which are rewired so that
the synthetically generated network preserves the de-
gree sequence of the corresponding real-world net-
work (Newman et al., 2001). In total, we generated
COMPLEXIS 2021 - 6th International Conference on Complexity, Future Information Systems and Risk
28

a) Individual layers b) Aggregated valence
layers
c) Valence interlayer d) Aggregated network
Figure 2: Individual emotion-annotated layers and the corresponding derived layers used in our analyses (green = positive
emotion layers, red = negative emotion layers, yellow = surprise).
Table 2: Mean value of global network properties: num-
ber of connected components (CC), node degree, network
diameter, eccentricity (ECC), and radius.
Layer CC Degree Diameter ECC Radius
Anger 225.01 1.70 1.89 3.42 0.44
Fear 222.01 1.58 1.70 2.94 0.45
Sadness 49.4 1.39 1.24 2.04 0.77
Disgust 39.6 1.44 1.20 2.21 0.83
Anticipation 219.01 1.51 1.73 2.82 0.57
Joy 95.8 1.42 1.30 2.06 0.72
Trust 119.99 1.57 1.56 2.76 0.64
Surprise 44.9 1.43 1.21 1.98 0.82
1000 synthetic networks for each of the 8 multiplex
layers and the 4 derived layers for each day of each
crisis event, resulting in 2,964,000 null models in to-
tal.
6. Motif Detection. In order to detect emotion-
exchange motifs (Ku
ˇ
sen and Strembeck, 2019; Ku
ˇ
sen
and Strembeck, 2020), we first enumerated all pos-
sible subgraphs of a pre-defined size k (in our case
k = 3)
3
by using the ESU subgraph enumeration algo-
rithm (Wernicke, 2006). Next, we performed an iso-
morphism test for the different subgraphs by apply-
ing the VF2 algorithm (Cordella et al., 2004). Since
isomorphism testing for each pair of subgraphs is re-
garded a general bottleneck when performing an exact
motif detection (in contrast to approaches that approx-
imate the number of motifs), we categorized the sub-
graphs according to their degree sequence to only test
the set of possible candidates (see Algorithm 1). Fi-
nally, we mapped each simplified emotion-exchange
motif
4
found in the input (real-world) networks to
3
We pre-defined the size k = 3 to capture the smallest
possible group of nodes, as dyads would be trivial for this
type of an analysis. In future work, it would be interesting
to set k to other values (> 3). However, given the computa-
tional costs of the current procedure (with k = 3), detecting
motifs of larger sizes is infeasible and would require sig-
nificant performance improvements of the motif detection
procedure.
4
Here, a “simplified emotion-exchange motif” disre-
gards self-loops and multi-edges.
one of the thirteen possible 3-node directed subgraph
classes and labeled them according to MAN-labeling
scheme (Davis and Leinhardt, 1972).
7. Discovery of Network Families. We followed the
approach suggested by (Milo et al., 2004) which uses
network motifs and their significance profiles to com-
pare networks of different sizes. To account for the
temporal aspect of emotion-exchange motifs, we de-
fined three time-frames for each crisis event: a) the
first two days of a crisis event (referred to as time-
frame 1), b) the subsequent days 3-6 (referred to as
time-frame 2), and c) the remaining days of a cri-
sis event (referred to as time-frame 3). For each pair
of emotion-exchange networks, we computed Spear-
man’s ρ coefficient while considering the temporal as-
pect. The results are presented for a p-value< 0.05.
In order to identify families of emotion-exchange net-
works, we used the complete linkage method for hier-
archical clustering.
4 RESULTS
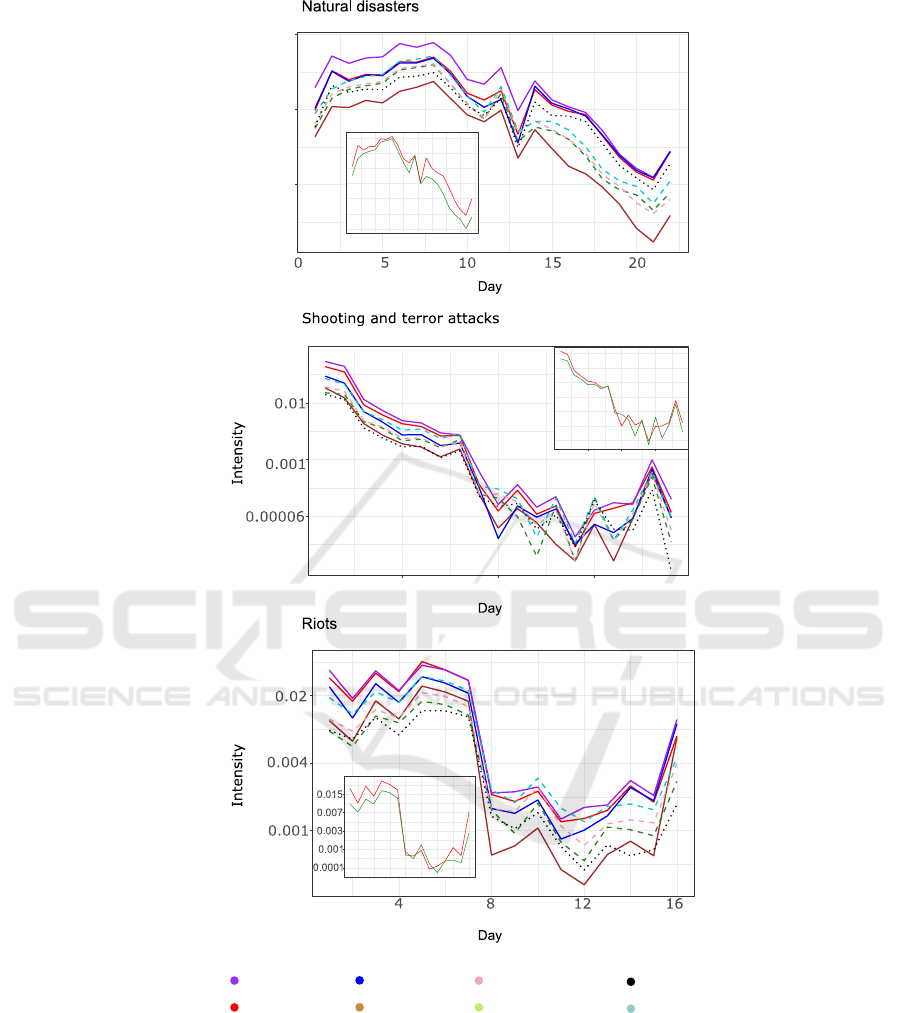
Emotional Intensities During Crisis Events. Our
data analysis indicates that three negative emotions
are universally dominant during the crisis events
studied in this paper. The average emotional in-
tensities (ei) of fear (ei
f ear
=0.24) and sadness
(ei
sadness
=0.14) dominate over the remaining emo-
tions during natural disasters, fear (ei
f ear
=0.22)
and anger (ei
anger
=0.18) during riots, while fear
(ei
f ear
=0.29) and anger (ei
anger
=0.19) dominate
during terror attacks and shootings. Our empirical
findings complement those of (Flynn, 1997), who
found that people universally express emotions ac-
cording to particular phases across different types of
crisis events, with shock and fear being initially ex-
pressed with a high intensity. Such initial emotions
are subsequently followed by a wide range of other
emotions, depending on the particularities of a crisis
event and one’s personal coping strategy. For exam-
Structural Similarities of Emotion-exchange Networks: Evidence from 18 Crisis Events
29

Algorithm 1: Motif detection.
1 Input: input network;
2 Output: list of motifs ;
3 Initialize: i = 0;
4 # ENUMERATE AND CLASSIFY SUBGRAPHS
5 def procedure: esu vf2(list layers)
6 foreach l in list layers do
7 subgraphs = esu(l)
8 foreach s in subgraphs do
9 subgraphs’ = subgraphs \ s
10 foreach s’ in subgraphs’ do
11 if vf2(s, s’) then
12 assign common isomorphism class
13 subgraphs’ = subgraphs’ \ s’
14 subgraphs = subgraphs \ s’
15 end
16 end
17 end
18 end
19 end procedure
20 # GENERATE LAYERS AND INTER-LAYERS
21 detect layers in input network
22 layer neg.add edges from(layer anger, layer sadness,
layer disgust, layer fear)
23 layer pos.add edges from(layer joy, layer anticipation,
layer trust)
24 foreach i in range(length(V(input network))) do
25 if v
i
∈ V(layer negative) & v
i
∈ V(layer positive) then
26 inter layer.add edges from(layer neg.edge containing(v
i
),
layer pos.edge containing(v
i
))
27 end
28 end
29 list layers = [layer anger, layer joy, ... , layer surprise, layer neg,
layer pos, interlayer, input network]
30 esu vf2(list layers)
31 # GENERATE NULL MODELS
32 while i < 1000 do
33 foreach l ∈ list layers do
34 null[l] = matching(l.in degree(), l.outdegree())
35 end
36 esu vf2(null)
37 i = i+1
38 end
ple, we observe an increase in the intensity of pos-
itive emotions during natural disasters when people
express well-wishing and prayers, as well as during
terror attacks and shootings when people express grat-
itude to the helpers and “heroes” (e.g., the local po-
lice), anger which is highly associated with blaming
mechanisms (Freyd, 2002) during riots, terror attacks
and shootings, and sadness which is communicated in
messages of compassion and condolences.
User Reactions to Emotional Content. Our ana-
lysis of user reactions to emotional content revealed
an increased retweeting behavior for fear-conveying
messages (mean(retweet
f ear
) = 403.84 ± 1078.04),
followed by messages of trust (mean(retweet
trust
) =
266.32 ± 475.94), as shown in Table 3. Anticipation-
conveying messages received on average the highest
number of likes (mean(likes
anticipation
= 6.9 ± 21.48),
while anger resulted in the highest tweeting rate
(mean(mssg.rate
anger
= 1.07 ± 0.19), closely fol-
lowed by fear (mean(mssg.rate
anger
= 1.07 ± 0.18).
These results indicate that basic emotions inspire re-
markably different user behavior, irrespective of their
affective valence.
Table 3: User reactions to emotional content. The retweet
and likes values are presented as mean values over each cri-
sis event and the extraction date, while the messaging rate
stands for the average number of daily messages sent by a
unique user during each crisis event.
Emotion Retweet Likes Mssg. rate
Anger 114.91 ± 213.86 5.58 ± 17.76 1.07 ± 0.19
Fear 403.84 ± 1078.04 1.68 ± 2.79 1.07 ± 0.18
Sadness 178.29 ± 346.81 1.26 ± 1.17 1.06 ± 0.16
Disgust 20.99 ± 38.3 0.95 ± 0.73 1.03 ± 0.11
Anticipation 176.19 ± 300.85 6.9 ± 21.48 1.01 ± 0.04
Joy 123.39 ± 273.27 3.34 ± 4.67 1.02 ± 0.07
Trust 266.32 ± 475.94 5.36 ± 8.18 1.04 ± 0.11
Surprise 65.36 ± 103.08 1.5 ± 1.37 1.02 ± 0.06
Emotion-exchange Motifs. In our data-set, the ex-
change of emotional messages during crisis events
is documented via 729,368 emotion-exchange motifs
that come in 1,480 shapes (isomorphism classes). For
presentation purposes, we only visualize the simpli-
fied motifs in Table 4.
Since Twitter’s main purpose is that of a mes-
sage broadcasting service, the message-receiver mo-
tif 021U (f=596258; 729.37 per 1000 motifs) and
the broadcasting motif 021D (f=84139; 115.36 per
1000 motifs) appear most frequently in each of the
18 crisis events (see Table 4). These two motifs
also count a relatively high number of edges (ec)
(ec
021U
=5.53±2.52; ec
021D
=4.97±1.53) and exhibit a
relatively high variability with respect to the edge dis-
tribution (var
021U
=366; var
021D
=286).
Families of Emotion-exchange Networks. Over the
course of time, two sets of networks emerged that
form two families of emotion-exchange networks.
While the number of families remains constant over
time, the membership of networks in one of the two
families is fluctuating over time. We name the fam-
ilies according to the initials of the core members
which include the networks whose membership to
a particular family is constant over all three time-
frames. The resulting families of emotion-exchange
networks are shown in Figure 5.
The first family, is called the JSSIA (joy-
sadness-surprise-interlayer-aggregated) family,
and includes sadness- and joy-exchange networks
COMPLEXIS 2021 - 6th International Conference on Complexity, Future Information Systems and Risk
30
Fear
Anger
Sadness
Disgust
Joy
Anticipation
Surprise
Trust
Intensity
5
10
15
0.004
0.0005
0.03
0.01
0.002
0.0005
0
5
10
15
20
4
8
12
16
5
10
15
0.02
0.001
0.0001
Figure 3: Relative emotion intensities during natural disasters, shootings and terror attacks, as well as riots, normalized for
the range [0-1]. Positive emotions are depicted via dashed lines, negative via solid lines, and surprise via a dashed line. The
inlay plots show the daily intensity of aggregated positive (trust, joy, anticipation; green line) and aggregated negative (anger,
fear, sadness, disgust; red line) emotions.
(time-frame 1: ρ
joy−sadness
= 0.63; time-frame
2: ρ
joy−sadness
= 0.67 (albeit not significant);
time-frame 3: ρ
joy−sadness
= 0.68), as well
as surprise (time-frame 1: ρ
joy−sur prise
= 0.74,
ρ
sadness−sur prise
= 0.73; time-frame 2: ρ
joy−sur prise
=
0.74, ρ
sadness−sur prise
= 0.67; time-frame 3:
ρ
joy−sur prise
= 0.45, ρ
sadness−sur prise
= 0.41).
Interlayer- and aggregated-emotion exchange net-
works share the membership with joy-, sadness-, and
surprise- in all time-frames, however with a larger
Structural Similarities of Emotion-exchange Networks: Evidence from 18 Crisis Events
31
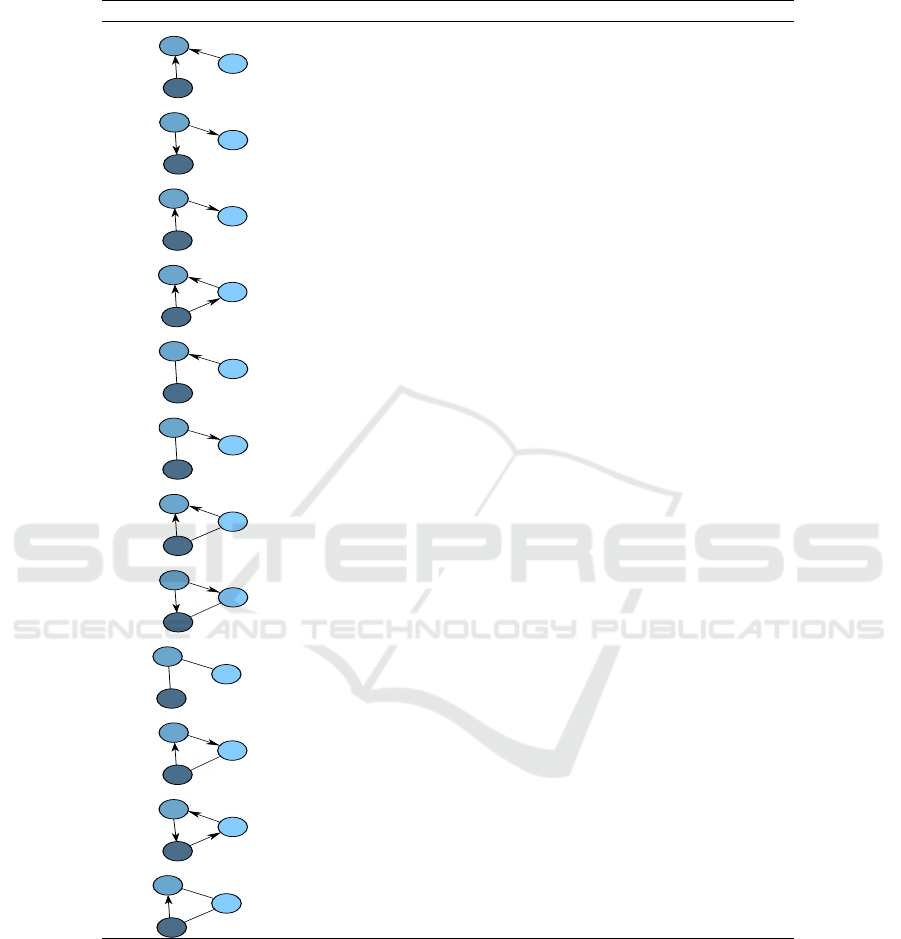
Table 4: Basic information about the MAN-labeled motifs identified in the data-set – motif frequency (absolute and averaged),
prevalence rate per 1000, motif variability (absolute and averaged), as well as the mean edge count and its average standard
deviation.
Shape Frequency X:1000 Variability Edge count
021U
B
C
A
596258
(35074.00±58538.54)
729.37 366 (54.35±73.97) 5.53±2.52
021D
B
C
A
84139
(4674.38±7756.13)
115.36 286 (40.94±56.56) 4.97±1.53
021C
B
C
A
25640
(1508.23±3303.97)
35.15 219 (26.12±50.12) 3.76±0.84
030T
B
C
A
13240
(778.82±1518.81)
18.15 338 (37.94±74.29) 4.09±1.07
111D
B
C
A
4621
(385.08±872.08)
6.33 99 (12.83±27.53) 3.88±0.86
111U
B
C
A
3785
(270.35±556.35)
5.18 75 (9.07±18.29) 3.54±0.56
120U
B
C
A
997 (76.69±124.78) 1.37 26 (4.46±5.97) 4.42±0.39
120D
B
C
A
572 (63.55±134.78) 0.78 43 (7.00±13.45) 4.51±0.62
201
B
C
A
60 (15.00±16.02) 0.08 13 (4.25±5.19) 4.45±0.58
120C
B
C
A
31 (15.50±16.26) 0.04 8 (5.50±3.53) 4.68±0.26
030C
B
C
A
19 (9.50±2.12) 0.03 5 (3.00±2.83) 3.64±0.9
210
B
C
A
6 (3.00±1.41) 0.008 2 (1.50±0.71) 5.12±0.18
distance from the other three networks.
The second family, is called the PAF (positive-
anticipation-fear) family. The three consistent mem-
bers of the PAF family show a greater dissimilarity
among each other as compared to the closely corre-
lated core (joy-sadness-surprise) of the JSSIA fam-
ily. In the PAF family, two core networks of the
same affective valence (positive- and anticipation-
exchange networks) show the highest structural simi-
larity (time-frame 1: ρ
positive−anticipation
= 0.74; time-
frame 2: ρ
positive−anticipation
= 0.43; time-frame 3:
ρ
positive−anticipation
= 0.49).
The two dominant emotions during crisis events
(anger and fear) show a high fluctuation with re-
spect to their family membership. While the ex-
change of fear is highly associated with the exchange
of positive emotions (see Figure 5) at the beginning
of a crisis event, the networks representing the ex-
COMPLEXIS 2021 - 6th International Conference on Complexity, Future Information Systems and Risk
32
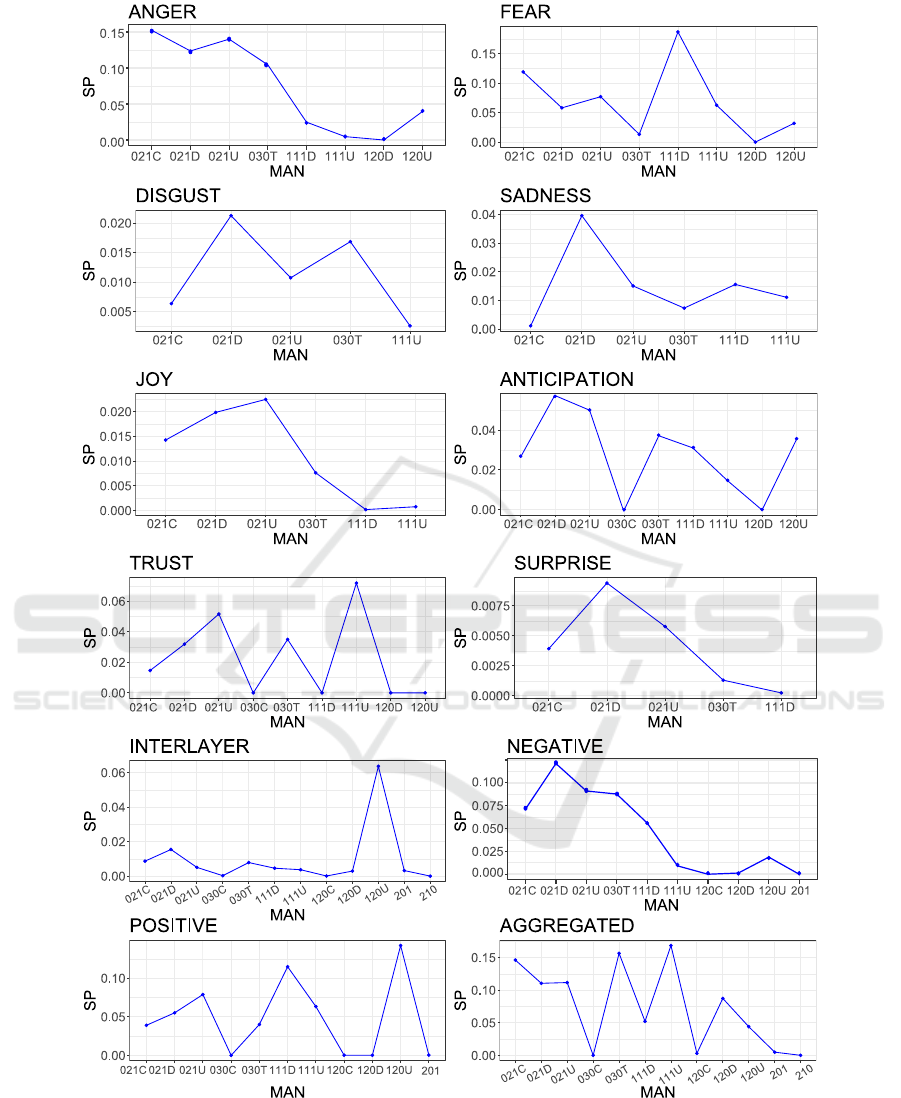
0.125
Figure 4: Significance profiles of the simplified motifs averaged over each day of each each crisis event.
change of fearful messages become structurally more
similar to the exchange of other negative emotions
(time-frame 2: ρ
negative− f ear
= 0.5), and anger (time-
frame 3: ρ
negative− f ear
= 0.62, ρ
anger− f ear
= 0.64)
over time. Anger initially highly resembles the aggre-
gated network (time-frame 1 ρ
anger−aggregated
= 0.53)
and eventually becomes more similar to the exchange
of fear (see time-frame 3 in Figure 5).
Structural Similarities of Emotion-exchange Networks: Evidence from 18 Crisis Events
33
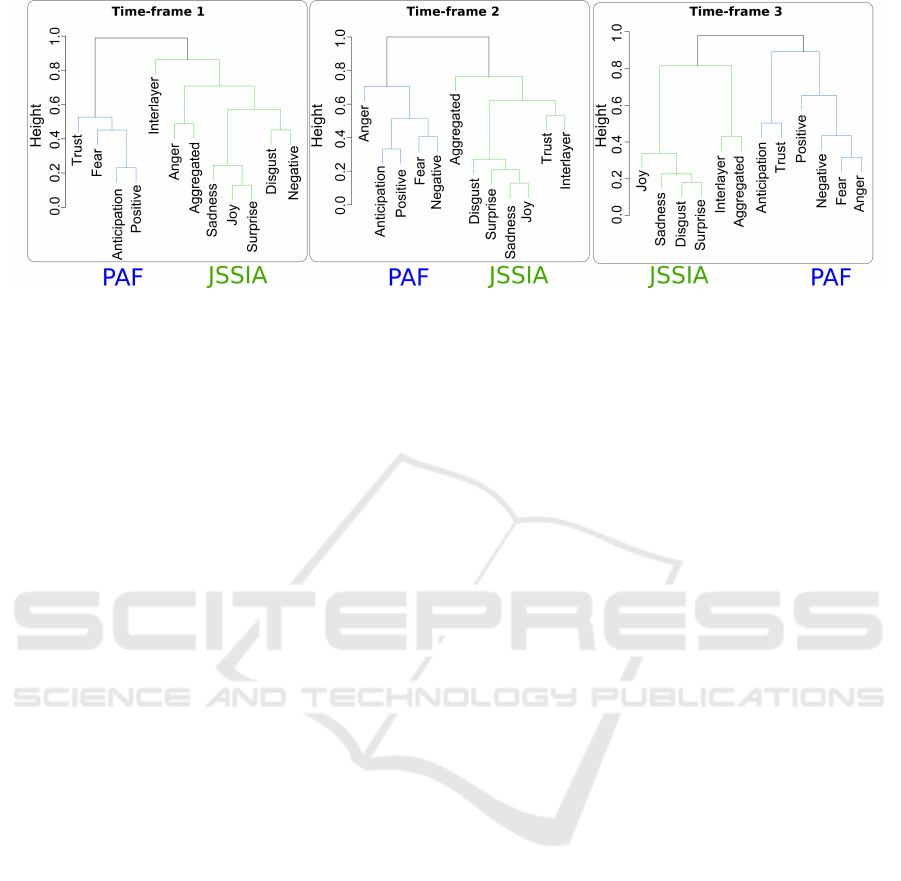
Figure 5: Hierarchical clustering of emotion-exchange networks.
5 DISCUSSION
Our results clearly indicate differences between the
communication networks representing the eight ba-
sic emotions. We found that the eight emotions not
only inspire different user reactions/behavior during
crisis events, but that they are also different from a
structural point of view. Such an effect on the un-
derlying structure of Twitter’s direct messaging net-
work can be attributed to the functional role of emo-
tions. For example, as reported in previous studies,
fear is highly associated with an information seeking
and sharing behavior (Wollebaek et al., 2019) which
explains the high retweet rate of messages conveying
fear. This behavior is reflected in the underlying fear-
exchange motifs. Fear was characteristic for a high
significance of the message receiver motif (111D) that
involves a mutual edge (i.e., it involves a discussion
between a pair of users). Another example is the ex-
pression of anger which structurally differs from fear
and does not persistently share the same family with
fear. Intense feelings of anger experienced during cri-
sis events are highly associated with blaming mecha-
nisms. According to (Freyd, 2002), people regularly
search for culprits who are to blame for a terror attack,
riots, or for the lack of help in the aftermath of natu-
ral disasters. In this context, we found that anger is
representative for a heated message-sending behavior
and is characteristic for message chains (021C) and
message receiver (021U) motif shapes.
Interestingly, message-exchanges representing joy
and sadness, which belong to two distinct affective
valence categories, show the highest structural simi-
larity compared to all other pairs of networks. A pos-
sible explanation for such a similarity lies in the ex-
pression of sympathy and condolences that both emo-
tions are associated with. According to (Batson et al.,
1991), messages of sympathy and condolences can be
seen as a form of altruism. We found that such al-
truistic messages are associated with the expression
of gratitude to individuals perceived as “heroes” (e.g.,
those who sacrificed themselves to save the lives of
others) or those who got injured, lost their homes, or
whose family members were victims of a crisis event.
This is reflected in the underlying motifs 021D (a
broadcaster motif) and 021U (a message receiver mo-
tif) rather than the discussion motifs (those that con-
vey mutual edges). Since the exchange of sadness and
joy is represented by the same set of motifs, we also
observed a more tightly correlated core of the JSSIA
family as compared to the PAF family.
6 CONCLUSION
In this paper, we studied the intensity of basic emo-
tions that were communicated during eighteen differ-
ent crisis events, including terror attacks, shootings,
riots, and various types of natural disasters. Prior
studies highlighted the general expression of fear and
shock as a crisis event happens, as well as the emer-
gence of a range of other emotions in the aftermath of
a crisis event. Based on a data-set counting over 23
million messages, our study empirically shows that
these findings also apply to message-exchanges hap-
pening in online social networks.
Moreover, we found that considerable differences
exist how emotions belonging to the same affec-
tive valence influence OSN communication behav-
ior. This is reflected in the user reactions to emo-
tional content. For example, while fear was highly
associated with increased retweeting behavior, anger
showed the highest messaging rate, and messages
conveying anticipation received most likes.
However, the main contribution of this paper is
an analysis of statistically significant network struc-
tures that are representative for the exchange of
COMPLEXIS 2021 - 6th International Conference on Complexity, Future Information Systems and Risk
34

the eight basic emotions. To this end, we used
the novel concept of emotion-exchange motifs and
found that the exchange of sadness and joy are
structurally more similar than the exchange of any
other pair of emotions. Moreover, after cluster-
ing the emotion-exchange networks, two families of
networks emerged whose membership highly fluc-
tuates over time. According to their core mem-
bers we named the two families JSSIA (joy-sadness-
surprise-interlayer-aggregated) and PAF (positive-
anticipation-fear), whereby JSSIA has a more tightly
correlated core compared to PAF.
In our future work, we plan to further examine
the emergence of temporal emotion-exchange motifs
to provide an even more fine-grained analysis of the
underlying properties of human communication net-
works.
REFERENCES
Abdul-Mageed, M. and Ungar, L. (2017). Emonet: Fine-
grained emotion detection with gated recurrent neural
networks. In Proceedings of the 55th Annual Meeting
of the Association for Computational Linguistics (Vol-
ume 1: Long Papers), pages 718–728. Association for
Computational Linguistics.
Batson, C. D., Batson, J. G., Slingsby, J. K., Harrell, K. L.,
Peekna, H. M., and Todd, R. M. (1991). Empathic
joy and the empathy-altruism hypothesis. Journal of
personality and social psychology, 61(3):413–426.
Berger, J. (2011). Arousal increases social transmission of
information. Psychological Science, 22(7):891––893.
Cordella, L. P., Foggia, P., Sansone, C., and Vento, M.
(2004). A (sub)graph isomorphism algorithm for
matching large graphs. IEEE Transactions on Pat-
tern Analysis and Machine Intelligence, 26(10):1367–
1372.
Davis, J. A. and Leinhardt, S. (1972). The Structure
of Positive Interpersonal Relations in Small Groups.
Houghton Mifflin, Boston.
Flynn, B. (1997). Psychological aspects of disasters. Renal
Failure, 19(5):611–620.
Fraustino, J. D., Brooke, L., and Yan, J. (2012). Social
Media Use during Disasters: A Review of the Knowl-
edge Base and Gaps. Final Report to Human Fac-
tors/Behavioral Sciences Division, Science and Tech-
nology Directorate, U.S. Department of Homeland
Security, College Park, MD: START.
Freyd, J. J. (2002). In the wake of terrorist attack, hatred
may mask fear. Analysis of Social issues and public
policy, 2(1):5–8.
Gera, R., Alonso, L., and Crawford, B. (2018). Identify-
ing network structure similarity using spectral graph
theory. Applied Network Science, 3(2).
Hansen, L. K., Arvidsson, A., Nielsen, F. A., Colleoni, E.,
and Etter, M. (2011). Good friends, bad news - af-
fect and virality in twitter. In Park, J. J., Yang, L. T.,
and Lee, C., editors, Future Information Technology,
pages 34–43, Berlin, Heidelberg. Springer Berlin Hei-
delberg.
Holyst, J. (2016). Cyberemotions: Collective Emotions
in Cyberspace. Understanding Complex Systems.
Springer International Publishing.
Kim, H., Lee, S., Cappella, J., Vera, L., and Emery, S.
(2013). Content characteristics driving the diffusion
of antismoking messages: Implications for cancer pre-
vention in the emerging public communication envi-
ronment. Journal of National cancer institute. Mono-
graphs, 47:182–187.
Klaise, J. and Johnson, S. (2017). The origin of motif fam-
ilies in food webs. Nature Scientific Reports.
Koutra, D., JT., V., and C., F. (2013). Deltacon: A prin-
cipled massive-graph similarity function. In Proceed-
ings of the 2013 SIAM International Conference on
Data Mining, pages 162–170.
Ku
ˇ
sen, E., Cascavilla, G., Figl, K., Conti, M., and Strem-
beck, M. (2017). Identifying emotions in social me-
dia: Comparison of word-emotion lexicons. In Pro-
ceedings of the 4th International Symposium on So-
cial Networks Analysis, Management and Security
(SNAMS) (co-located with IEEE FiCloud). IEEE.
Ku
ˇ
sen, E. and Strembeck, M. (2019). An Analysis
of Emotion-Exchange Motifs in Multiplex Networks
During Emergency Events. Applied Network Science,
4(8):1–33.
Ku
ˇ
sen, E. and Strembeck, M. (2020). Evacuate everyone
south of that line: Analyzing structural communica-
tion patterns during natural disasters. Journal of Com-
putational Social Science. DOI: 10.1007/s42001-020-
00092-7.
Masoudi-Nejad, A., Schreiber, F., and Kashani, Z. (2012).
Building blocks of biological networks: A review on
major network motif discovery algorithms. IET Syst
Biol., 6(5).
Milo, R., Itzkovitz, S., Kashtan, N., Levitt, R., Shen-Orr,
S., Ayzenshtat, I., Sheffer, M., and Alon, U. (2004).
Superfamilies of evolved and designed networks. Sci-
ence, 303(5663):1538–1542.
Milo, R., Shen-Orr, S., Itzkovitz, S., Kashtan, N.,
Chklovskii, D., and Alon, U. (2002). Network motifs:
Simple building blocks of complex networks. Science,
298(5594):824–827.
Mohammad, S. M. and Turney, P. D. (2013). Crowdsourc-
ing a word-emotion association lexicon. Computa-
tional Intelligence, 29(3):436–465.
Newman, M. E. J., Strogatz, S. H., and Watts, D. J. (2001).
Random graphs with arbitrary degree distributions
and their applications. Phys. Rev. E, 64(2):026118.
Rim
´
e, B., Mesquita, B., Boca, S., and Philippot, P. (1991).
Beyond the emotional event: Six studies on the so-
cial sharing of emotion. Cognition and Emotion, 5(5-
6):435–465.
Scheve, Christian Salmella, M. (2014). Collective emotions.
Oxford University Press, Oxford, United Kingdom, 1
edition.
Shi, Y. and Macy, M. (2016). Measuring structural similar-
ity in large online networks. Social Science Research,
Structural Similarities of Emotion-exchange Networks: Evidence from 18 Crisis Events
35

59:97 – 106. Special issue on Big Data in the Social
Sciences.
Sun, X. and Wandelt, S. (2014). Network similarity analysis
of air navigation route systems. Transportation Re-
search Part E: Logistics and Transportation Review,
70:416 – 434.
Topirceanu, A., Duma, A., and Udrescu, M. (2016). Uncov-
ering the fingerprint of online social networks using a
network motif based approach. Computer Communi-
cations, 73:167 – 175.
Tsugawa, S. and Ohsaki, H. (2015). Negative messages
spread rapidly and widely on social media. In Pro-
ceedings of the ACM on Conference on Online So-
cial Networks, COSN, pages 151–160, New York, NY,
USA. ACM.
von Scheve, C. and Ismer, S. (2013). Towards a theory of
collective emotions. Emotion Review, 5(4):406–413.
Wernicke, S. (2006). Efficient detection of network mo-
tifs. IEEE/ACM Transactions on Computational Biol-
ogy and Bioinformatics, 3(4):347–359.
Wollebaek, D., Karlsen, R., Steen-Johnsen, K., and Enjol-
ras, B. (2019). Anger, fear, and echo chambers: The
emotional basis for online behavior. Social Media +
Society, 5(2):2056305119829859.
COMPLEXIS 2021 - 6th International Conference on Complexity, Future Information Systems and Risk
36
