
Analysing Student Engagement in an Online Course in the Context of
Hybrid Learning Environment: An Empirical Study
Michael Wahiu
1
, Fahima Djelil
2 a
, Laurent Brisson
2 b
, Jean-Marie Gilliot
2 c
and Antoine Beugnard
2 d
1
Computer Science Department, Dedan Kimathi University of Technology, Dedan Kimathi, Kenya
2
IMT Atlantique, Lab-STICC, UMR CNRS 6285, F-29238 Brest, France
Keywords:
Online Course, Hybrid Learning Environment, Student Engagement, Learning Analytics, Course Design.
Abstract:
This paper aims to understand student learning engagement in an online course. We describe an empirical
study we conducted to investigate learner profiles when interacting with learning content. This study is based
on data records about student online navigation and took place in the context of a hybrid environment. The
obtained results showed that students mostly select assessment activities and visit the online course content
without engaging deeply in the learning activities. This leads us to conclude on the role of assessment to
motivate and engage students and on the importance of thinking out the design of the hybrid course. Finally,
future work is motivated to study how to provide effective interactions with course content and how this can
impact learning engagement and course design.
1 INTRODUCTION
Presently, in higher education, online learning contin-
ues to have a rapid expansion, since it removes the
space and time restrictions for learning facilitation.
As a matter of fact, formalized online learning pro-
cesses are not time-bound, and supports a blend of
both the class-paced and self-paced learning interac-
tions (Kumar et al., 2011; Means et al., 2014). In ad-
dition, advances in Learning Analytics have become
resourceful for measuring and reporting of data about
learner records (Siemens et al., 2011). In particular,
Learning Analytics offers many opportunities for on-
line learning analysis (Xiong and Suen, 2018), and go
beyond statistical description of learning data (Chatti
et al., 2012). Reporting data about students learn-
ing activities and describing how students navigate in
their courses, help to obtain direct insights from on-
line activities (Lockyer et al., 2013). This helps to
acquire objective measurements of learning such as
determining whether students progress well and ac-
quire the desired learning outcomes, or whether they
are at risk of failure or need adaptive scaffolds.
a
https://orcid.org/0000-0001-8449-2062
b
https://orcid.org/0000-0002-5309-2688
c
https://orcid.org/0000-0003-4569-3552
d
https://orcid.org/0000-0002-3096-237X
As variations of blended learning evolve, educators
need developing better understanding of how effective
interaction with course content impacts engagement
and learning (Murray et al., 2013). In the context of
hybrid learning, understanding how students navigate
in an online course when it takes place in a hybrid
context implies to examine online learning navigation
of a large number of students. This can lead to provide
educators synthetic observations of how their students
interact with online resources.
In this paper, our objective is to understand stu-
dents learning engagement in an online course, based
on their data records. Our main research questions are
the following:
1. What are the indicators of student engagement
that can be measured from online learning activi-
ties?
2. What are the student profiles that can be obtained
from these indicators, and that can lead to some
insights on student engagement?
To this end, based on the literature, we first defined
some indicators that are relevant to examine student
online navigation, and that may impact learning en-
gagement. We applied Principal Component Analysis
(PCA) and an Agglomerative Hierarchical Clustering
(AHC) to determine typical learners’ behaviours on
data learning records.
156
Wahiu, M., Djelil, F., Brisson, L., Gilliot, J. and Beugnard, A.
Analysing Student Engagement in an Online Course in the Context of Hybrid Learning Environment: An Empirical Study.
DOI: 10.5220/0010396901560162
In Proceedings of the 13th International Conference on Computer Supported Education (CSEDU 2021) - Volume 2, pages 156-162
ISBN: 978-989-758-502-9
Copyright
c
2021 by SCITEPRESS – Science and Technology Publications, Lda. All rights reserved

The present paper is organised as follows. Section
2 gives a description of some online learning engage-
ment indicators. Section 3 describes the methodology
employed, including details of the context, as well as
data collection and analysis. Results are summarised
and discussed in section 4. Finally, conclusions and
future research directions are drawn in section 5.
2 LEARNING ENGAGEMENT
INDICATORS
Within Learning Management Systems (LMS), such
as Moodle (Rice, 2015), online learning is charac-
terized by different kinds of educational interactions
(Horton, 2011), including interactions with learn-
ing content and interactions between students (Bates
et al., 2018).
From various education researches, student learn-
ing engagement is related to both a state of the mind
and behavioral actions (Mosher and MacGowan,
1985; Skinner et al., 1990; Skinner and Belmont,
1993). Agreeably to a common meaning, authors like
(Carini et al., 2006; Robinson and Hullinger, 2008;
Kuh, 2009; Lewis et al., 2011; Gunuc and Kuzu,
2015) posit that, student engagement should encom-
pass multidimensional factors, parts of cognitive and
behavioral reactions towards educational activities.
Based on that, we explore some possible indica-
tors of student learning engagement relaying on the
literature:
• Kind of Resources: the kind and the diversity of
resources the student choose in a given course,
that can have a direct impact on his motivation to
learning (Coates, 2006; Lei, 2010; Means et al.,
2014). Depending on the kind of resource the
learning activity may consist of reading, watch-
ing, listening, exploring, solving problems, an-
swering questions or discussing with peers.
• Kind of Tasks: this may indicate the activeness or
the passiveness of the student participation (Kuh,
2009; Ma et al., 2015; Rieber, 2017), that can
influence knowledge replication and recall (Lea
et al., 2003; Coffrin et al., 2014; Xing et al.,
2015). For example, post-tasks and submit-tasks
reveal a more active participation than view-tasks.
This also includes the collaborative and individual
nature of the tasks.
• Interaction Intensity: this may indicate how inter-
ested and determined is the student by the learn-
ing activities (You, 2016; Xiong and Suen, 2018).
This is in relation to the number of achieved tasks
(Henrie et al., 2015), or even the number of in-
teraction attempts (You, 2016; Xiong and Suen,
2018). For example, the number of clicks to
browse a page, play a video or post in a forum.
3 METHOD
Our work aims to examine how students engage in an
online learning course. We first consider the student
interactions within the same time baseline, then we
vectorize the student interactions with the learning re-
sources. To determine typical learners’ behaviors, and
the set of event indicators underlying similarities and
differences between learners, we conducted a Princi-
pal Component Analysis (PCA) and an Agglomera-
tive Hierarchical Clustering (AHC).
3.1 Experiment Context
The study took place in a hybrid course using the
Moodle platform (May-August 2019), involving 133
undergraduate students at Dedan Kemathi University
of Technology in Kenya. The course was about Com-
puter Information Technology (CIT), which aims stu-
dents to develop a broad understanding in all areas
of Information Technology, including Operating Sys-
tems and Database Management Systems. The on-
line course complements in-classroom activities. It
is organized as a sequence of learning activities pro-
vided in the Moodle platform, comprising 2 forums,
9 quizzes (each quiz is about a classroom lesson), 4
wikis, 1 assignment allowing students to submit work
to their teacher. It offers additional resources includ-
ing e-books, lecture files, HTML pages, URL and
workshop resources. The hybrid course also includes
other offline tests and a classroom final exam.
3.2 Data Collection
Data records were stored about learning activities
characterized by student interactions with online
learning resources. Data about a learning activity is
characterized by a sequence of events produced by
the LMS, each time a student interacts with a learn-
ing resource along a period of time. For example, a
learning activity for a student can be a participation to
a forum at a certain time. Here, the student interacts
with a forum resource, and each time he/she views or
posts a message, this information is stored as an event
into the raw data.
After preliminary data cleaning and filtering, we
obtained a data file containing timestamped task-
based learning activities records.
Analysing Student Engagement in an Online Course in the Context of Hybrid Learning Environment: An Empirical Study
157

3.3 Data Analysis
3.3.1 Time Discretization
To facilitate analysis of student learning activities and
allow comprehensive comparisons, we first set an ob-
servation period to one day, to get observations with
the same time baseline. We split the course time-
line into periods of equal lengths, by performing a
splitting of data, into sampled records or segmented
chunks of daily learning activity observations.
3.3.2 Student Interaction Vectorization
In order to be computed, the data obtained from the
previous step of time discretization, is structured us-
ing vectors. Each vector stores for each student, dur-
ing a period of time information about series of events
of learning activities including the resource name, its
category (group, individual, assessment), the kind of
the resulting tasks (active, passive), and the state of
the learning activity (began, ongoing, completed).
3.3.3 Data Aggregation
To prepare the data analysis, we built a new data file
of aggregated data. For each student, over a period of
time, we stored the values of different analysis vari-
ables (Table 1). PCA was conducted with this aggre-
gated data after their standardization.
Table 1: Aggregated data (the PCA variables).
Analysis variable Signification
Indiv-Act count of individual activities
Group-Act count of group activities
Asses-Act count of assessment activities
Total-Act count of total activities
Activ-Task percentage of active tasks
Divers diversity of resources
(Gini Index)
3.3.4 Data Standardization
Since our ultimate goal is to achieve clustering of stu-
dent profiles on the basis of learning activity indica-
tors having varying units, it is ideally suited to per-
form a data standardization on aggregated data com-
puted from the student’s interaction vectors. Stan-
dardization is a scaling technique where the data val-
ues are centered around the mean with a unit standard
deviation. The result is that the mean of the attributes
becomes zero and the resultant distribution has a unit
standard deviation.
3.3.5 Principal Component Analysis
The key objective with PCA is to reduce the dimen-
sionality of a dataset with a large number of interre-
lated variables, while retaining as much as possible
the variation present in the dataset (Jolliffe, 2003).
This reduction is achieved by converting the initial
variables into a new set of uncorrelated variables,
called principal components. Principal components
are ordered so that the first few retain most of the
variation present in the dataset. The principal com-
ponents are also called PCA axes or factors. The
PCA returns the principal components with their cor-
responding eigenvalues, reflecting the variability of
the reduced initial data. Ideally, a small number of
factors with high eigenvalues are retained to ensure
good visual representations of data. Correlation refers
to the degree of dependence between two variables. In
our case, it is measured according to Pearson’s corre-
lation coefficient, giving a value between -1 and +1
inclusive. The closer the coefficient is to -1 or +1, the
greater is the correlation between the variables.
3.3.6 Agglomerative Hierarchical Clustering
In order to achieve our ultimate goal, which is to iden-
tify groups of learners, we conducted an AHC on the
new observations’ coordinates in the subspace con-
taining the chosen PCA factors. AHC works from the
dissimilarities between the observations to be grouped
together (Day and Edelsbrunner, 1984). It is an it-
erative classification method whose process is based
on calculating the dissimilarity between observations.
Two observations are clustered together when that
minimizes a given agglomeration criterion, thus cre-
ating a class comprising these two objects. Then the
dissimilarity between this class and other observa-
tions is calculated using the agglomeration criterion.
This process continues until all the observations have
been clustered.
4 RESULTS AND DISCUSSION
4.1 Characterizing Student Interactions
The PCA returned 6 factors estimated from the aggre-
gated data listed beforehand, after undergoing stan-
dardization (Table 2). The first three eigenvalues rep-
resent 72.3% of the initial variability of the data (cu-
mulative variability). We retained the first three fac-
tors and ignored the last ones that have low eigenval-
ues.
CSEDU 2021 - 13th International Conference on Computer Supported Education
158

Table 2: Principal components (factors) returned by the
PCA, with their corresponding eigenvalue, eigenvalue vari-
ability and cumulative variability.
Factors Eigenvalue Variability Cumulative
(%) (%)
F1 1.97 32.8 32.8
F2 1.37 22.8 55.6
F3 1 16.7 72.3
F4 0.97 16.1 88.4
F5 0.68 11.6 100
F6 0 0 100
Table 3 shows the set of the initial variables defining
the first three retained factors. Variables that scored
high on the factor F1 are Asses-Act (count of assess-
ment activities) and Total-Act (count of total activi-
ties), with respective correlation values of 0.64 and
0.66. We can observe that these two correlation values
are very close. This can be interpreted by the fact that
students who contributed to defining F1, complete a
large number of their activities by accessing assess-
ment resources such as quizzes.
F2 is positively correlated with the variables
Indiv-Act (count of individual activities), and Divers
(diversity of resources) respectively with the values
0.66 and 0.44. This can be explained by the fact that
the course incorporates various individual resources
as offered by the platform Moodle, and so students
choose varied individual activities.
F3 is significantly correlated with the variable
Group-Act (count of group activities) and negatively
correlated with the variable Divers. Correlation val-
ues between these variables and F3 are respectively
0.80 and -0.49. These results reflect a lack of diver-
sity of group activities used in the course. Conse-
quently, students choosing collaborative activities are
those who access to resources that are not diverse.
Based on these statistical analysis, we can con-
clude that it is possible to distinguish students by: 1)
a large number of assessment activities compared to
other activities; 2) the number of individual activities
with a relatively significant diversity of resources they
access to; and contrarily 3) the number of group ac-
tivities with a relatively non-significant diversity of
resources they access to.
4.2 Characterizing Student Profiles
The AHC was conducted on the new observations’
coordinates in the 3-dimensional space with respect to
the chosen factors F1, F2, and F3. The algorithm re-
turned four homogeneous clusters showing, for each
student within a time period, the cluster he/she be-
longs to (Figure 1). Table 4 complements the visual
Table 3: Correlations between the PCA variables and the
first three factors. Refer to table 1 for variable names expla-
nation.
PCA Variable F1 F2 F3
Indiv-Act 0.01 0.66 -0.25
Group-Act 0.16 0.40 0.80
Asses-Act 0.64 -0.12 -0.22
Total-Act 0.66 0.24 0.05
Activ-Task 0.36 -0.36 -0.06
Divers -0.03 0.44 -0.49
result by giving the size of each cluster as well as
some descriptive statistics related to the analysis vari-
ables that define significantly the retained factors F1,
F2 and F3.
We can observe that the largest number of obser-
vations (979) consists of students (by time period)
whose assessment activities account for almost activ-
ities totaled in the online platform. In fact, the mean
value of the variable Asses-Act is the highest one
compared to the other clusters. Moreover, in this clus-
ter, the variables Asses-Act and Total-Act have very
close values (Table 4). We can also observe from Fig-
ure 1, that one part of this cluster points (triangular red
symbols) are plotted along the F1 axis with relatively
high coordinates values (these points contributed sig-
nificantly to the definition of F1 axis - we already ob-
served that F1 axis is mostly defined by the two vari-
ables Asses-Act and Total-Act). This cluster allows
qualifying students by time period with assessment-
oriented learning profiles.
A second cluster defines group-oriented learning
profiles (74 observations). In fact, we can observe
that this cluster is mainly characterized by the largest
mean number of group activities and the largest mean
number of total activities. Students belonging to this
cluster register also a significant average number of
assessment activities. In fact, this cluster points are
plotted along the axis F1 (blue rectangular symbols in
Figure 1), with relatively high coordinates values.
A third cluster allows defining individual-oriented
learning profiles (92 observations). The main char-
acteristic of this cluster is a large average number of
individual activities, as well as the most significant
diversity of resources accessed by students. This may
be explained by the diversity of individual resources
inherent to the Moodle Plateform. We can observe
in Figure 1 that this cluster points are mostly plotted
along F2 axis with relatively high coordinates values
(magenta diamond symbols). We already observed
that F2 axis is defined by the number of individual
activities the student performs and the diversity of re-
sources.
The last cluster is the second-largest one (559 ob-
Analysing Student Engagement in an Online Course in the Context of Hybrid Learning Environment: An Empirical Study
159
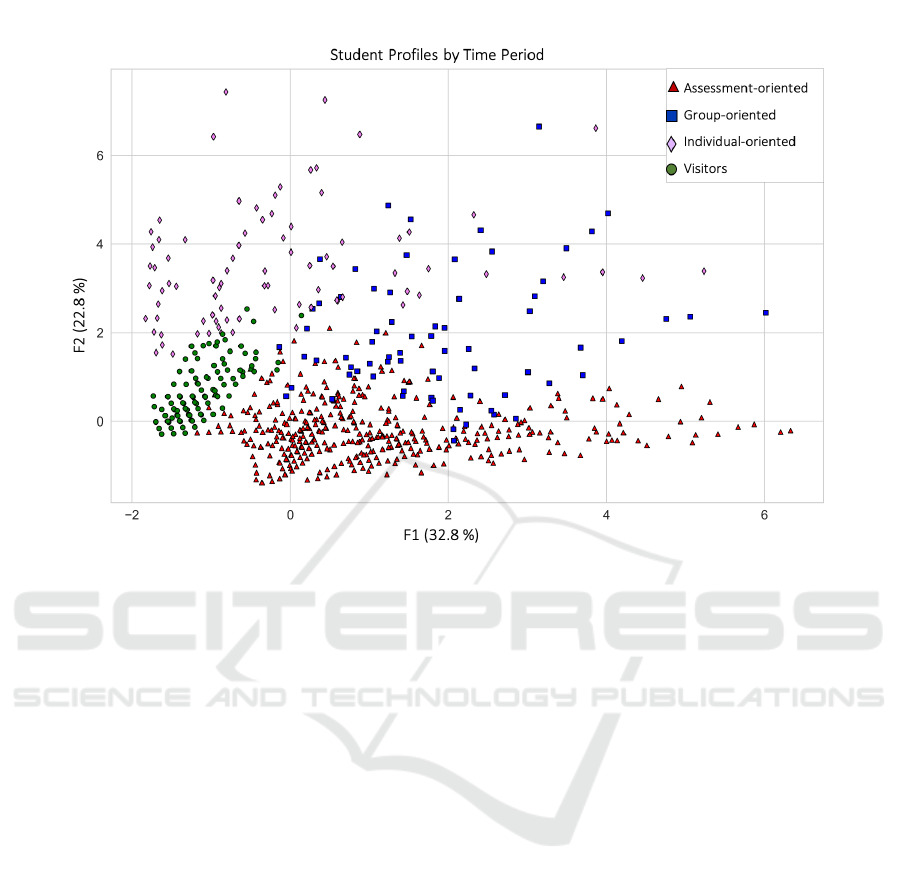
Figure 1: Map showing the partition of students by time period into clusters defining four different profiles.
servations). It is characterized by low average val-
ues on all the variables compared to other clusters.
We can observe in Figure 1 that these cluster points
are plotted in the positive 2D-plane F1-F2 around the
origin, having coordinate values close to zero (green
circle symbols). This allows defining students that ac-
cess to all the learning activities and resources without
really achieving tasks and being active. They rather
access to the different learning content to only visit
and view the course resources. They can be qualified
by visitors or content viewers.
4.3 Understanding Student Online
Engagement
From these observations we can conclude that stu-
dents mostly select assessment resources, compared
to collaborative or individual ones. We also observed
that most of the time, students visit the course content
without engaging deep interactions with the provided
tasks.
This may be explained by the context of the study,
which is a hybrid environment that is also offering
social presence and face-to-face dialogues between
the teacher and the students. In fact, students may
consider that the classroom learning situation is good
enough for acquiring knowledge, and decide to keep
asynchronous online interactions producing assign-
ments and complete online quizzes.
Students are used to looking for a great documen-
tation from the net and may discard the ones recom-
mended by teachers. They may visit the online course
content out of curiosity and decide that the content re-
ceived in presence would be enough for their learning.
Students also meet in a physical classroom and
communicate directly with each other without resort-
ing to a communication tool provided inside the on-
line course. They may decide to perform group activ-
ities in presence and use other means of online com-
munication. This may explain the low intensity of on-
line group activities that was measured.
5 CONCLUSION AND FUTURE
DIRECTIONS
In this work we have described our methodology and
the results of a study that we conducted to investigate
learners’ profiles when interacting with online course
content. We processed a PCA and an AHC in the anal-
ysis of data, leading to the characterization of differ-
ent profiles of students.
Regarding the first research question ”what are the
indicators of student engagement that can be mea-
sured from online learning activities?” Insights from
CSEDU 2021 - 13th International Conference on Computer Supported Education
160
Table 4: Cluster size and descriptive statistics related to the variables defining the first three factors. Refer to table 1 for the
PCA variable names explanation.
Assessment Group Individual Visitors
Cluster size 979 74 92 559
Asses-Act
Mean 11.83 8.65 4.66 0.83
std 8.04 8.86 7.75 0.94
Total-Act
Mean 11.88 24.3 13.67 1.87
std 8.17 9.13 10.1 2.53
Indiv-Act
Mean 0.4 1.65 8.62 0.81
std 1.11 2.78 5.29 1.45
Group-Act
Mean 0.61 14.5 1.48 1.24
std 1.46 5.96 2.59 2.05
Divers
Mean 0.22 0.57 10.25 0.04
std 1.8 2.74 11.49 0.43
the literature helped us to define aggregated data that
served as inputs to the PCA. Five variables among
six allowed to characterize students interactions with
online content. This led to indicators of engagement
that are dependent on the experiment context. In fact,
these indicators may be different in another context.
Regarding the second research question, ”what are the
student profiles that can be obtained from these indi-
cators, and that can lead to some insights on student
engagement ? ” The AHC performed on the PCA re-
sults allowed for the description of four distinct pro-
files. These profiles are relative to a hybrid context
but may be similar to other contexts such as classroom
environments.
In fact, the obtained results showed that students
are very selective in their interaction with learning
content. They mostly select assessment activities, and
visit the learning content without accessing deeply
into it. Accessing to individual and group activities
is of minimal interest compared to assessment activi-
ties and visiting content.
These results show that assessment activities are
of a high interest for students, and this is much more
likely to engage them. Indeed, the literature argues
on the important role of assessment in learning. For
example, (Earl, 2012) describes assessment as a moti-
vator for learning. Assessment can motivate students
by stimulating their intrinsic interest, and reinforcing
the idea that they have control over learning. This can
build confidence in students who need to take risks.
Assessment can be appealing to student imagination,
and provide the scaffolding the students need to suc-
ceed. While these observations relate to the class-
room environment, our study shows that it is also sim-
ilar to an online course in a hybrid context. More-
over, this study showed that the course needs to be
effectively designed to provide students with high en-
gaging and diverse activities. Improvements need to
be done to allow richer interactions with the learning
content provided to students.
From this study we can conclude that assessment
is a kind of activity which is much more likely to en-
gage students. More importantly, simply making di-
verse resources available to students is not enough to
engage students in learning. The process of designing
effective online, face-to-face or blended learning en-
vironments needs to be more carefully thought out.
More particularly, as the use of online courses in-
creases and blended learning opportunities grow, stu-
dent interaction with course content will play an im-
portant role in the teaching and learning process. De-
signing effective online courses and blended learn-
ing environments requires high-quality instructional
content, but also a good combination of face-to-face
courses with asynchronous online content, leading to
a coherent continuum between the two modalities.
We plan to define new experiments and explore
other methods to study the impact of student interac-
tions with online content on learning engagement in
hybrid or in face-to-face contexts. The implication on
course design should also be considered in future re-
search.
ACKNOWLEDGEMENTS
We would like to thank Campus France and The
French Embassy in Kenya for the PhD scholarship
program which allowed financing thesis stays in
France during which this work was carried out. We
also thank Dedan Kimathi University of Technology
in Kenya for its support to this PhD work.
Analysing Student Engagement in an Online Course in the Context of Hybrid Learning Environment: An Empirical Study
161

REFERENCES
Bates, A. T. et al. (2018). Teaching in a digital age: Guide-
lines for designing teaching and learning.
Carini, R. M., Kuh, G. D., and Klein, S. P. (2006). Student
engagement and student learning: Testing the link-
ages. Research in higher education, 47(1):1–32.
Chatti, M. A., Dyckhoff, A. L., Schroeder, U., and Th
¨
us,
H. (2012). A reference model for learning analytics.
International Journal of Technology Enhanced Learn-
ing, 4(5-6):318–331.
Coates, H. (2006). Student engagement in campus-based
and online education: University connections. Rout-
ledge.
Coffrin, C., Corrin, L., de Barba, P., and Kennedy, G.
(2014). Visualizing patterns of student engagement
and performance in moocs. In Proceedings of the
fourth international conference on learning analytics
and knowledge, pages 83–92. ACM.
Day, W. H. and Edelsbrunner, H. (1984). Efficient algo-
rithms for agglomerative hierarchical clustering meth-
ods. Journal of classification, 1(1):7–24.
Earl, L. M. (2012). Assessment as learning: Using class-
room assessment to maximize student learning. Cor-
win Press.
Gunuc, S. and Kuzu, A. (2015). Student engagement scale:
development, reliability and validity. Assessment &
Evaluation in Higher Education, 40(4):587–610.
Henrie, C. R., Bodily, R., Manwaring, K. C., and Graham,
C. R. (2015). Exploring intensive longitudinal mea-
sures of student engagement in blended learning. The
International Review of Research in Open and Dis-
tributed Learning, 16(3).
Horton, W. (2011). E-learning by design. John Wiley &
Sons.
Jolliffe, I. (2003). Principal component analysis. Techno-
metrics, 45(3):276.
Kuh, G. D. (2009). The national survey of student engage-
ment: Conceptual and empirical foundations. New di-
rections for institutional research, 141(1):5–20.
Kumar, S., Gankotiya, A. K., and Dutta, K. (2011). A com-
parative study of moodle with other e-learning sys-
tems. In 2011 3rd International Conference on Elec-
tronics Computer Technology, volume 5, pages 414–
418. IEEE.
Lea, S. J., Stephenson, D., and Troy, J. (2003). Higher edu-
cation students’ attitudes to student-centred learning:
beyond’educational bulimia’? Studies in higher edu-
cation, 28(3):321–334.
Lei, S. A. (2010). Intrinsic and extrinsic motivation: Eval-
uating benefits and drawbacks from college instruc-
tors’ perspectives. Journal of Instructional psychol-
ogy, 37(2):153–161.
Lewis, A. D., Huebner, E. S., Malone, P. S., and Valois,
R. F. (2011). Life satisfaction and student engage-
ment in adolescents. Journal of Youth and Adoles-
cence, 40(3):249–262.
Lockyer, L., Heathcote, E., and Dawson, S. (2013). Inform-
ing pedagogical action: Aligning learning analytics
with learning design. American Behavioral Scientist,
57(10):1439–1459.
Ma, J., Han, X., Yang, J., and Cheng, J. (2015). Examining
the necessary condition for engagement in an online
learning environment based on learning analytics ap-
proach: The role of the instructor. The Internet and
Higher Education, 24:26–34.
Means, B., Bakia, M., and Murphy, R. (2014). Learning
online: What research tells us about whether, when
and how. Routledge.
Mosher, R. and MacGowan, B. (1985). Assessing student
engagement in secondary schools: Alternative con-
ceptions, strategies of assessing, and instruments.
Murray, M., P
´
erez, J., Geist, D., and Hedrick, A. (2013).
Student interaction with content in online and hybrid
courses: Leading horses to the proverbial water. In
Proceedings of the Informing Science and Information
Technology Education Conference, pages 99–115. In-
forming Science Institute.
Rice, W. (2015). Moodle e-learning course development.
Packt Publishing Ltd.
Rieber, L. P. (2017). Participation patterns in a massive
open online course (mooc) about statistics. British
Journal of Educational Technology, 48(6):1295–
1304.
Robinson, C. C. and Hullinger, H. (2008). New bench-
marks in higher education: Student engagement in
online learning. Journal of Education for Business,
84(2):101–109.
Siemens, G., Gasevic, D., Haythornthwaite, C., Dawson,
S. P., Shum, S., Ferguson, R., Duval, E., Verbert, K.,
Baker, R., et al. (2011). Open learning analytics: an
integrated & modularized platform.
Skinner, E. A. and Belmont, M. J. (1993). Motivation in the
classroom: Reciprocal effects of teacher behavior and
student engagement across the school year. Journal of
educational psychology, 85(4):571.
Skinner, E. A., Wellborn, J. G., and Connell, J. P. (1990).
What it takes to do well in school and whether i’ve
got it: A process model of perceived control and chil-
dren’s engagement and achievement in school. Jour-
nal of educational psychology, 82(1):22.
Xing, W., Guo, R., Petakovic, E., and Goggins, S. (2015).
Participation-based student final performance predic-
tion model through interpretable genetic program-
ming: Integrating learning analytics, educational data
mining and theory. Computers in Human Behavior,
47:168–181.
Xiong, Y. and Suen, H. K. (2018). Assessment approaches
in massive open online courses: Possibilities, chal-
lenges and future directions. International Review of
Education, 64(2):241–263.
You, J. W. (2016). Identifying significant indicators using
lms data to predict course achievement in online learn-
ing. The Internet and Higher Education, 29:23–30.
CSEDU 2021 - 13th International Conference on Computer Supported Education
162
