
An Artificial Neural Network-based Real Time DSS to Manage the
Discharges of a Wastewater Treatment Plant and Reduce the
Flooding Risk
Loris Francesco Termite
1
, Emanuele Bonamente
2
, Alberto Garinei
3,4
, Daniele Bolpagni
5
,
Lorenzo Menculini
4
, Marcello Marconi
3,4
, Lorenzo Biondi
3,4
, Andrea Chini
6
and Massimo Crespi
6
1
K-Digitale S.r.l., Perugia, Italy
2
Department of Engineering, University of Perugia, Perugia, Italy
3
Department of Sustainability Engineering, Guglielmo Marconi University, Rome, Italy
4
Idea-Re S.r.l., Perugia, Italy
5
A2A Ciclo Idrico S.p.A., Brescia, Italy
6
Radarmeteo S.r.l., Due Carrare (PD), Italy
Keywords: Decision Support System, Artificial Neural Networks, Flood Management, Flood Forecasting, Smart
Infrastructures.
Abstract: An approach for sewerage systems monitoring based on Artificial Neural Networks is presented as a feasible
and reliable way of providing operators with a real-time Decision Support System that is able to predict critical
events and suggest a proper mitigation strategy. A fully-working prototype was developed and tested on a
sewerage system in the city of Brescia, Italy. The system is trained to forecast flows and water levels in critical
points of the grid based on their measured values as well as rainfall data. When relying on observed rainfall
only, key parameters can be predicted up to 60 minutes in advance, whereas including very-short-term
Quantitative Precipitation Estimates – nowcasting – the time horizon can be extended further, up to 140
minutes in the current case study. Unlike classical hydraulic modelling, the proposed approach can be
effectively used run-time as the execution is performed with a negligible computational cost, and it is suitable
to increase safety measures in a Smart City context.
1 INTRODUCTION
In many urban scenarios, the management of
wastewater is performed by combined sewer systems,
collecting both storm water and black/greywater in
order to send them to the wastewater treatment plant
(WWTP). In case of intense rainfall events, the sewer
discharge may reach its capacity limit and
occasionally produce combined sewer overflow
(CSO), leading to pollution risk. Moreover, excessive
discharges of treated water may produce floods if the
stage of the receiving bodies is already high due to
rainfall. Specific structures – spillway gates, buffer
tanks, pumps, etc – are designed to mitigate such
occurrences. Clearly, an optimal intervention strategy
during a critical event strongly relies on the accurate
knowledge of the system status (water flows and
levels, gate openings) and, possibly, the weather
conditions (i.e. observed and expected rainfalls). The
lack of a comprehensive monitoring and forecast
network requires the operators to choose the
intervention strategy by relying mostly on their
experience. In such contexts, a decision support
system (DSS) may represent a fundamental aid
(Pereira et al., 2019).
DSSs are platforms dedicated to providing
support to the human operator in deciding which
operations to perform. Several examples are available
in the literature for sewerage systems-related
applications (Park and Kim, 2013; Rao, 2015), their
focus being on the design, renovation, and upgrade of
the physical system or on the offline reanalysis of past
events in order to optimize future intervention
strategies. Instead, the monitoring of sewerage
networks using real-time data has been mainly
focused on pollution emissions and concentrations
(Rechdaoui-Guérin et al., 2018).
Termite, L., Bonamente, E., Garinei, A., Bolpagni, D., Menculini, L., Marconi, M., Biondi, L., Chini, A. and Crespi, M.
An Artificial Neural Network-based Real Time DSS to Manage the Discharges of a Wastewater Treatment Plant and Reduce the Flooding Risk.
DOI: 10.5220/0010396500150026
In Proceedings of the 10th International Conference on Smart Cities and Green ICT Systems (SMARTGREENS 2021), pages 15-26
ISBN: 978-989-758-512-8
Copyright
c
2021 by SCITEPRESS – Science and Technology Publications, Lda. All rights reserved
15

In recent years, smart network monitoring began
to find development and applications. The advances
in technology can be exploited by municipalities,
utilities, and related organizations to implement smart
data infrastructure for wet weather control. More
specifically, advanced monitoring data are used to
support wet weather control and decision-making in
real time or near real time. The United States
Environmental Protection Agency defines smart
infrastructures as “the integration of emerging and
advanced technology to enhance the collection,
storage, and/or reanalysis of water-related data”,
making use of “hardware, communication and
management analytics to provide real and tangible
benefits to utilities”, as “maximizing existing
infrastructure and optimizing operations and
responses to be proactive, not reactive” (US EPA,
2018). Smart infrastructures are generally
implemented in connection with a supervisory control
and data acquisition (SCADA) system. Their main
objective is usually the real-time monitoring of
CSO’s flow rates and effluent level, in order to assess
potential flooding and pollution incidents and to
support real-time or quasi real-time decision making
about actions to be taken (Botturi et al., 2020).
However, to the best of the authors’ knowledge –
with particular reference to the Italian territory – the
diffusion of smart infrastructures is still quite limited.
Despite the presence of few studies aimed at reducing
CSO through Real Time Control of gates and sluices
(Carbone et al., 2014; Campisano et al., 2016), some
issues are not addressed properly, as the potential risk
of flooding due to excessive discharge of treated
water from the WWTP to the receiving body. Most of
real-world DSS implementations aimed at flood
mitigation still rely on traditional hydraulic models
and are often characterized by a high computational
demand making them unsuitable for real-time usage.
Sometimes such models proved to be outdated and
are not resilient to climate change. Moreover, there is
lack of use of very-short-term precipitation forecasts,
which are crucial in case of high-intense and short-
lasting rainfall events.
This paper presents a case study about the design
of a DSS dedicated to WWTP management. It allows
real-time monitoring of the system status through a
network of ground-based meters and weather radars.
It also includes a forecasting tool that provides
additional information to help operators in planning
manoeuvres, thanks to a methodology based on
Artificial Intelligence – specifically Artificial Neural
Networks (ANNs) (Maier et al., 2010) – estimating
water levels and flows inside the network. ANNs are
suitable tools for the purposes of this study, since they
allow for a reduction in the input data variety –
selecting only the most statistically significant in the
input-output relation – and the non-use of parameters
needed by traditional models, as for example the soil
properties in rainfall-runoff modelling. Moreover,
after being calibrated, their execution is immediate
and perfectly matches the real-time requirements.
They can also be easily updated, well facing possible
changes in the real environment.
The aim of the implemented DSS is to give
operators useful insights about the current status of
the receiving water body in strategic locations, the
potential CSO amount, the WWTP inflow, the current
and recent rainfall and the estimated evolution of the
strategic variables, collecting all data and showing
them in a single User Interface, to eventually guide
them to apply a proper risk mitigation strategy.
As regards rainfall information, the DSS also
exploits high resolution very-short-term quantitative
precipitation forecasting, also known as
“nowcasting” (Wilson et al., 1998). Quantitative
precipitation forecasting is performed by means of
algorithms working on rainfall measures provided by
weather radars (Bellon et al., 2010; Lee et al., 2010).
It has been proved that radar-based nowcasting can
give more reliable results than classic numerical
weather prediction within a time horizon of 3-8 hours
(Mandapaka et al., 2012), being therefore a valuable
tool for real-time decision-making. In the present
context, nowcasting is used to further extend the time
horizon of ANNs predictions for hydraulic variables,
allowing to manage the potential emergencies with a
reasonable advance.
The designed DSS provides real-time monitoring
of the hydraulic system status and – thanks to ANNs
– predicts its future evolution. Once the model
calibration has been performed, the ANNs algorithms
consist in linear algebra operations on matrices which
require negligible computational times, unlike more
traditional hydraulic models that as of today require
large computational times and computing resources
(Clark et al., 2017).
2 METHODOLOGY
2.1 Description of the System Layout
The WWTP for which the DSS was developed
collects the sewage and urban runoff in the city of
Brescia (Italy) and its surrounding area, serving a
total of 296.000 inhabitants over a 146 km
2
surface.
Figure 1 shows the system layout.
SMARTGREENS 2021 - 10th International Conference on Smart Cities and Green ICT Systems
16

Figure 1: System layout.
An urban drainage channel named Vaso Fiume
(VF) runs parallel to the final sewer collector,
upstream the WWTP. When the sewer flow raises
above a critical level, the excess is directed into the
VF trough two lateral spillways, one located just
before the WWTP and one a few km upstream. The
VF also receives the treated wastewater. A bigger
urban drainage channel, named Vaso Garzetta (VG),
collects water from the VF approximately 2.4 km
downstream and eventually flows into the Mella river
after a 3.4 km path. The whole network of receiving
water bodies is characterized by potential hydraulic
risk in case of extreme rainfall events: over the last
years urban flooding has occurred several times along
the VG channel, in a critical location corresponding
to the gz_lt01 measuring point (approximately 1.7 km
downstream the confluence with VF). In such
circumstances, the water flowing from VF into VG
should be constrained and the WWTP technicians
must pay close attention in order to minimize the risk
of flooding. To this aim, the VF channel is equipped
with a series of inline or lateral gates, which can be
used effectively for flood prevention. Two lateral
gates (g10 and g15), which are closed in standard
conditions, can be gradually opened to direct the flow
in the surrounding rural area, within environmental
law limitations. A couple of paired inline gates (g14a
and g14b), which are kept open in standard
conditions, can be progressively closed to reduce, and
in certain cases completely arrest, the VF flow into
the VG. A storage area is also present next to the
WWTP and is used to reduce the peak discharge into
the VF: an inline gate (g2) can be partially closed in
order to increase the upstream water level and
activate a lateral spillway into the storage area.
The WWTP and the sewage network are managed
by a leading multiutility society which has been
playing much effort in Smart City projects over the
last years. The wish of the WWTP managers was to
have a tool able to assist them in taking proper
decision especially when dealing with severe rainfall
events. Indeed, prior to the development of the
present DSS platform, the gate-opening strategy
relied only on operator experience – based on
information from the upstream gz_lt02 meter – to
foresee impending flood waves. Operators decided
whether to use the storage area and to open lateral
spillways in order to reduce the outflow towards the
VG channel and prevent downstream overflows.
However, the users lacked an interface allowing a
thorough monitoring of the system status. In
particular, information about forthcoming rainfall
amounts, water levels and sewer flows was
completely missing. In case of severe events, such an
approach was not able to completely avoid risks.
In addition to the VG level at gz_lt02, particular
attention is also devoted to the WWTP inlet (ml01),
as treatment cycles can be optimized thanks to the
presence of an internal buffer tank. Since during
extreme events the flow at ml01 may exceed the
WWTP processing capacity, knowing this flow in
advance can help to properly manage the internal
operation of the plant. Therefore, the VG level at
gz_lt02 and the flow at ml01 are key parameters to be
monitored. Their expected values are forecasted by
the ANNs developed for the DSS.
2.2 The Decision Support System
2.2.1 Data Acquisition
Prior to the DSS implementation, the acquired data
(rainfall, levels, flows, gate openings) were collected
in diverse databases and visualized in separate
interfaces, preventing the WWTP operators from
having a comprehensive view of the system status.
Rainfall data used to be provided only by six
pluviometers within the catchment; for the purposes
of the present study it was instead decided to also
exploit advanced meteorological radar
measurements. To this end, distributed rainfall
measurements performed by radars were calibrated
through the punctual pluviometer records, eventually
obtaining reliable information in terms of both value
accuracy and spatial variability. The resulting product
has 1×1 km spatial resolution as in Panziera et al.
(2011) and a 10-minutes time resolution.
The resulting integrated rainfall measurements
were spatially averaged over the whole catchment to
obtain a single value to be used as an input for the
ANNs. Preliminary attempts demonstrated that
distinguishing over rainfalls precipitated in different
zones only makes water levels and flows forecasts
An Artificial Neural Network-based Real Time DSS to Manage the Discharges of a Wastewater Treatment Plant and Reduce the Flooding
Risk
17

less stable and does not produce any significant
improvement over using the mean areal rainfall.
The readout of each sensor was synchronized, the
time step was fixed to 10 minutes, and a dedicated
server was realized to host the system database
containing all the records of measured data, computed
quantities and final parameters.
2.2.2 ANNs Setup
Rainfall, gz_lt02 level and ml01 discharge data were
made available for a period spanning from October
2016 to August 2018.
A set of four ANNs was set up, two predicting VG
level variation and the other two predicting sewer
flow variation.
The effect produced on target variables by rainfall
is visible with a lag time that was found to vary
between 30 minutes and 2 hours. Thus, it was decided
to predict them up to 60 minutes beyond the last
known rainfall information, whether measured or
predicted.
More specifically, the ANN named ANN
LS
(level/short-term) makes use of measured rainfalls
only and provides gz_lt02 level forecast up to 60
minutes; ANN
LL
(level/long-term) uses also
nowcasting up to +80 minutes, thus extending the
forecast horizon to 140 minutes. Similarly, ANN
FS
(flow/short-term) and ANN
FL
(flow/long-term)
forecast sewer discharge at ml01. ANN
LS
and ANN
LL
were trained and validated using 18 suitably trimmed
rainfall events in the analysed period, corresponding
to a total 1714 datapoints; ANN
FS
and ANN
FL
used 17
events, with 12057 datapoints. Due to the available
data, the two samples refer to different sets of events.
The higher number of datapoints used to train sewer-
related ANNs depends on the fact that events were
trimmed in larger chunks, because flows at ml01 take
longer to return to the unperturbed value after
rainfalls with respect to levels at gz_lt02.
Measured rainfall inputs for ANN
LS
and ANN
LL
cover the antecedent 2-hours interval. This extension
was considered appropriate, covering the whole range
of observed lags. A longer period (six hours) was
required for ml01 forecast, due to the longer-lasting
observed perturbation induced on the sewer collector
by precipitation.
Rainfall measurements are updated every 10
minutes, while nowcasting is updated every 20
minutes due to computing limitations. This results in
two different updating frequencies for short-term and
long-term predictions, consistent with rainfall input
updates. For convenience, the rainfall measurements
provided to the ANNs are also aggregated in 20-
minute bins, although updated every 10 minutes.
Moreover, to keep track of the initial conditions, the
current level/flow is also used as input.
For all the ANNs, the targets are the level/flow
variations induced by rainfall, with respect to the
current value, evaluated on a 10-minute basis. Thus,
at every execution, ANN
LS
and ANN
FS
produce six
outputs (10-minute bins from +10 to +60), while
ANN
LL
and ANN
FL
produce fourteen outputs (10-
minute bins from +10 to +140).
The expected levels are obtained by the algebraic
sum of current values and predicted variations. The
expected flows calculation needs an additional term
to be considered in the sum, i.e. the characteristic
daily modulation of sewer discharge. Thus, the
average flow profile at ml01 was obtained
disregarding rainy days and was found to lie in the
range 0.5-1.2 m
3
/s (Figure 2), then the corresponding
144 average flow variations – on a 10-minute basis
from 0:00 to 23:50 – were computed.
Figure 2: Average ml01 profile during dry days (blue line).
The Multilayer Perceptron structure was chosen
to build the ANNs, that were developed in a
MATLAB environment. After trial-and-error
attempts, the layout was chosen so that all the ANNs
share a common structure, with a 20-nodes single
hidden layer connecting the input and output layers.
All the inputs and targets were normalized between 0
and 1. A logistic activation function is used in the
hidden layer, and a linear activation function is used
in the output layer to produce the results. It is
customary in Machine Learning to use three different
sets of data, namely the calibration, validation and
testing set: the calibration and validation set are used
to train the networks, with the first used to fix weights
and biases and the latter to adjust the
hyperparameters; the testing set is used to test the
ANNs performance on unseen data. However, due to
some uncertainties in the available data, and since the
aim of this study was not to explore ANNs’ theory but
instead it was necessary to exploit as much data as
possible to build a ready-to-use product, it was
SMARTGREENS 2021 - 10th International Conference on Smart Cities and Green ICT Systems
18

decided to disregard the testing set. Therefore, the
available datasets were split using the last four events
(380 datapoints, i.e. 22.17% for level forecast; 2274
datapoints, i.e. 18.86% for flow forecast) for the
validation set and the previous ones for the calibration
set.
Weights and biases in the ANNs nodes were
randomly initialized, and the Levenberg-Marquadt
backpropagation algorithm was used to minimize the
cost function, specifically the mean square error
between the target/output pairs; the algorithm
execution was imposed to stop if the validation error
increased for 20 consecutive iterations. Since the
training procedure outcome varies depending on the
randomly generated initial parameters and on the
chance of the training algorithm getting stuck in local
minima, each ANN was trained 2000 times using the
above-mentioned procedure, and the best-performing
network was then selected.
Rather than considering the cost function, a more
detailed multi-objective optimization was
implemented to select the best performing ANNs,
keeping in mind their final purpose, i.e. a correct and
prompt forecast of the most severe events. Thus, for
both level and flow, three threshold values were
defined, i.e. 70, 100 and 140 cm at gz_lt02 and 2.5,
3.5 and 4.5 m
3
/s at ml01. Four objectives were defined
to select the best performing ANNs.
1) The Nash-Sutcliffe Efficiency index (NSE)
computed on actual network targets and outputs
(normalized values). The optimization variable to
be minimized is the subtracted ratio in the NSE
definition:
𝑁𝑆𝐸 = 1 −
∑
𝑂
−𝑆
∑
𝑂
−𝑂
(1)
where 𝑂
are the observed values, 𝑂
is their mean
value and 𝑆
are the simulated values. NSE is
computed for each prediction horizon (10 minutes, 20
minutes, …etc.) and the objective is found from the
mean of the computed values.
2) Maximum number of correct predictions of
threshold values crossing. The optimization
variable, to be minimized, is the ratio of missed
predictions to observed crossings. It is computed
for each alert level and the objective is set to the
mean of the three computed values.
3) Minimum number of fake predictions (threshold
crossing prediction not corresponding to observed
crossing). The optimization variable, to be
minimized, is the ratio of fake predictions to total
predictions, either true or false. It is computed for
each alert level and the objective is set to the mean
of the three computed values.
4) Optimal prediction timing. Every time there is an
observed threshold level crossing in the forecast
time horizon after current timestamp and there is
also a predicted crossing, the delay between the
observed and predicted time of crossing is
computed. The objective to minimize is the mean
squared delay for all alert levels.
Objectives n.2 and n.3 vary between 0 and 1. In order
to give objective n.1 the same range of variability, the
upper boundary of the subtracted ratio was set to 1, as
values greater than 1 would imply a non-acceptable
performance and the related solution should be
discarded. Objective n.4 was normalized between 0
and 1 with respect to its possible minimum and
maximum values (i.e. 0 and 50 minutes for short-term
predictions and 0 and 130 minutes for long-term
predictions). In looking for the Pareto front of
undominated solutions, the second and fourth
objectives were given a weight triple than the others.
This was mainly due to sewer management reasons.
Among these points in the 4-D resulting spaces, the
best performing combinations were selected as those
with the minimum Euclidean norm and the
corresponding sets of weights and biases matrices
were used in the algorithms running in the DSS.
Since objectives n.2, n.3 and n.4 can be computed
only on threshold crossings – and therefore on a small
amount of data – the above-mentioned optimization
procedure was performed on the whole available
dataset, comprising both training and validation
datapoints.
3 RESULTS
3.1 ANNs Performance
The multi-objective optimization led to the selection
of the best performing ANNs. A first evaluation of
their performance was made according to the
objectives described in section 2.2.2. The obtained
values are shown in Table 1. A better general
performance of level prediction with respect to sewer
discharge prediction can be noticed. Moreover, better
predictions are obtained from ANNs exploiting
nowcasting information.
An Artificial Neural Network-based Real Time DSS to Manage the Discharges of a Wastewater Treatment Plant and Reduce the Flooding
Risk
19

Table 1: Results of the multi-objective optimization: values
for the selected ANNs.
OBJ 1 OBJ 2 OBJ 3 OBJ 4
ANN
LS
0.241 0.150 0.106 0.061
ANN
LL
0.128 0.137 0.039 0.037
ANN
FS
0.531 0.175 0.117 0.100
ANN
FL
0.412 0.201 0.069 0.083
Statistical analyses were performed on the results.
For all the selected ANNs, the NSE index was
calculated for each event and each forecasting
horizon (+10 to +60 minutes or +10 to +140 minutes).
Calibration values for ANN
LS
– averaged on the 14
events in the set – range between 0.484 and 0.888,
with higher values corresponding to shorter
forecasting horizons. Similarly, average validation
values are comprised between 0.294 and 0.906.
ANN
LL
gave NSE average values ranging between
0.301 and 0.601 for calibration events and between
0.103 and 0.903 for validation ones. The ranges of
average NSE values are 0.987÷0.909 and
0.904÷0.989 for ANN
FS
calibration and validation
events, respectively. Finally, NSE average ranges for
ANN
FL
are 0.843÷0.986 (calibration) and
0.789÷0.988 (validation). As a term of comparison,
Jeong et al. (2010) obtained NSE = 0.74 for
calibration data and NSE = 0.63 for validation data
when modelling stream flows in a small watershed
using the SWAT tool. However, this kind of analysis
does not give useful insights on the ANNs efficiency
in the DSS and may even be misleading. Indeed, the
main goal of a real-time DSS like as the one presented
Table 2: Performance of the selected ANNs in predicting threshold crossings. Values outside brackets refer to the whole
dataset; values in brackets refer to calibration and validation sets, respectively.
Threshold 1 Threshold 2 Threshold 3
ANN
LS
n. observed. 22 (17 / 5) 9 (6 / 3) 4 (2 / 2)
n. predicted. 22 (17 / 5) 6 (4 / 2) 3 (2 / 1)
predicted % 100.0 (100.0 / 100.0) 66.7 (66.67 / 66.67) 75.0 (100.0 / 50.0)
a.w.t. (min) 36.8 (35.2 / 42.0) 25.0 (27.5 / 20.0) 33.3 (35.0 / 30.0)
a.p.d. (min) 3.2 (3.6 / 2.0) 1.7 (0.0 / 5.0) -3.3 (0.0 / -10.0)
false alerts 10 (7 / 3) 1 (1 / 0) 0 (0 / 0)
ANN
LL
n. observed. 22 (17 / 5) 9 (6 / 3) 4 (2 / 2)
n. predicted. 22 (17 / 5) 5 (3 / 2) 3 (2 / 1)
predicted % 100.0 (100.0 / 100.0) 55.6 (50.0 / 66.67) 75.0 (100.0 / 50.0)
a.w.t. (min) 97.7 (91.8 / 118.0) 116.0 (110.0 / 125.0) 113.3 (115.0 / 110.0)
a.p.d. (min) -7.3 (-5.9 / -12.0) -10.0 (-3.3 / -20.0) 3.3 (0.0 / 10.0)
false alerts 9 (6 / 3) 4 (2 / 2) 0 (0 / 0)
ANN
FS
n. observed. 56 (45 / 11) 11 (7 / 4) 2 (1 / 1)
n. predicted. 34 (31 / 3) 7 (4 / 3) 2 (1 / 1)
predicted % 60.7 (68.9 / 27.3) 64.7 (57.1 / 75.0) 100.0 (100.0 / 100.0)
a.w.t. (min) 35.9 (36.4 / 30.0) 22.9 (22.5 / 23.3) 45.0 (30.0 / 60.0)
a.p.d. (min) 0.0 (0.3 / -3.3) 5.7 (15.0 / -6.7) 5.0 (20.0 / -10.0)
false alerts 16 (10 / 6) 2 (1 / 1) 0 (0 / 0)
ANN
FL
n. observed. 56 (45 / 11) 11 (7 / 4) 2 (1 / 1)
n. predicted. 36 (32 / 4) 9 (5 / 4) 2 (1 / 1)
predicted % 64.3 (71.1 / 36.4) 81.8 (71.4 / 100.0) 100.0 (100.0 / 100.0)
a.w.t. (min) 71.4 (69.7 / 85.0) 73.3 (98.0 / 42.5) 100.0 (70.0 / 130.0)
a.p.d. (min) 8.9 (8.4 / 12.5) 5.6 (2.0 / 5.0) 15.0 (30.0 / 0.0)
false alerts 15 (5 / 10) 2 (2 / 0) 0 (0 / 0)
SMARTGREENS 2021 - 10th International Conference on Smart Cities and Green ICT Systems
20
in this case study is to guarantee that accurate alerts
are sent sufficiently in advance, allowing operators to
act promptly. Therefore, the performances of the
selected ANNs were also evaluated according to the
metrics defined in Table 2 (please note that values
outside brackets refer to the whole datasets, while
first and second values in brackets refer to calibration
and validation sets, respectively). For each ANN, the
total number of observed crossings of the defined
threshold values (70, 100 and 140 cm at gz_lt02; 2.5,
3.5 and 4.5 m
3
/s at ml01) is displayed, along with the
number of corresponding predictions and related
percentages of correctly predicted crossings. Given
the DSS updating frequency, observed crossings can
be forecasted with an anticipation varying (with a 10-
minute resolution) from 60 to 10 minutes for ANN
LS
and ANN
FS
and from 140 to 10 minutes for ANN
LL
and
ANN
FL
. A crossing is considered predicted if it is
signalled to occur at least once in the available
forecasting horizon. Two other parameters that were
evaluated are the average warning time (a.w.t. in
Table 2), i.e. the mean anticipation corresponding to
the first alert of impending crossing, and the average
prediction delay (a.p.d. in Table 2), indicating the
accuracy of the prediction timing. As an example, if
the DSS first signals an impending crossing by
warning that it will happen after 40 minutes, but the
actual crossing is observed after 30 minutes, then the
warning time is 30 minutes and the prediction delay
is 10 minutes. Finally, the number of false alerts is
shown. In contrast to correct crossing predictions, an
alert is considered false if there is no actual crossing
at any time step of the forecasting horizon.
From Table 2 it is possible to see that all the ANNs
can predict the majority of the most severe gz_lt02
level occurrences: threshold 3 crossings are predicted
three times on four occurrences, with the missed
prediction referring to a validation event. The
validation set comprises only two crossings of the
higher threshold and the prediction percentage is
50%, but more data would be necessary to better
assess the performance. All the lower threshold
crossings are predicted, while some are missed for
the intermediate one, and for both the performances
on the calibration and validation sets are comparable.
The average warning time ranges between
approximately 25 and 40 minutes for short-term
predictions, while the use of nowcasting information
allows to increase the forecast anticipation to
approximately 2 hours. The absolute value of the
average prediction delay is generally lower than 10
minutes, the only higher value being the -20 minutes
delay obtained for ANN
LL
with respect to the two
predicted Threshold 2 crossings in the validation set
(i.e. the signalled crossing times are, on average, 20
minutes early with respect to the actual ones). As
regards sewer flow predictions, they are again slightly
outperformed by level forecasts. This may be due to
observed ml01 flows during rainfall events being less
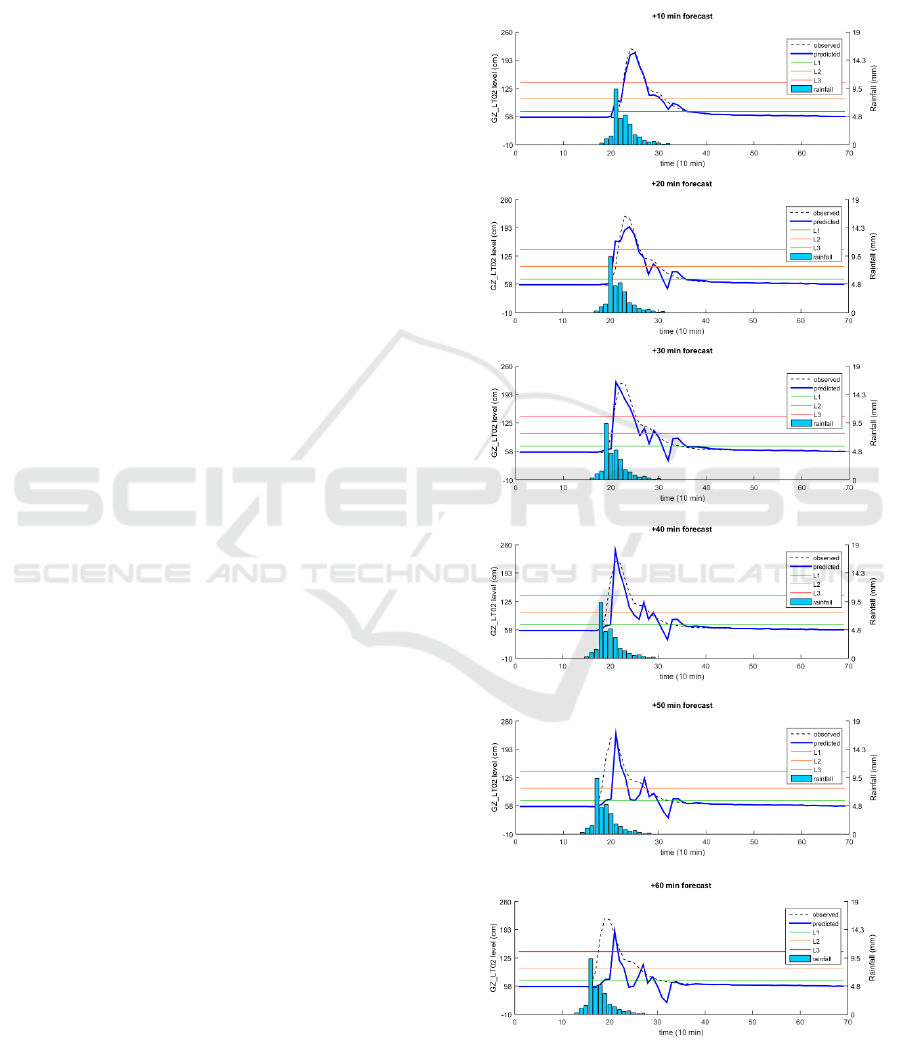
Figure 3: ANN
LS
envelop of level forecast for a validation
event.
An Artificial Neural Network-based Real Time DSS to Manage the Discharges of a Wastewater Treatment Plant and Reduce the Flooding
Risk
21
regular with respect to those of the VG level. The
highest flow threshold crossings are always predicted,
even if they occur just once in the calibration events
and once in the validation events. The average
warning time and prediction delay are comparable to
the ones obtained for level forecasts. All models
generate some false alerts, especially for the lowest
threshold, while never for the highest one.
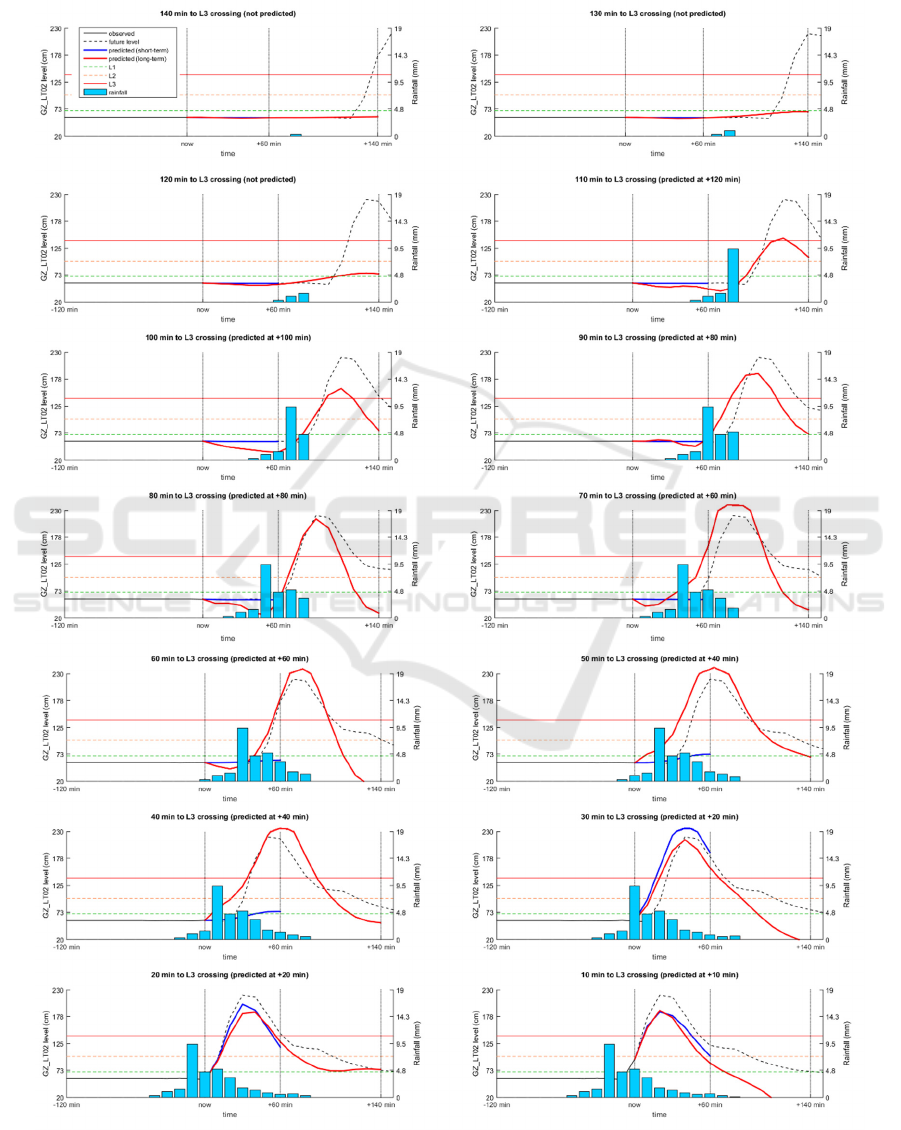
Figure 4: Level 3 crossing prediction efficiency from 140 to 10 minutes before the first occurrence during a validation event.
SMARTGREENS 2021 - 10th International Conference on Smart Cities and Green ICT Systems
22
Some examples of the prediction performance on a
severe event in the validation set, during which all the
thresholds are crossed, are shown in Figures 3 and 4.
Figure 3 shows, for all the short-term prediction
horizons, the envelop of the forecasted level vs the
observed one. Figure 4 shows, for the same event, a
sort of “snap-shot” of the User Interface (UI) from 140
to 10 minutes prior to the first crossing of the L3
threshold. As in the actual UI described in next section,
the time axis spans from 120 minutes prior to the
current time to 180 minutes after. Measured and
forecasted rainfalls and levels are shown. The observed
future level is also shown for comparison purpose. As
it can be noticed, the first alert is given 110 minutes
before the actual crossing, thanks to the long-term
predicting ANN (red line), even if the crossing is
signalled to occur within 120 minutes. 80 minutes
before the crossing, the amount of expected level
becomes more reliable. The short-term prediction (blue
line) raises above L3 only 30 minutes before the
crossing. Indeed, up to 40 minutes before the crossing,
the amount of measured rainfall is still quite low, and
consequently ANN
LS
predicts just a small level raise.
The considerable rainfall intensity increase that is
measured 30 minutes before the crossing is finally
allowing ANN
LS
to predict a steep raise of gz_lt02 level.
This example underlines the importance of nowcasting
information, that permits to have alerts of incoming
critical events with a reasonable advance.
3.2 User Interface
The DSS was designed to provide a comprehensive
view of the sewerage network, with a particular focus
on the two key parameters defined in section 2. Thus,
a UI was created. Specifically, it was developed as a
QGIS plugin, to allow further improvements using
georeferenced data. Weights and biases were
extracted from the selected ANNs allowing to write
real-time running forecast algorithms consisting in
in linear algebra operations on matrices. These
algorithms, together with all the other necessary
scripts running behind the DSS, were developed
through the Python language. All measured and
processed data are stored in the DSS database. From
there, data are picked to be shown in the User
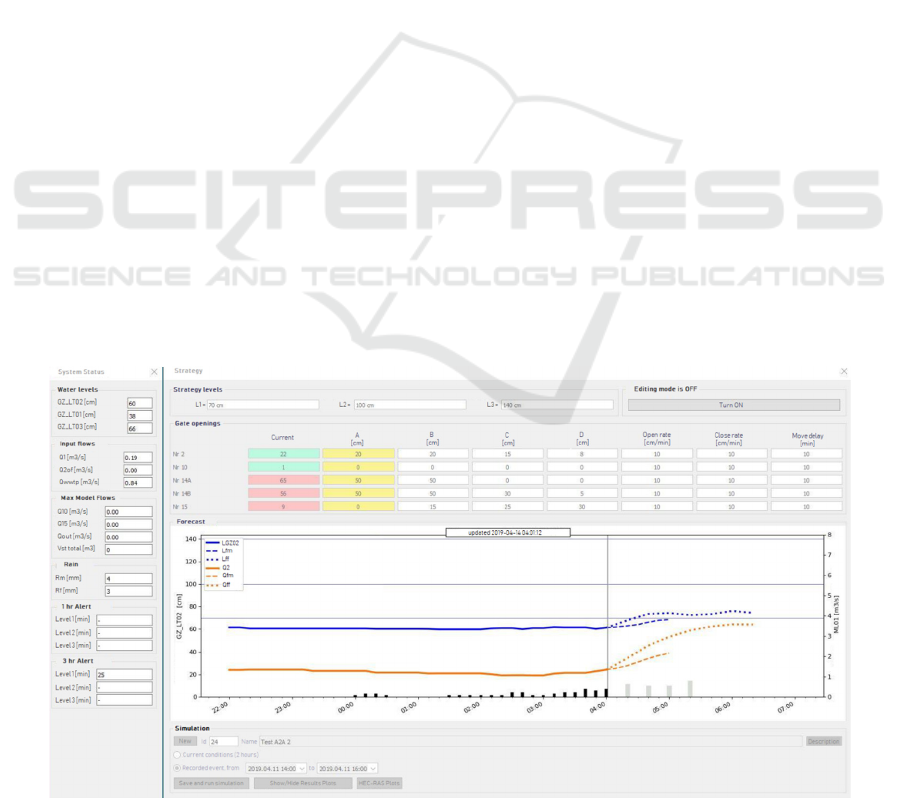
Interface. In particular, the UI (Figure 5) shows
directly measured quantities (e.g. current values of
levels along the VG channel, VF gate openings,
flows) together with derived quantities (as for
example the estimated CSO downstream ml01 that,
given the difficulty in placing a meter due to
morphological issues, was estimated by means of
water mass balance between the collector flow and
the internal WWTP flow during rainfall events). The
UI also can display the results of simulations of the
VF channel behaviour using different mitigation
strategies, as explained later on. The main section is
dedicated to the visualization of the VG levels at
gz_lt02 (blue lines) and ml01 discharge (orange lines)
as recorded for the past 6 hours (continuous lines) and
predicted for the next 60 minutes (dashed lines) or
140 minutes (dotted lines). Above the main plot, the
current and suggested openings for the 5 operable
gates (labelled as Nr.2, Nr.10, Nr.14A, Nr.14B, and
Nr.15 in the UI) is also shown. The gate-opening
strategy is driven by the measured VG level at
gz_lt02. The three threshold values defined for the
Figure 5: User Interface in the QGIS plugin.
An Artificial Neural Network-based Real Time DSS to Manage the Discharges of a Wastewater Treatment Plant and Reduce the Flooding
Risk
23
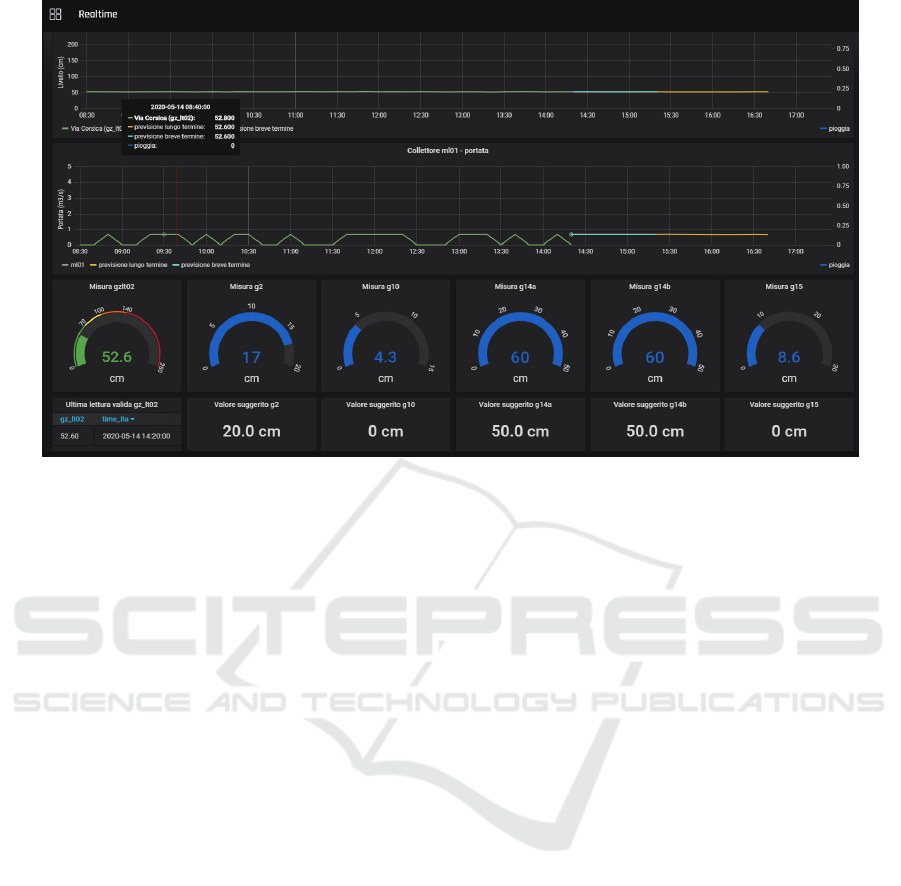
Figure 6: Real-time Grafana visualization dashboard.
VG level (L1=70 cm, L2=100 cm, L3=140 cm)
trigger four different combinations of suggested gate
openings (namely “A”, “B”, “C” and “D” in the UI)
that are characterized by an increasing quantity of
spilled water and storage area usage, resulting in a
decreasing discharge into the VG channel until it is
completely blocked in case most severe events. The
suggested strategy is highlighted in yellow and the
current openings are highlighted in green or red,
depending on whether they are in accordance or not
with the proposed ones, with a 5 cm tolerance. At this
first stage, the suggested strategies are based on the
long-time experience of the WWTP technicians.
However, the “Simulation” section of the UI, below
the main plots, embeds a physically-based HEC-RAS
hydraulic model of the VF (not discussed here for the
sake of brevity) that can be executed between two
selected timestamps using past boundary conditions.
Thus, by changing the threshold values of the VG
level or the suggested gate openings, ex-post analyses
can be performed with the final aim of assessing the
goodness of the adopted strategies or detecting more
efficient parameter combinations.
The described UI, allowing to change the DSS
parameters, is thought to be used by expert operators.
In addition, for all other operators, a visualization-
only UI was developed through the Grafana platform.
It allows data visualization on desktop and mobile
devices and is composed of three dashboards, the
main one showing the current system status (Figure
6), another showing past data in a selected time
interval and the last showing “snap-shots” of the main
dashboard plots at a selected past timestamp.
4 DISCUSSION
The results presented in Section 3 indicate that the
developed DSS is already able to give useful insights
to the WWTP operators and to help them in managing
potentially critical events.
The real-time monitoring of measured quantities
gives useful advice to the operator: when the crossing
of a threshold level happens, the flood wave takes
some time (approx. 30 to 90 minutes) to reach the
overflow point, allowing for a timely intervention to
mitigate the risk of overflows. Furthermore, the
system status forecast provides operators with
additional information, guiding them in taking the
proper decision. As an example, if an alert in the UI
suggests a specific strategy related to measured
gz_lt02 threshold crossing, but the forecast is
showing that level is going to decrease soon after, the
operator may decide not to adopt any mitigation
strategy. On the contrary, forecasts of incoming
critical conditions allow to be ready and possibly
anticipate the mitigation manoeuvres. The average
warning time is in fact sufficient for operators to be
ready to adopt proper risk mitigation strategies. In
particular, the most critical events are predicted with
an average warning time of approximately 30 minutes
based on observed rainfall only, while nowcasting
SMARTGREENS 2021 - 10th International Conference on Smart Cities and Green ICT Systems
24

allows for an alert anticipation greater than 100
minutes. The prediction timing is fairly accurate, in
particular for VG level variation, with an average
delay almost always lower than 10 minutes. Based on
these considerations, the implemented ANNs can be
considered helpful tools in the developed DSS.
However, since this is a first stage project, several
improvements may be implemented. First, the ANNs
performance may be enhanced as long as more data
become available, being all collected in the DSS
database. Also, different ANN structures may be
implemented. Recurrent neural networks as the Long
Short-Term Memory (LSTM) ones (Hochreiter and
Schmidhuber., 1997) are particularly suited in
modelling time series and an attempt could be made
using such ANN architecture. Given the DSS
structure, such an operation would not be
complicated. New ANNs can be trained offline, then
if better performances are gained the scripts may be
easily adjusted. Moreover, at the current stage it was
decided not to use a testing set to evaluate the ANNs
performance. The future availability of more records
will allow to perform analyses on unseen data.
Another aspect that should be investigated is
related to rainfall forecasts. As already said,
nowcasting allows to generate alerts with a
reasonable advance. However, in the present study
measured rainfalls were used also as predicted ones,
in a perfect forecast hypothesis. Obviously the actual
nowcasting information could be less accurate and the
effects on level and flow predictions should be
evaluated. This is why it was chosen to keep also the
short-term ANNs in the DSS, as they rely on
measured data which are not affected by
uncertainties.
As regards the risk mitigation strategies, they are
currently suggested in the UI based on the level of the
receiving channel. The four different gate openings
combinations, associated to three VG thresholds
levels, have been discussed with the WWTP
technicians and at this stage are still based on their
long-time experience. However, the hydraulic model
integrated in the DSS allows operators to perform ex-
post simulations, assessing the effectiveness of the
adopted strategy or evaluating the effects of different
gate openings or different threshold levels. On this
basis, the predefined suggested strategies may be
easily changed by expert operators directly in the UI.
Future developments will include the integration of
multi-objective optimization functionalities in the
system, benefitting from the detailed information that
will become available in the database, in order to face
conflicting objectives as the need of sending as much
water as possible to the receiving body while
minimizing the chance of overflows, eventually
obtaining case-specific threshold levels and gate
openings combinations. For example, the premature
filling of the storage area may produce negative
effects during successive intense rainfalls, and
unnecessary lateral spills may result in exceeding the
allowed discharge in surrounding rural channels.
Such improvements could be achieved by integrating
real-time execution of the hydraulic model,
performing simulations based on forecasted variables
and different sets of threshold levels and gate
openings: optimization algorithms will eventually
determine the best combination to face the incoming
events. Finally, when a considerable amount of
available data will allow to accurately understand and
model all the hydraulic processes, the VF gates could
be provided with automated actuators in order to
implement a Real Time Control System.
5 CONCLUSIONS
The case study presented in this paper illustrates a
smart infrastructure project, specifically the design of
a DSS platform able to provide real-time monitoring,
weather nowcasting and forecasts on the status of
some key variables, in the context of managing a
medium-size city wastewater treatment plant. With
respect to the state of the art, a simplified approach
for modelling hydraulic variables based on Artificial
Neural Networks is proposed.
Data are acquired with a 10-minute frequency
from a network of sensors and are stored in a single
database that hosts heterogeneous variables, some of
which are used to perform run-time analyses using
ANNs. These are trained based on past events and can
be updated as more data become available. The
update procedure can be performed “offline”, this
being an important feature of the system design as,
once implemented and calibrated under certain
assumptions, it would be possible to improve the
performance and/or adapt the algorithms to different
conditions without any substantial revision of the
software architecture. Moreover, an automated
update procedure can be foreseen in future
improvements of the proposed system: a script
reading the database with an imposed frequency – e.g.
twice a year – could then process the new acquired
data, add them to the training dataset and perform
again the training procedure, replacing the matrices if
better results are gained.
The DSS was implemented to provide support for
a WWTP with the twofold objective of monitoring
the inlet flow to the plant and reducing the chance of
An Artificial Neural Network-based Real Time DSS to Manage the Discharges of a Wastewater Treatment Plant and Reduce the Flooding
Risk
25

overflow during severe rainfall events. The system
management is further aided by forecasts shown in
the plot window, which provide additional
information about the forthcoming behaviour of key
variables, as predicted by ANNs.
When dealing with Smart City projects, several
challenges arise. It is important to lower the design
and operational costs to increase the probability of
implementation. The handling of heterogeneous data
from multiple sources, the analysis of Big Data and
security-related issues are also to be considered (Silva
et al., 2018). The proposed approach, fulfilling these
requirements, is a valuable step in guaranteeing safety
in a Smart City context and can be in principle
replicated and applied in all those settings where
measurements from different sensors over large areas,
meteorological data, and in general any quantitative
information needs to be processed to provide
synthetic outputs for the final user.
ACKNOWLEDGEMENTS
The study presented in this paper is part of the
INNOVA EFD3 research project financed by A2A
Ciclo Idrico S.p.A.
REFERENCES
Bellon, A., Zawadzki, I., Kilambi, A., Lee, H.C., Lee, Y.H.
and Lee, G., 2010. “McGill algorithm for precipitation
nocasting by Lagrangian extrapolation (MAPLE)
applied to the South Korean radar network. Part I:
Sensitiity studies of the Variational Echo Tracking
(VET) technique.” Asia-Pacific Journal of Atmospheric
Scences 46(3): 369-381.
Botturi, A., Gozde Ozbayram, E., Tondera, K., Gilbert,
N.I., Rouault, P., Caradot, N., Gutierrez, O., Daneshgar,
S., Frison, N., Akyol, C., Foglia, A., Eusebi, A.L. and
Fatone, F., 2020. “Combined sewer overflows: A
critical review on best practice and innovative solutions
to mitigate impacts on environment and human health”.
Critical Reviews in Environmental Science and
Technology, 1-34.
Campisano, A., Creaco, E., and Modica, C., 2016.
“Application of real-time control techniques to reduce
water volume discharges from quality-oriented CSO
devices”. Journal of Environmental Engineering,
142(1), 04015049 1-8.
Carbone, M., Garofalo, G., and Piro, P., 2014.
“Decentralized real time control in combined sewer
system by using smart objects”. Procedia Engineering,
89, 473–478.
Clark, M.P., Bierkens, M.F.P., Samaniego, L., Woods,
R.A., Uijlenhoet, R., Bennett, K.E., Pauwels, V.R.N.,
Cai, X., Wood, A. and Peters-Lidard, C.D., 2017. “The
evolution of process-based hydrologic models:
historical challenges and the collective quest for
physical realism.” Hydrology and Earth System
Sciences 21: 3427-3440.
Hochreiter, S. and Schmidhuber, J., 1997. “Long short-term
memory”. Neural computation, 9(8), 1735-1780.
Jeong, J., Kannan, N., Arnold, J., Glick, R., Gosselink, L.
and Srinivasan, R., 2010. “Development and
integration of sub-hourly rainfall–runoff modeling
capability within a watershed model”. Water Resources
Management, 24(15): 4505-4527.
Lee, H.C., Lee, Y.H., Ha, J.C., Chang, D.E., Bellon, A.,
Zawadzki, I. and Lee, G., 2010. “McGill Algorithm for
Precipitation Nowcasting by Lagrangian Extrapolation
(MAPLE) applied to the South Korean radar network.
Part II: Real-time verification for the summer season.”
Asia-Pacific Journal of Atmospheric Sciences 46(3):
383-391.
Maier, H. R., Jain, A., Dandy G.C. and. Sudheer, K.P.,
2010. “Methods used for the development of neural
networks for the prediction of water resource variables
in river systems: Current status and future directions.”
Environmental modelling & software 25(8): 891-909.
Mandapaka, P.V., Germann, U., Panziera, L. and Hering,
A., 2012. “Can Lagrangian extrapolation of radar fields
be used for precipitation nowcasting over complex
Alpine orography?” Weather and forecasting 27(1): 28-
49.
Panziera, L., Germann, U. Gabella., M. and Mandapaka,
P.V., 2011. “NORA –Nowcasting of Orographic
Rainfall by means of Analogues.” Quarterly Journal of
the Royal Meteorological Society 137(661): 2106-
2123.
Park, T., and Kim, H.A., 2013. “A data warehouse-based
decision support system for sewer infrastructure
management.” Automation in Construction 30: 37-49.
Pereira, A., Pinho, J.L.S., Vieira, J.M.P., Faria, R., and
Costa, C., 2019. “Improving operational management
of wastewater systems. A case study.” Water Science
and Technology 80(1): 173-183.
Rao, M. 2015. “A performance measurement application
for a wastewater treatment plant.” International Journal
of Services and Standards 10(3): 134-147.
Rechdaoui-Guérin, S., Bersinger, T., Bareille, G., Pigop, T.,
Le Hécho, I., Azimi, S. and Rocher, V., 2018.
“Monitoring the quality of effluents in a unitary
sanitation network” Technique-Sciences-Methodes
113: 77-90.
Silva, B. N., Khan, M., and Han, K., 2018. “Towards
sustainable smart cities: A review of trends,
architectures, components, and open challenges in
smart cities”. Sustainable Cities and Society, 38: 697-
713.
US EPA. (2018). Smart data infrastructure for wet weather
control and decision support. EPA 830-B-17-004.
Wilson, J.W., Crook, N.A., Mueller, C.K., Sun, J. and
Dixon, M., 1998. “Nowcasting thunderstorms: A status
report.” Bulletin of the American Meteorological
Society 79(10): 2079-2100.
SMARTGREENS 2021 - 10th International Conference on Smart Cities and Green ICT Systems
26
