
Detecting Non-routine Customer Support E-Mails
Anton Borg
1 a
and Jim Ahlstrand
2
1
Blekinge Institute of Technology, 37179 Karlskrona, Sweden
2
Telenor AB, Karlskrona, Sweden
Keywords:
E-Mail Outliers, Customer Support System, Outlier Detection, Machine Learning, Decision Support.
Abstract:
Customer support can affect customer churn both positively and negatively. By identify non-routine e-mails to
be handled by senior customer support agents, the customer support experience can potentially be improved.
Complex e-mails, i.e. non-routine, might require longer time to handle, being more suitable for senior staff.
Non-routine e-mails can be considered anomalous. This paper investigates an approach for context-based
unsupervised anomaly detection that can assign each e-mail an anomaly score. This is investigated in customer
support setting with 43523 e-mails. Context-based anomalies are investigated over different time resolutions,
by multiple algorithms. The likelihood of anomalous e-mails can be considered increased when identified
by several algorithms or over multiple time resolutions. The approach is suitable to implement as a decision
support system for customer support agents in detecting e-mails that should be handled by senior staff.
1 INTRODUCTION
Maintaining a high-quality and cost-efficient interac-
tion with customers is an important element for any
corporation. Interactions between the organization
and customer via customer support is especially im-
portant, and negative customer support experiences
risk affecting the customers view of the organization
negatively. This might lead to a worse reputation for
the organization. Further, negative experiences with
customer services can either deter potential new cus-
tomers from a company or increase the risk of existing
customers to drop out (Halpin, 2016).
E-mails still account for an important means of
communication due to both its ease and widespread
use (Kooti et al., 2015). As corporations receive
large numbers of customer service e-mails, imple-
menting efficient customer service processes that tar-
get customer E-mail communication is often a neces-
sity. Furthermore, the customers expects quick re-
sponses (Church and de Oliveira, 2013).
Support errands are often sent to a generic cus-
tomer service e-mail address. However, in this set-
ting there are customer support agents with varying
experience. Similarly, the content of the e-mails be-
ing received are of varying complexity. Complex e-
mails, i.e. non-routine, might take longer time to han-
dle given the cognitive load (Rafaeli et al., 2019). As
a
https://orcid.org/0000-0002-8929-7220
such, they might be more suitably handled by senior
customer support agents. Being able to identify non-
routine customer support e-mails would enable senior
customer support agents to focus on non-routine e-
mails, and junior customer support agents to focus on
routine e-mails. Given that routine e-mails can be in-
terchanged with normal e-mails, non-routine e-mails
can be considered anomalous. As such, this paper
investigates an approach for detecting anomalous e-
mails.
The study is conducted with one of the bigger tele-
com operators in Europe with over 200 million cus-
tomers worldwide, and some 2.5 million in Sweden.
E-mail based customer support is one of the primary
means of resolving issues customers experience. The
company utilizes a semi-automated customer service
E-mail management system to sort and handle sup-
port errands. Customer service E-mails, provided by
the telecom company, contains support errands with
different topics. As such, an E-mail topic could be
sorted as Invoice, TechicalIssue, and Order.
What can be considered anomalous in this setting
is context-dependant and affected by different factors,
e.g. campaigns conducted or system roll-outs. Con-
sequently, what can be considered anomalies is con-
textual (Chandola et al., 2009). I.e. an e-mail consid-
ered anomalous during a week might not be consid-
ered anomalous during a longer time period. Another
challenge is that the data available is unlabeled, i.e.
Borg, A. and Ahlstrand, J.
Detecting Non-routine Customer Support E-Mails.
DOI: 10.5220/0010396203870394
In Proceedings of the 23rd International Conference on Enterprise Information Systems (ICEIS 2021) - Volume 1, pages 387-394
ISBN: 978-989-758-509-8
Copyright
c
2021 by SCITEPRESS – Science and Technology Publications, Lda. All rights reserved
387

no labeled anomalies exists. As such, this study in-
vestigates unsupervised approaches to context-based
anomaly detection and discusses how such an ap-
proach might be implemented in a customer support
system.
2 RELATED WORK
The overlap between outlier detection and anomaly
detection should be pointed out, and the terms are
often used interchangeably (Chandola et al., 2007;
Chandola et al., 2009). While anomaly detection is an
active research area, the research has mostly focused
on areas e.g. intrusion detection, traffic analysis, fault
detection, or fraud detection (Chandola et al., 2007;
Chandola et al., 2009).
Document anomaly detection has been suggested
for detecting anomalies among e.g. web sites using
document clustering (Friedman et al., 2007). But it
has also been used to detect novel topics in docu-
ments, e.g. news data (Allan et al., 1998).
A contextual anomaly is a data point that is only
considered anomalous in a certain context, e.g. a
subset of the data or from within a certain feature
set (Chandola et al., 2009). The same data point can
be considered normal in another context. This type of
anomaly detection has been investigated in e.g. time
series, where seasonality can affect normality (Chan-
dola et al., 2009). Contextual anomalies can be com-
pared to point anomalies and collective anomalies. In
the former a data point is considered an anomaly com-
pared to the whole dataset, and in the latter a col-
lection of related data points are considered anoma-
lous compared to the whole dataset (Chandola et al.,
2009).
Semantic anomaly detection has been investigated
to detect normal and abnormal documents. This has
used SVM to model normal documents based on se-
mantic features, and then classify new documents as
on- or off-topic based on their semantic similarity to
normality (Yilmazel et al., 2005). Semantic features
include e.g. entities and named entities.
There is, to the best of the authors knowledge, lit-
tle research on how to detect context-based anoma-
lies, routine, or non-routine e-mails in customer sup-
port settings.
Figure 1: Topic distribution. Dashed line denotes threshold
of 5000 e-mails.
Table 1: Example E-mail with multiple classes (Borg et al.,
2020). The keyword-based rule system could make the fol-
lowing associations: terminate, termination → Simcardcan-
cellation.
Header
Sent 2031-02-31 08:00:00
Thread 234
Mail 3
From customer service@company.org
Content
Subject RE Termination
Content Hello Ralph, Thank you for your email.
Do they want us to terminate the subscrip-
tion immediately, so they are left without a
subscription or shall we set a future termi-
nation date so that they are able to port their
numbers?
Please get back to us. Have a nice day.
Class Simcardcancellation
3 METHODOLOGY
3.1 Data
The dataset consists of 333700 e-mails in 68238
threads, divided over 36 different topics. Figure 1
shows the number of e-mails for each topic. The most
frequent topic is DoNotUnderstand, followed by In-
voice. DoNotUnderstand contains e-mails that the
classifier is unable to correctly classify, and as such
can contain a vast number of topics. The investiga-
tion in this study is focused on the invoice class, as it
is the highest homogeneous class.
The Invoice topic consists of 78386 e-mails. The
features available in the dataset is the subject, content,
sent time, from address, mail id, and thread id. The
data set does not contain any label concerning anoma-
lies.
3.2 Preprocessing
The content has been anonymized by removing num-
bers (e.g. phone nr, invoice nr, etc), names and other
ICEIS 2021 - 23rd International Conference on Enterprise Information Systems
388

identifying content. Further, header information and
attachments have also been removed.
While, the content of the e-mails are primarily
written in Swedish, other languages can exist in the
dataset. The customer support e-mails are from cor-
porate clients, i.e. no individual customers. This
should be noted as it affects the manner of how the
e-mails are written, i.e. a more formal or professional
writing style is expected.
From this subset, e-mails from the customer sup-
port agents are removed. I.e. only e-mails from cus-
tomers are kept. The resulting dataset consists of
43523 e-mails in 21866 threads. Swedish stop words
have been removed from the e-mail content
1
.
The data is divided into multiple subsets based on
their date. The data is divided into 12 one month peri-
ods and from each month a one week subset were ex-
tracted. This chronological division is chosen instead
of e.g. 10-fold cross-validation to adjust for seasonal-
ity (Chandola et al., 2009). The time periods were
chosen in collaboration with domain experts. The
resulting data sets consists of 12 month sets and 12
week sets.
For each data set, the text were represented as
a bag-of-words using a term-frequency and inverse
document frequency (TF-IDF) vectorizer, where the
words have been transformed into uni-, bi-, and tri-
grams (I.H. Witten and Hall, 2011). A TF-IDF algo-
rithm weights each word based on the term frequency,
i.e. how frequent each word is in each document, and
the inversed document frequency, i.e. the inverse frac-
tion of documents that contain the word. The term
frequency indicates if a word is indicative of a docu-
ment and the inverse document frequency normalizes
each word according to how frequent it is occurring
in all documents.
3.3 Algorithms
Several algorithms for anomaly detection are investi-
gated in this paper, the majority of which is available
through PyOD (Zhao et al., 2019). The algorithms
has been chosen because the work according to differ-
ent assumptions, or have different weaknesses. When
of relevance, the assumptions or weaknesses are de-
scribed below.
MINISOM
2
is an implementation of Self Organiz-
ing Maps (SOM), that can be used for outlier detec-
tion (Vettigli, ). SOM is an unsupervised Artificial
1
https://gist.github.com/peterdalle/
8865eb918a824a475b7ac5561f2f88e9
2
https://github.com/JustGlowing/minisom/blob/master/
minisom.py
Neural Network. It is also able to conduct dimension
reduction.
K-Means-based anomaly detection, denoted K-
means Outlier detector (KOD) significance levels.
The assumption for both KOD and MiniSOM is that
normal data instances lie close to their closest clus-
ter centroid. Anomalies, on the other hand, lies
further from the cluster centroid (Chandola et al.,
2009). KOD, however, is unable to locate anoma-
lies if the anomalies are grouped as small clusters of
their own (Chandola et al., 2007). Using K-means
for anomaly detection has been done previously, e.g.
by calculating a distance-based outlier score (Pamula
et al., 2011). The implementation used in this paper
computes the likelihood (p-value) of an instance be-
ing an anomaly based on the standard deviation from
the cluster center. Significance levels of 0.05 and 0.1
are used. The number of clusters is set to k = 5 after
a manual investigation of the data.
Local Outlier Factor (LOF), measures the local
deviation of density for a instance compared to its k
nearest neighbors (Chandola et al., 2009; Zhao et al.,
2019). The algorithm assumes a certain amount of
contamination, i.e. number of anomalies, when set-
ting the threshold of the decision function. This is left
to the default value of 0.1.
Connectivity-Based Outlier Factor (COF), is sim-
ilar to LOF, but rather looking at the k-nearest neigh-
bors of the instance, the neighborhood is increased in-
crementally k times and each time the instance near-
est the neighborhood is added (Chandola et al., 2009;
Zhao et al., 2019). A contamination value of 0.1 is
used.
Stochastic Outlier Selection (SOS), is based on the
concept of affinity. Affinity is defined as a decreasing
function of the dissimilarity value. Each instance have
a certain affinity for other instances, i.e. an affinity
distribution. All instances simultaneous decide which
instances they have the highest affinity towards, i.e.
chosen by an instance. Instances which do not get
chosen are considered outliers (Janssens et al., 2011).
This is repeated to get the probability of an outlier
being true. A contamination value of 0.1 is used.
One-class SVM, is a kernel based functions where
the model learns what is normal data, delineated
by a learnt boundary. Instances considered outside
of the normal data boundary is considered anoma-
lous (Chandola et al., 2009). A contamination value
of 0.1 is used.
Isolation Forest is built on the assumptions that
trees constructed from anomalies will be different
from trees constructed from normal data, with regard
to tree number of splits and nodes (Zhao et al., 2019).
A contamination value of 0.1 is used.
Detecting Non-routine Customer Support E-Mails
389

3.4 Experiment Setup
Two experiments are conducted based on the two time
resolutions, month and week.
The first experiment investigates anomalies using
a month resolution. In the preprocessing stage, the
TF-IDF algorithm were applied to each data set inde-
pendently, as opposed to a global bag-of-words rep-
resentation. This ensures that any context-shift that
might have occurred over time do not affect the cur-
rent data. For a data set, the algorithms described in
Section 3.3 were run and which instances were con-
sidered anomalies by the different algorithms saved.
The second experiment is similar to the first, but in-
stead uses data sets based on the week resolution.
Since this data set is not labeled, i.e. there is no
known anomalies, using traditional evaluation met-
rics (i.e. quantitative) is difficult. Further, given that
context-based anomaly detection is investigated, the
labels might have changed given e.g. the time resolu-
tion. Instead algorithm agreement and visualization is
used to evaluate the anomalies detected. Manual veri-
fication of random anomalies in their context has also
been done in cooperation with domain experts.
The anomalies are visualized in two ways. First,
data sets were visualized in a 2D space with normal
instances along with anomalies detected by different
algorithms. The dimensional reduction is done us-
ing T-SNE (Maaten and Hinton, 2008). Second, The
results are visualized using Upset Plots (Lex et al.,
2014). Upset plots are used instead of Venn dia-
gram and help visualize the uniqueness and overlap
between algorithms with regard to anomalies found.
For each time resolution, an upset plot of the mean
overlap is constructed.
Algorithm agreement denotes the number of
anomalies that are shared between algorithms for a
data set. Anomalies detected by multiple algorithms
are considered stronger anomalies. Similarly, anoma-
lies detected by only one algorithm is considered a
weak anomaly. This is similar to the approach used
by Boldt et al. (Boldt et al., 2020).
Finally, anomalies shared over time resolutions
are shown. The assumption being that if an instance is
identified as an anomaly in both a shorter and longer
time resolution, the likelihood of it being an anomaly
increase (Boldt et al., 2020).
4 RESULTS
The results are divided into two subsections. The first
subsection presents the results for the outlier detection
for the month resolution along with the mean results.
The second, similarly, presents the results but for the
week resolution.
4.1 Month
One of the data sets investigated can be seen, visu-
alized in a 2D space, in Figure 2a. The outliers sug-
gested by the algorithms investigated are shown in the
2D-space, denoted using different colors and mark-
ers. Non outliers are shown as grey dots. In this
example, e.g. Isolation Forest and One-class SVM
seems to suggest anomalies located in denser clus-
ters, whereas COF seems to suggest a sparser, more
spread out solution. However, this might be a result of
the dimensional reduction and, given another way of
reducing the dimensions, should be generalized from
with some scepticism. A qualitative investigation of
the found anomalies for Isolation forest suggests that
there are indeed three clusters of detected outliers.
As can be seen in Figure 2b, the results suggests
that for most algorithms the suggested outliers are not
shared with other algorithms. Columns with lines
between point/rows indicate that n instance are con-
sidered anomalies by the algorithms denoted by the
points. A column with a single point indicates that the
outliers found aren’t found by any other algorithm.
E.g. for Isolation Forest, out of 203 anomalies, only
39 are designated outliers by, at least, one other algo-
rithm. The numbers are higher for other algorithms.
However, e.g. LOF and COF agree on 50 data points,
which might be because of the similar approach for
the two algorithms. It should also be noted that K-
means 0.1 only found shared anomalies, which can
be considered stronger anomalies. K-means 0.05 and
SOS found no anomalies.
As Figure 2 only shows an example month, it
doesn’t give an overview of all month data sets.
To give an overview of detected anomalies over all
twelve month data sets, an mean Upset plot was cre-
ated. This plot can be seen in Figure 3. The bars on
top and to the left denotes mean anomalies and can
be interpreted similar to Figure 2b. However, the top
bars also show error bars denoting the standard devia-
tion for each bar. As can be seen in the sixth column,
K-means anomaly 0.1 have a large standard deviation,
indicating that the algorithm vary a lot with regards
to the number of anomalies detected for the different
data sets. Similar results can also be seen for the over-
laps between different algorithms. However, e.g. in
the case of COF and One-Class SVM, it might be ex-
pected that algorithms do not detect the same outliers,
as they are from different families of algorithms.
ICEIS 2021 - 23rd International Conference on Enterprise Information Systems
390
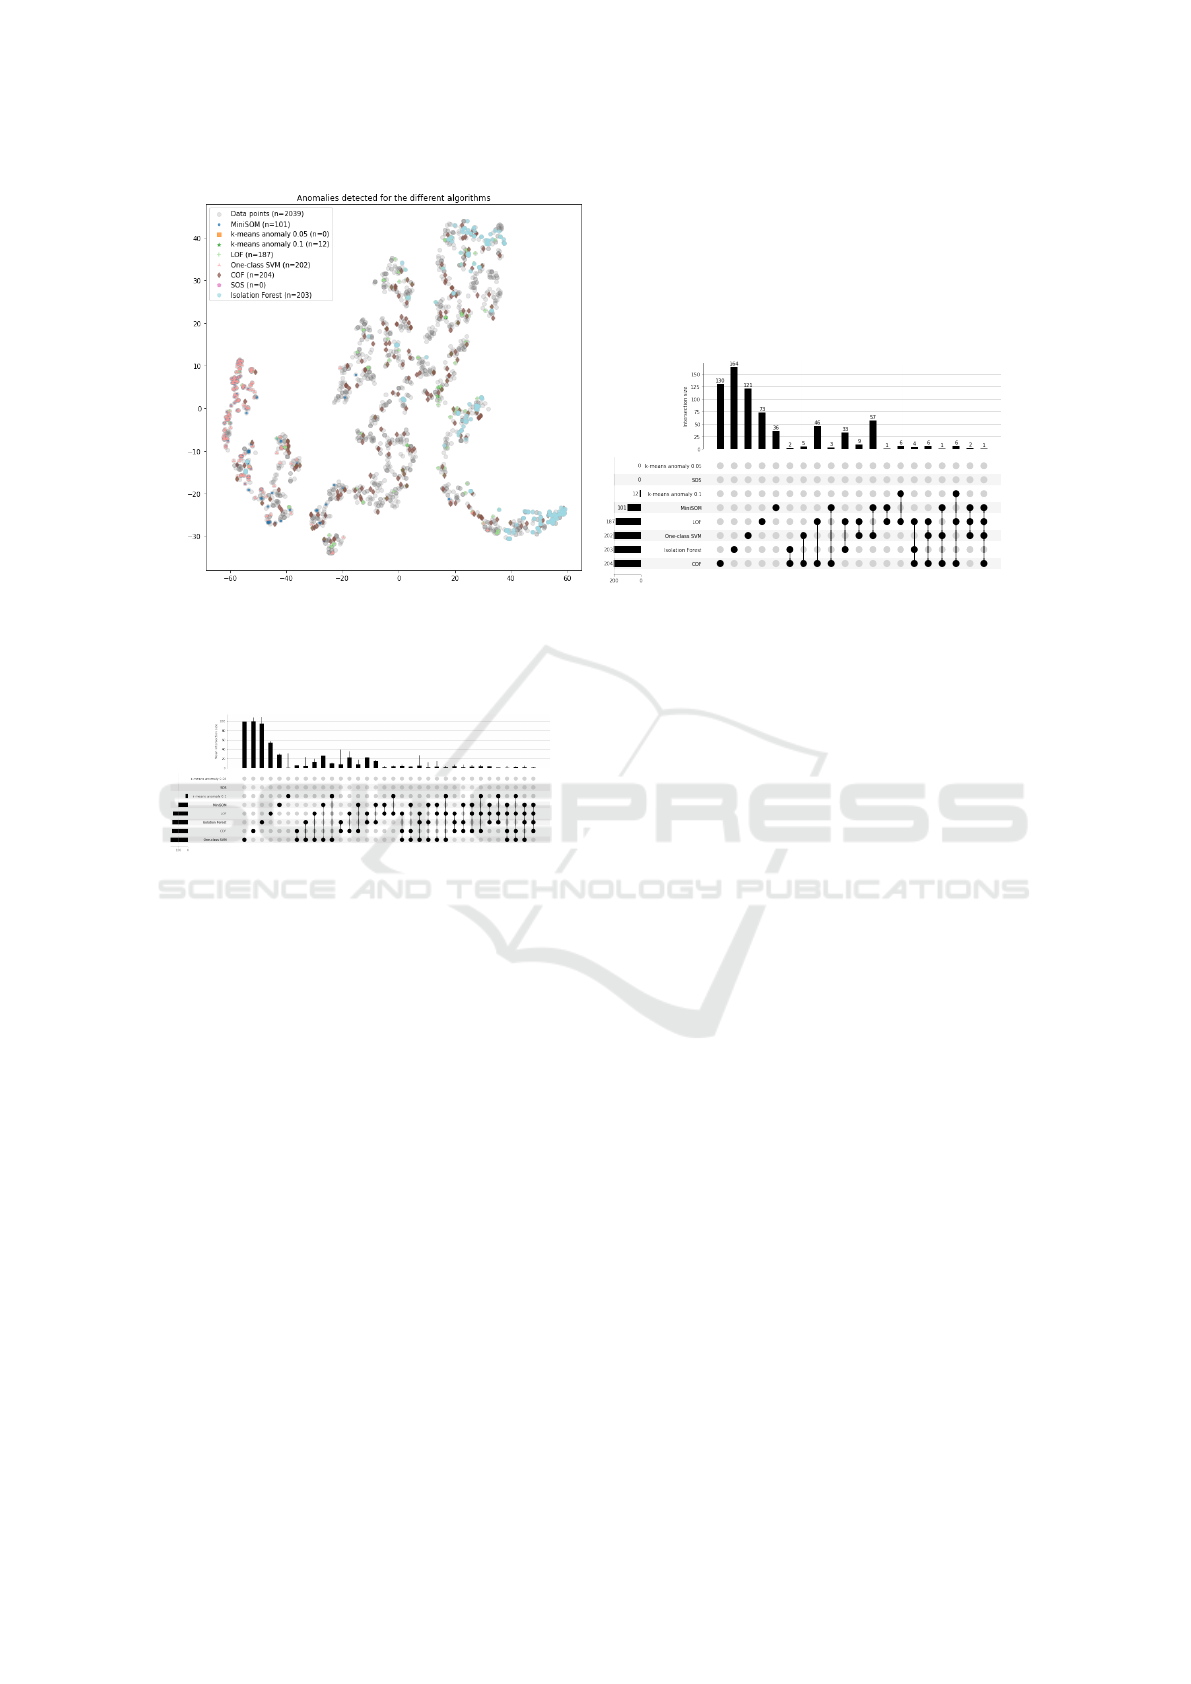
(a) Data points plotted together with found outliers for
an example month. Dimensional reduction by using T-
SNE. Colors denote algorithm.
(b) Upset plot showing number of outliers found for each
algorithm, as well as to what extent algorithms denoted
the same data points as outliers.
Figure 2: Example of findings for a random month data set.
Figure 3: The mean upset plot for all month data sets.
4.2 Week
Anomalies in a week time span is shown similar to
the results of the month data set. Figure 4a shows
a 2D visualization of the data-points and the anoma-
lies detected by the different algorithms for an ran-
dom week data set. E.g. Isolation Forest seem to have
found at least one denser area of anomalies. Similar
to Figure 2b, Figure 4b indicates that a majority of
the anomalies detected are only detected by one al-
gorithm, i.e. the number of shared outliers is quite
low. MiniSOM detected anomalies shared with other
algorithms for 75% of the anomalies found, increas-
ing the likelihood of them actually being outliers. The
K-means based algorithm did not detect any anoma-
lies.
Similar to Figure 3, Figure 5 shows the mean find-
ings for the week data sets. The results indicates that
there is a larger overlap between algorithms for week
data sets, indicated by the higher number of columns
(34 columns for Figure 3 and 43 columns for Fig-
ure 5). The error bars shown in Figure 5 are also
larger compared to the month data set. Both of these
findings can indicate that there is a larger variation
between the data sets, i.e. the email contents tend to
differ between different weeks.
4.3 Combined Results
The idea of strengthening the anomaly detection by
investigating anomalies over different temporal res-
olutions has been done before (Boldt et al., 2020).
Given a longer time span, the context which the
anomaly has been detected in is different. Conse-
quently, if an data point is considered anomalous in
both time resolutions (i.e. contexts) the certainty of
the prediction is increased. Similarly, a data point
that is considered anomalous by several different
types of algorithms could be considered a more likely
anomaly.
Anomalies detected by several different algo-
rithms has been shown to exist in e.g. Figure 2b and
Figure 4b. In Figure 6a the anomalies found by at
least two and three algorithms are visualized. This
is for the same data set as used in Figure 4. What
is possible to discern from this picture, and looking
at the data, is that, for most anomalies, the anoma-
lies detected by three algorithms are a subset of the
ones detected by two algorithms. I.e. the emails are
from the same thread where some might be consid-
ered more anomalous than others (detected by more
algorithms). It should be noted that there are emails
in the threads not considered anomalous.
Similarly, Figure 6 visualizes anomalies detected
in both a week and month context. Additionally, the
Detecting Non-routine Customer Support E-Mails
391
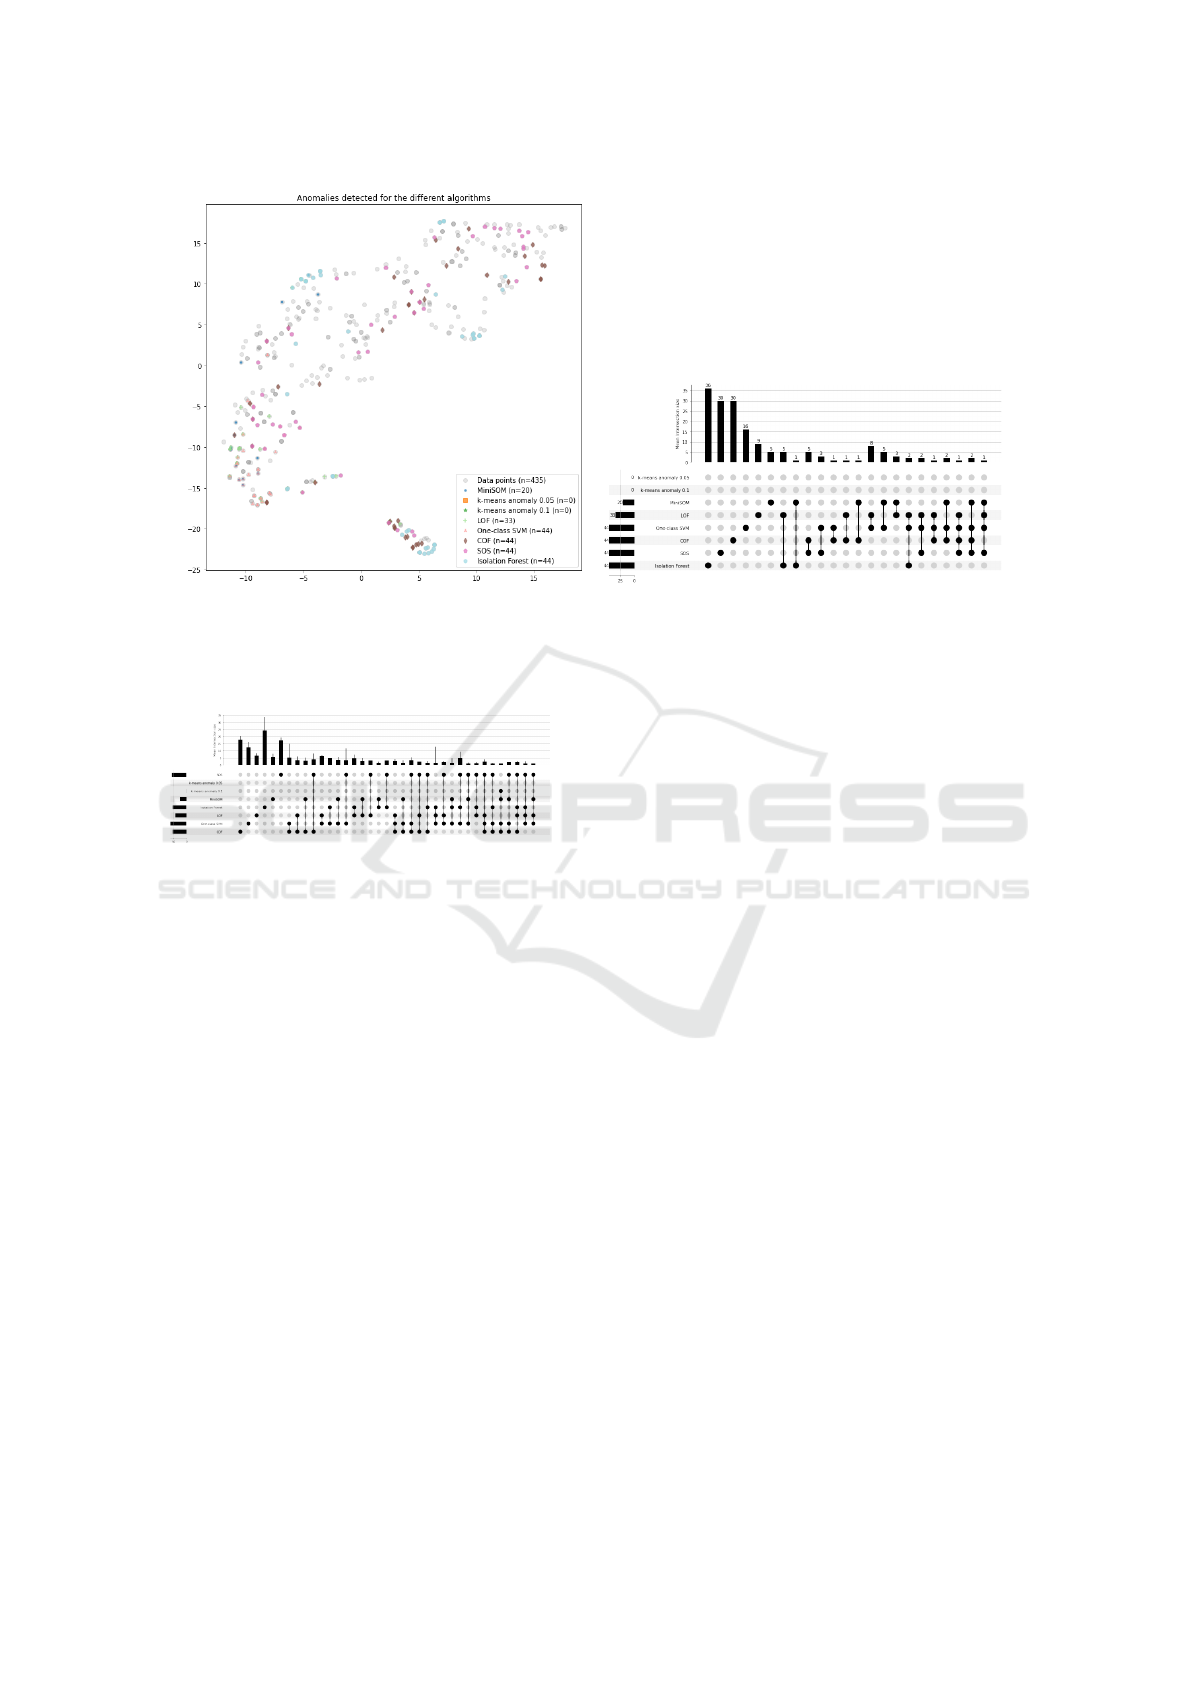
(a) Data points plotted together with found outliers for an
example week. Dimensional reduction by using T-SNE.
Colors denote algorithm.
(b) Upset plot showing number of outliers found for each
algorithm, as well as to what extent algorithms denoted
the same data points as outliers.
Figure 4: Example of findings for a random week data set.
Figure 5: The mean upset plot for all week data sets.
anomalies are colored according to the number of al-
gorithms that have detected it. There are 83 anoma-
lies detect in both time resolutions by at least one al-
gorithm (out of 2039 data points). 12 anomalies are
detected by at least two algorithms, and one anomaly
is detect by at least three algorithms. Similar results
can be seen for all the data sets in Table 2.
5 ANALYSIS & DISCUSSION
Different anomaly detection algorithms are based on
different assumptions. As such, having multiple types
of algorithms investigate anomalies enables anoma-
lies to be found from different point-of-views (e.g.
based on different assumptions). Anomalies detected
by multiple algorithms could as such be considered
stronger anomalies. Similarly, anomalies detected
in multiple time resolutions might also be consid-
ered as stronger anomalies. As the type of contents
change over different weeks the context from week
to week might be different. Similarly, the context
over a month might be different from the context of
weeks within that month. As such, anomalies de-
tected in multiple time resolutions could be consid-
ered stronger candidates as they are anomalies in mul-
tiple contexts (Boldt et al., 2020).
It should be noted that LOF, One-class SVM,
COF, SOS and Isolation forests uses the contamina-
tion parameter to set the threshold on the decision
function. This is an assumption on the proportion of
outliers in the dataset. In this case it is left to it’s
default value, i.e. 0.1. Consequently, a weakness of
these algorithms are that they require the user to have
some sort of knowledge about the level of contami-
nation in the data. This is of course not feasible in
a live setting, especially a customer support system
where the contamination can differ between different
topics. Further, this assumes that there actually exists
anomalies in the dataset. As can be seen in Figure 4,
this is not certain. Both K-means 0.05 and K-means
0.1 report zero anomalies, and MiniSOM reports 20.
Implementing anomaly detection in a customer
support system could be done as a scoring system,
where a point is awarded for each time resolutions
the anomaly is detected in and for each algorithm the
anomaly is detected by. A data point can be awarded
between 0 − 2 point for the time resolutions and be-
tween 0 − 8 for the algorithms. A data point can as
such have a score between 0 and 10. In practice it is
unlikely that an anomaly will get a score of 10, Fig-
ure 6 shows that one anomaly with a score of 5, and
12 anomalies with a score of 4 have been found. By
using this approach, it is possible to implement a scor-
ing system for e-mails in a customer support setting.
ICEIS 2021 - 23rd International Conference on Enterprise Information Systems
392
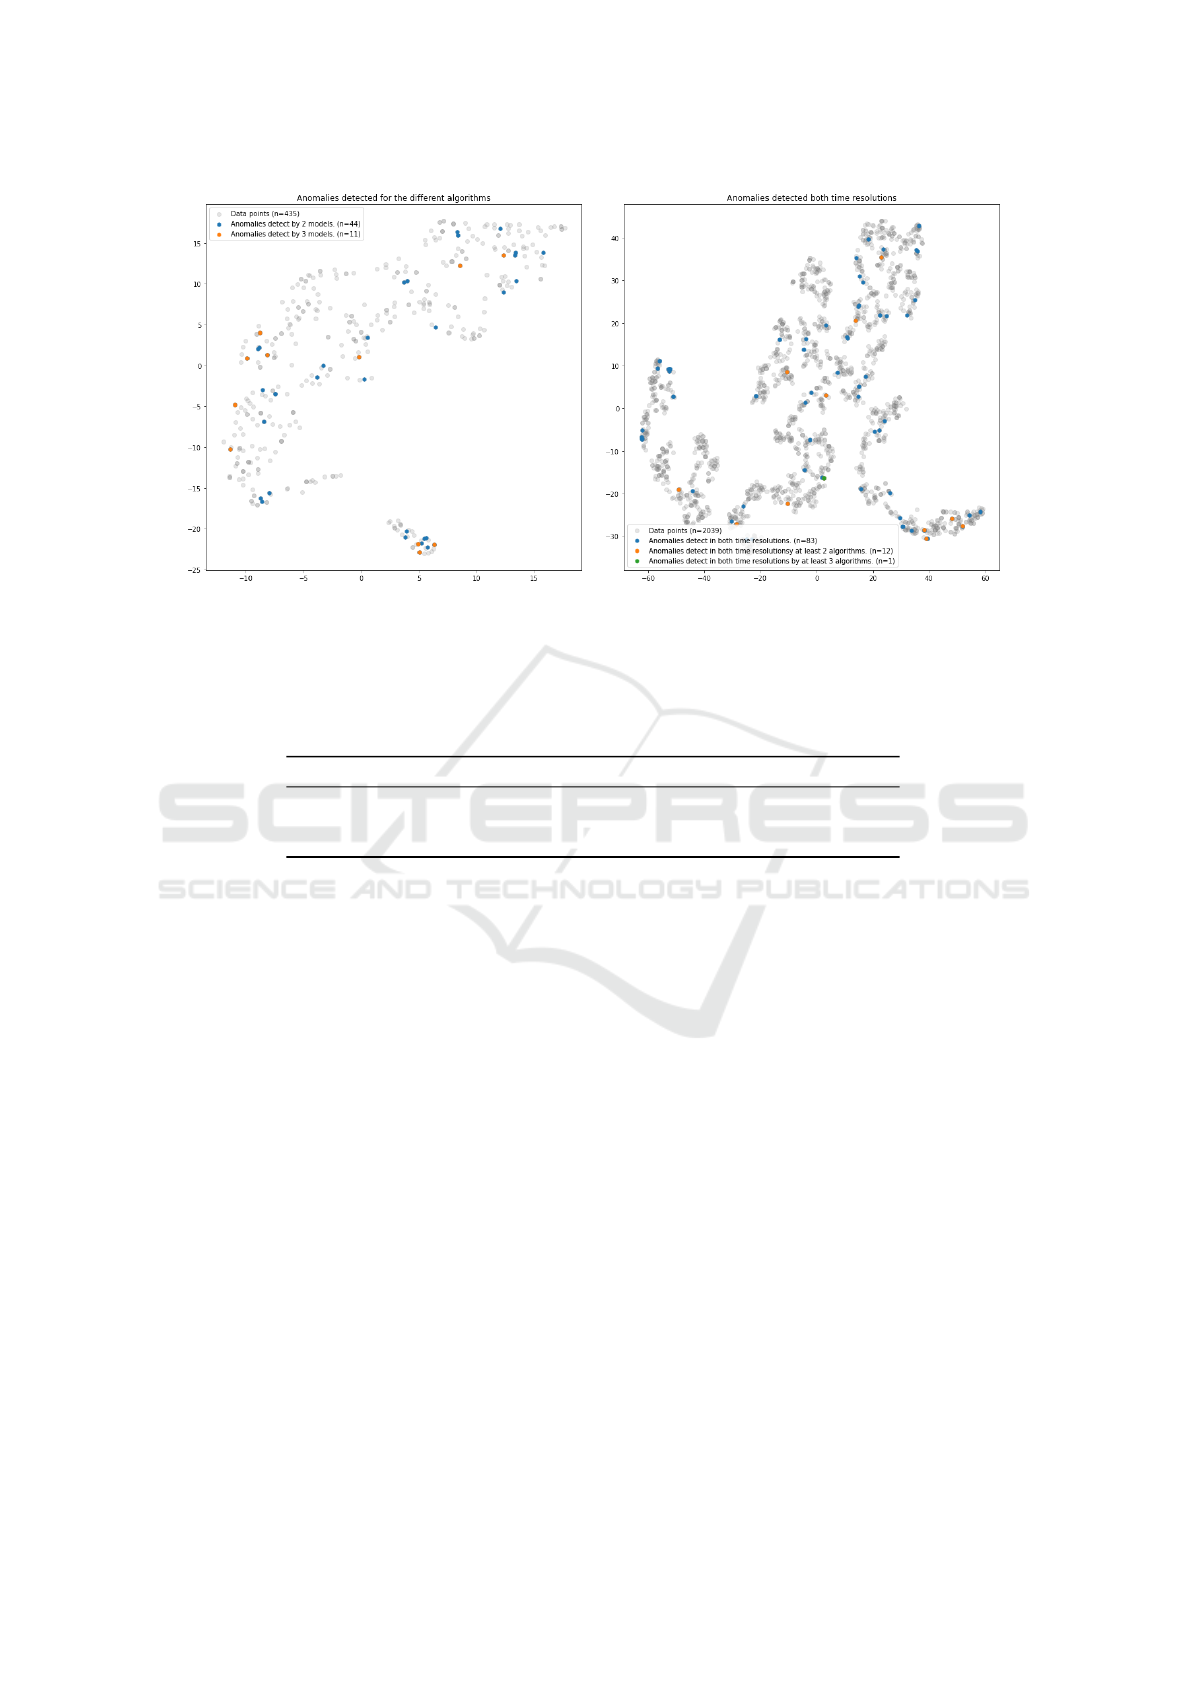
(a) Example week showing outliers detected by at least
two and three algorithms.
(b) Example month showing outliers detected in both
week and month data sets. Number of shared algorithms
denoted by color.
Figure 6: Data points plotted together with found outliers for an example week and month.
Table 2: Anomalies detected in both Week and Month dataset. +2 and +3 denotes anomalies detected by more than one and
two algorithms respectively in each time resolution. A +1 anomaly is only detected by one algorithm in each time resolution.
Nr of alg. D
1
D
2
D
3
D
4
D
5
D
6
D
7
D
8
D
9
D
10
Mean
+1 83 16 74 89 74 54 52 87 83 36 64.8
+2 12 2 5 9 14 10 12 10 10 3 8.7
+3 1 0 2 0 1 0 0 2 0 2 0.8
A higher score would indicate a likelier anomaly, and
as such should be directed to a more experienced cus-
tomer support agent.
Given different kinds of data, algorithms might
be more or less suited for the problem. By using a
combined algorithm approach, i.e. an ensemble ap-
proach (Flach, 2012), where scores are utilized to
highlight anomalies, algorithms unsuited for the data
set will be marginalized by the combined findings of
algorithms suited for the data set. However, it is quite
possible that an anomaly detected by just one algo-
rithm should be on par with an anomaly detected by
multiple algorithms. As such, they shouldn’t be dis-
carded.
When inspecting the found anomalies, a minor-
ity of the e-mails are spam messages that were not
caught by the spam filter. Consequently, single mes-
sage threads that are considered anomalies could be
also be investigated as spam again, either manually
or automatic. This would be an additional benefit to
customer support agents, as context switching, man-
ually reading e-mails, and then discarding spam mes-
sages could become a workload bottleneck (Woods
et al., 2002). Especially as complex messages can put
an increased cognitive load on the customer support
agents (Rafaeli et al., 2019).
6 CONCLUSION & FUTURE
WORK
This paper has investigated an approach for anomaly
detection in an e-mail based customer support set-
ting. The suggested approach utilizes two different
assumptions. First, different time resolutions to inves-
tigate anomalies in different contexts. And second,
different types of anomaly detection algorithms to in-
vestigate anomalies based on different assumptions.
By assigning scores to the anomalies found, depend-
ing on the number of algorithms detected the anomaly
and in how many time resolutions it was detected, the
likelihood of an anomaly is quantified. This would
enable senior customer support agents to focus on e-
mails that are considered highly anomalous, i.e. non-
normal, and junior customer support agents to focus
on routine, i.e. normal, e-mails.
Future work is two fold. First, implementing and
Detecting Non-routine Customer Support E-Mails
393

evaluating the practical use of this approach as a de-
cision support system. Second, investigating the pos-
sibility of predicting the likelihood that an e-mail in
a thread is an anomaly. As an e-mail thread becomes
larger, it would then be possible to assign a senior cus-
tomer support agent to the e-mail thread before it be-
comes anomalous. And thus, possibly, improving the
customer support experience for the customer.
REFERENCES
Allan, J., Carbonell, J. G., Doddington, G., Yamron, J., and
Yang, Y. (1998). Topic detection and tracking pilot
study final report.
Boldt, M., Borg, A., Ickin, S., and Gustafsson, J. (2020).
Anomaly detection of event sequences using multiple
temporal resolutions and markov chains. Knowledge
and Information Systems, 62(2):669–686.
Borg, A., Ahlstrand, J., and Boldt, M. (2020). Predicting
e-mail response time in corporate customer support.
In Proceedings of the 22nd International Conference
on Enterprise Information Systems - Volume 1: ICEIS,
volume 1, pages 305–314.
Chandola, V., Banerjee, A., and Kumar, V. (2007). Outlier
detection: A survey. ACM Computing Surveys, 14:15.
Chandola, V., Banerjee, A., and Kumar, V. (2009).
Anomaly detection: A survey. ACM Comput. Surv.,
41(3).
Church, K. and de Oliveira, R. (2013). What’s up with
whatsapp?: Comparing mobile instant messaging be-
haviors with traditional sms. In Proceedings of the
15th International Conference on Human-computer
Interaction with Mobile Devices and Services, Mo-
bileHCI ’13, pages 352–361, New York, NY, USA.
ACM.
Flach, P. (2012). Machine learning: the art and science of
algorithms that make sense of data. Cambridge Uni-
versity Press.
Friedman, M., Last, M., Makover, Y., and Kandel, A.
(2007). Anomaly detection in web documents using
crisp and fuzzy-based cosine clustering methodology.
Information Sciences, 177(2):467 – 475.
Halpin, N. (2016). The customer service report: Why great
customer service matters even more in the age of e-
commerce and the channels that perform best.
I.H. Witten, E. F. and Hall, M. (2011). Data Mining - Prac-
tical Machine Learning Tools and Techniques (3rd
ed.). Elsevier.
Janssens, J. H., Postma, E. O., and van den Herik, J. H.
(2011). Maritime anomaly detection using stochastic
outlier selection. In MAD 2011 Workshop Proceed-
ings, page 121. Citeseer.
Kooti, F., Aiello, L. M., Grbovic, M., Lerman, K., and
Mantrach, A. (2015). Evolution of conversations in
the age of email overload. In Proceedings of the 24th
International Conference on World Wide Web, WWW
’15, pages 603–613, Republic and Canton of Geneva,
Switzerland. International World Wide Web Confer-
ences Steering Committee.
Lex, A., Gehlenborg, N., Strobelt, H., Vuillemot, R., and
Pfister, H. (2014). Upset: Visualization of intersecting
sets. IEEE Transactions on Visualization and Com-
puter Graphics, 20(12):1983–1992.
Maaten, L. v. d. and Hinton, G. (2008). Visualizing data
using t-sne. Journal of machine learning research,
9(Nov):2579–2605.
Pamula, R., Deka, J., and Nandi, S. (2011). An outlier de-
tection method based on clustering. Emerging Appli-
cations of Information Technology, International Con-
ference on, 0:253–256.
Rafaeli, A., Altman, D., and Yom-Tov, G. (2019). Cog-
nitive and emotional load influence response time of
service agents: A large scale analysis of chat service
conversations. In Proceedings of the 52nd Hawaii In-
ternational Conference on System Sciences.
Vettigli, G. Minisom: minimalistic and numpy-
based implementation of the self orga-
nizing map. GitHub.[Online]. Available:
https://github.com/JustGlowing/minisom/.
Woods, D., Patterson, E. S., and Roth, E. M. (2002). Can we
ever escape from data overload? A cognitive systems
diagnosis. Cognition, Technology & Work, 4:22–36.
Yilmazel, O., Symonenko, S., Balasubramanian, N., and
Liddy, E. D. (2005). Leveraging one-class svm and
semantic analysis to detect anomalous content. In In-
ternational Conference on Intelligence and Security
Informatics, pages 381–388. Springer.
Zhao, Y., Nasrullah, Z., and Li, Z. (2019). Pyod: A python
toolbox for scalable outlier detection. Journal of Ma-
chine Learning Research, 20(96):1–7.
ICEIS 2021 - 23rd International Conference on Enterprise Information Systems
394
