
Malware Detection for IoT Devices using Automatically Generated
White List and Isolation Forest
Masataka Nakahara, Norihiro Okui, Yasuaki Kobayashi and Yutaka Miyake
KDDI Research, Inc., 2–1–15, Ohara, Fujimino-shi, Saitama, Japan
Keywords:
IoT Security, Malware, Anomaly Detection, Machine Learning, White List.
Abstract:
The number of cyber-attacks using IoT devices is increasing with the growth of IoT devices. Since the number
of routes malware infection is increasing, it is necessary not only to prevent infection but also to take measures
after infection. Therefore, high-performance detection techniques are required, but many existing technologies
require large amounts of data and heavy processing. Then, there is a need for a system that can detect mal-
ware infection while reducing the processing load. Therefore, we have proposed an architecture for detecting
malware traffic using flow data of packets instead of whole packet information. We performed the malware
traffic detection on the proposed architecture by using machine learning algorithms focusing on the behavior
of IoT devices, and could detect malware with some degree of accuracy. In this paper, in order to improve
the accuracy, we propose a hybrid system using machine learning and the white list automatically generated
using the rule of Manufacturer Usage Description (MUD). The white list eliminates benign packets from the
target of malware traffic detection, and it can decrease the false positive rate. We evaluate the performance of
proposed method and show the effectiveness.
1 INTRODUCTION
The number of IoT devices has been increasing
rapidly, and they are being used in various fields such
as industry, agriculture and the home (Hassija et al.,
2019; Mohanapriya et al., 2020; Fortino et al., 2020;
Zulkipli et al., 2017). Accordingly, the target of cy-
ber attacks is changing from traditional IT devices
such as PCs and smartphones to IoT devices (Abdalla
and Varol, 2020). For example, in 2016, Mirai cre-
ated a botnet of more than 2.5 million units and si-
multaneously generated 620 Gbps and 1.1 Tbps Dis-
tributed Denial of Service (DDoS) attacks (Hassija
et al., 2019; Kolias et al., 2017; Antonakakis et al.,
2017). In addition, there are other examples of botnets
built by IoT devices with high power consumption to
attack the power grid, and smart grids are more prone
to cyberthreats. (Soltan et al., 2018; Kimani et al.,
2019; Jung et al., 2019; Ahmed et al., 2019).
As the number of devices increases, these
threats become more significant, and countermea-
sures against malware infection become more impor-
tant. Many of these existing security products are spe-
cialized for preventing infection, such as URL block-
ing and intrusion detection. On the other hand, the
number of routes of malware infection is increasing
on daily basis, for example, some IoT devices may
already be infected with malware at the time of pur-
chase, depending on the purchase route. Therefore, in
addition to preventing infection, post-infection detec-
tion is also necessary.
It is also difficult to take security measures for
IoT devices by typical methods such as installing anti-
virus software on each device because the processing
performance of the devices is lower and the number
of devices in use is larger than that of conventional
devices. Therefore, other security measures, such
as managing multiple devices in a centralized archi-
tecture, are being considered (Nguyen et al., 2019).
Centralized architecture generally requires high pro-
cessing resources, but considering the increase of the
number of IoT devices, it is desirable to be able to
take measures with as little processing load as possi-
ble. On the other hand, there are some cases where it
is difficult to detect malware infected devices. For ex-
ample, communication with a Command and Control
(C&C) server before carrying out a DDoS attack is
challenging to distinguish from the original commu-
nication of the device by light-weight processes such
as threshold determination of the number of packets.
Based on the above, we have proposed a system
for post-malware infection detection, in which the
38
Nakahara, M., Okui, N., Kobayashi, Y. and Miyake, Y.
Malware Detection for IoT Devices using Automatically Generated White List and Isolation Forest.
DOI: 10.5220/0010394900380047
In Proceedings of the 6th International Conference on Internet of Things, Big Data and Security (IoTBDS 2021), pages 38-47
ISBN: 978-989-758-504-3
Copyright
c
2021 by SCITEPRESS – Science and Technology Publications, Lda. All rights reserved

communication flow information is aggregated at the
gateway to which the device is connected, and for-
warded to an analysis server to detect the infection
(Nakahara et al., 2020). Our system has an analysis
server outside the local network in order to analyze
the characteristics of the communication from various
perspectives. To lighten the data transfer to the anal-
ysis server, only the flow information of each device
obtained by the gateway is transferred and used for
analysis. Therefore, we used IP Flow Information Ex-
port (IPFIX), a protocol standardized by the Internet
Engineering Task Force (IETF), as the flow informa-
tion (Claise et al., 2013). Using the flow information
defined by IPFIX, this system can be used for gate-
ways. In order to detect the infections in the analysis
server of our system, we have so far applied machine
learning based methods, such as Isolation Forest.
In this paper, we propose a hybrid method using
a white list and machine learning, in which normal
communications are excluded from anomaly detec-
tion, and other communications are examined using
an Isolation Forest. In the case of IoT devices, it is
possible to detect normal communication by using a
white list, since their operation is limited compared
to that of a PC. Furthermore, the number of data to
be subjected to machine learning is reduced, and it
leads to a reduction in processing load and time. In
this paper, we create the white list using the rules
of Manufacturer Usage Description (MUD) generated
from device communications. MUD is invented in
order to define the normal behavior of devices (Lear
et al., 2019). It is also standardized by IETF, so this
white list is applicable for general IoT devices. We
demonstrate the effectiveness of the proposed method
by comparing the accuracy of anomaly detection with
and without the white list. The contributions of this
paper are as follows.
• We proposed a lightweight malware infection de-
tection system based on standardized technology.
• The flow information in IPFIX format was used to
reduce the amount of data used for anomaly detec-
tion.
• A new use of the MUD is proposed.
• The accuracy of anomaly detection was improved
by the MUD-based white list.
The rest of this paper is as follows: The related works
and the technologies underlying this paper are de-
scribed on Section 2, our proposed system using white
list and machine learning is described on Section 3,
the evaluation of IPFIX is on Section 4, the evalua-
tion of anomaly detection performance is on Section
5, and the conclusion is on Section 6.
2 RELATED WORKS
In this section, we describe the technology used as a
basis for this research.
2.1 Anomaly Detection
The most common methods for preventing IoT mal-
ware infection are blocking access to malicious sites
and blocking entry to devices. There are many secu-
rity products in the market today to prevent infection.
On the other hand, there are many routes of malware
infection, and it is hard to counteract malware infec-
tions just by prevention alone, so early detection af-
ter infection is required. Therefore, researches on the
detection of post-infection behavior have been con-
ducted.
IoT devices often communicate with the C&C
server before their attack behavior, so detection of
these communications is important from the view-
point of stopping the attack. However, the communi-
cation with the C&C server often does not increase as
much as the attack behavior, and it is hard to distin-
guish it from the original communication of the IoT
device. Therefore, numerous researches have been
conducted on anomaly detection by using various fea-
tures from packets to perform machine learning and
deep learning. For example, researches on the classi-
fication of normal communication and abnormal com-
munication, scanning of Mirai for infected sites, and
detection of attack behaviors have been conducted us-
ing machine learning techniques such as Support Vec-
tor Machine (SVM), Ada Boost and Random For-
est (Mizuno et al., 2017; Alam and Vuong, 2013;
Ding and Fei, 2013; Doshi et al., 2018; Hasan et al.,
2019; Madeira and Nunes, 2016). In addition, deep
learning-based anomaly detection uses Convolutional
Neural Network (CNN) to classify normal communi-
cation and DDoS attacks by converting binaries into
8-bit sequences and transforming them into grayscale
images (Su et al., 2018).
On the other hand, these methods are not realistic
to use in actual environment because they use entire
packets including payloads and the algorithms them-
selves are highly loaded. In this paper, we propose a
system that uses lighter data for analysis outside the
local network, and we evaluate the accuracy of this
system.
2.2 IP Flow Information Export
IPFIX is a flow information protocol standardized by
the IETF in RFC 7011 (Claise et al., 2013). Since it is
very useful to collect traffic flow at a specific point in
Malware Detection for IoT Devices using Automatically Generated White List and Isolation Forest
39

managing a network, we have proposed this paper to
unify the method of expressing the flow information
and the means of conveying the flow information to
the collection points.
In this paper, it is necessary to aggregate pack-
ets of IoT devices at the gateway. This requirement
is consistent with the purpose of the IPFIX proposal,
and the IPFIX flow information enables packet aggre-
gation in a standard and efficient manner.
An example of an IPFIX record is shown in Ta-
ble 1. The flow information in IPFIX format in-
cludes information such as flow start time, end time,
source and destination IP addresses, MAC address,
port number, protocol, number of bytes, and number
of packets. To generate IPFIX from PCAP, we used
a tool called YAF with the option to use MAC ad-
dresses (Brian et al., 2018). Since packets included
in a series of flows are aggregated, one record of each
flow information is used for anomaly detection, which
reduces the processing load compared to performing
anomaly detection on a packet-by-packet basis, and
also reduces the volume of data transferred from the
gateway to the analysis server. Therefore, this study
uses IPFIX-based flow-informed records of packets
sent from IoT devices for anomaly detection. On the
other hand, the flow information is less available for
anomaly detection compared to the case where the
whole packets are used, so we need to devise ways to
improve the detection accuracy. In this paper, we pro-
pose the combination of white list and machine learn-
ing for improvement of accuracy.
2.3 Manufacturer Usage Description
MUD is an architecture standardized by the IETF in
RFC 8520 to define the normal behavior of devices
and to protect them from threats (Lear et al., 2019).
It is assumed that the device vendor prepares a rule
file called a MUD file, which defines IP addresses
and port numbers that are permitted to be commu-
nicated in advance. An IoT device equipped with a
MUD mechanism sends the URL of the MUD file to
the router when it is connected to the network, and
the router downloads the MUD file. When the de-
vice is operated, the router checks that the rules in the
MUD file match the information on the destination
and source of the communication, and then forwards
the packets. By allowing only vendor-defined behav-
iors, the device can be protected from malware and
other threats. On the other hand, as the number of in-
fection route and malware types grows, sets of rules
need to be updated, which requires more man-hours
to operate.
There are also several studies on MUDs, e.g., au-
tomatic generation of MUD files from packets of IoT
devices and their embedding in a Software Defined
Network (SDN) (Hamza et al., 2019). Hamza et al.
have published a tool for generating MUD files from
packets (Hamza et al., 2018). In this study, we used
this tool to generate MUD files from packets of IoT
devices to create a white list.
3 PROPOSED SYSTEM
In this section, we describe the system and the algo-
rithm for anomaly detection that is assumed in this
paper.
3.1 System Model
First, the system assumed in this paper is shown in
Figure 1.
In this paper, we assume home network use case
as an example. IoT devices in a home network send
and receive packets to the public network through a
home gateway. Although it is desirable to be able to
detect anomalies at the home gateway, it is not a good
idea to monitor all packets in detail due to the process-
ing load. Therefore, the flow information of IPFIX is
transferred to an external analysis server. The IPFIX
flow information is lighter than that of whole packets
and thus reduces the transmission load to the outside.
The analysis server receives the flow information
and detects anomalies. After a device is connected
to the home network, the flow information is used as
data for learning the device’s intrinsic behavior for a
period of time. The analysis server learns the behav-
ior of each device and creates a classifier. After the
training period, the analysis server detects anomalies
using the received flow information. If there are any
flows that are considered to be anomalies, the home
gateway receives notification, and measures such as
stopping communication with the public network are
taken.
3.2 Anomaly Detection using White
Lists and Machine Learning
In this paper, we propose the use of white lists based
on MUD to define normal communication using ap-
proaches other than machine learning. As described
in Section 2, MUD is an architecture to define the in-
trinsic behavior of devices and is suitable for model-
ing normal communication. We have been using ma-
chine learning algorithms such as Isolation Forest to
detect anomalies in the analysis server of the proposed
system. Isolation Forest is a tree structured anomaly
IoTBDS 2021 - 6th International Conference on Internet of Things, Big Data and Security
40
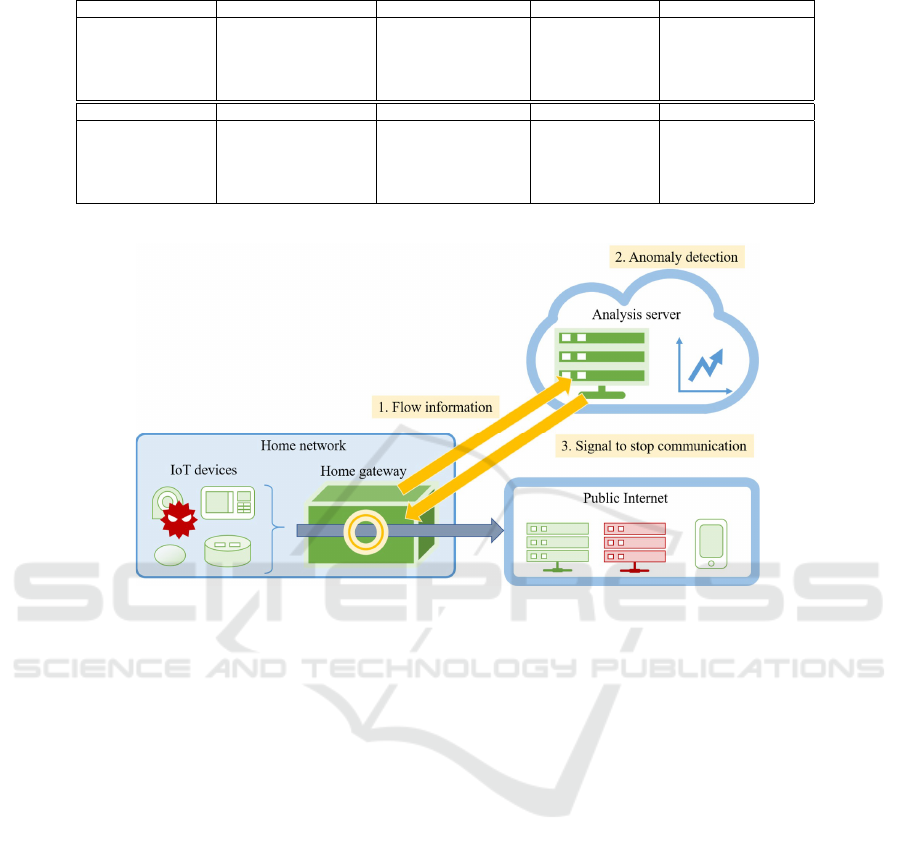
Table 1: An example of fields in IPFIX format.
flowEndMilliseconds sourceMacAddress destinationMacAddress sourceIPv4Address destinationIPv4Address
2019-07-01 00:00:38 a1:b1:c1:d1:e1:f1 a2:b2:c2:d2:e2:f2 192.168.1.1 192.168.1.xx
2019-07-01 00:01:02 a2:b2:c2:d2:e2:f2 a1:b1:c1:d1:e1:f1 192.168.1.xx 192.168.1.1
2019-07-01 00:01:02 a2:b2:c2:d2:e2:f2 a1:b1:c1:d1:e1:f1 192.168.1.xx xxx.xxx.xxx.xxx
2019-07-01 00:01:02 a2:b2:c2:d2:e2:f2 a1:b1:c1:d1:e1:f1 192.168.1.xx yyy.yyy.yyy.yyy
2019-07-01 00:01:02 a2:b2:c2:d2:e2:f2 a1:b1:c1:d1:e1:f1 192.168.1.xx 192.168.1.1
sourceTransportPort destinationTransportPort protocolIdentifier packetTotalCount octetTotalCount
60555 137 17 2 156
6074 53 17 1 64
40860 123 6 1 76
42567 80 6 2 226
8 0 1 10 840
Figure 1: System model of home network use case.
detection algorithm (Liu et al., 2008). We have con-
firmed that we could detect more than 96% of the
malware behavior including communication with the
C&C server even when only the flow information was
used instead of the whole packet.
On the other hand, there is a problem that there are
many false positives that judge the normal communi-
cation of the device as the behavior of the malware.
One of the reasons for this is that normal communica-
tion is not well modeled, especially for devices with
complex behaviors or those with extremely low nor-
mal communication, such as smart speakers and smart
TVs, or some environment sensors.
Therefore, in order to improve the accuracy of
judging normal communication as normal, we use a
MUD specialized to define normal communication
of devices. Device vendors are expected to create
MUDs, and other than device vendors, it is also possi-
ble to create MUDs according to the specifications. In
this study, we generated MUD rules using ”Mudgee,”
a tool for generating MUD files from packets, which
has been published by Hamza et al. In order to protect
devices from malware threats using MUDs alone, it is
necessary to update the rule files every time the num-
ber of infection routes and types of malware increase,
and this requires a lot of man-hours to operate. There-
fore, by combining MUD rules that are automatically
generated from packets and anomaly detection by ma-
chine learning, we can ensure security even when the
device vendor cannot operate the MUD successfully.
An example of the generated MUD rules is shown
in Table 2.
Mudgee reads the PCAP file and generates the
flow information. For each flow included in the flow
information, the MUD rules are generated by adding
each communication direction and protocol to the ac-
cess control list. Although the access control list
can be defined as ”accept” or ”drop”, in the case of
Mudgee, it accepts the destination that appears in the
flow. Some of the rules allow for all sources and des-
tinations. Such rules should not be included in the
white list and are excluded.
In order to improve the detection accuracy, our
system has a dictionary period to define the normal
behavior of the device separately from the training pe-
riod. For example, the training period is two weeks
and the dictionary period is the first week of that pe-
riod. We keep a dictionary of IP addresses that the
device communicated to during the dictionary period,
and create features for machine learning depending on
Malware Detection for IoT Devices using Automatically Generated White List and Isolation Forest
41
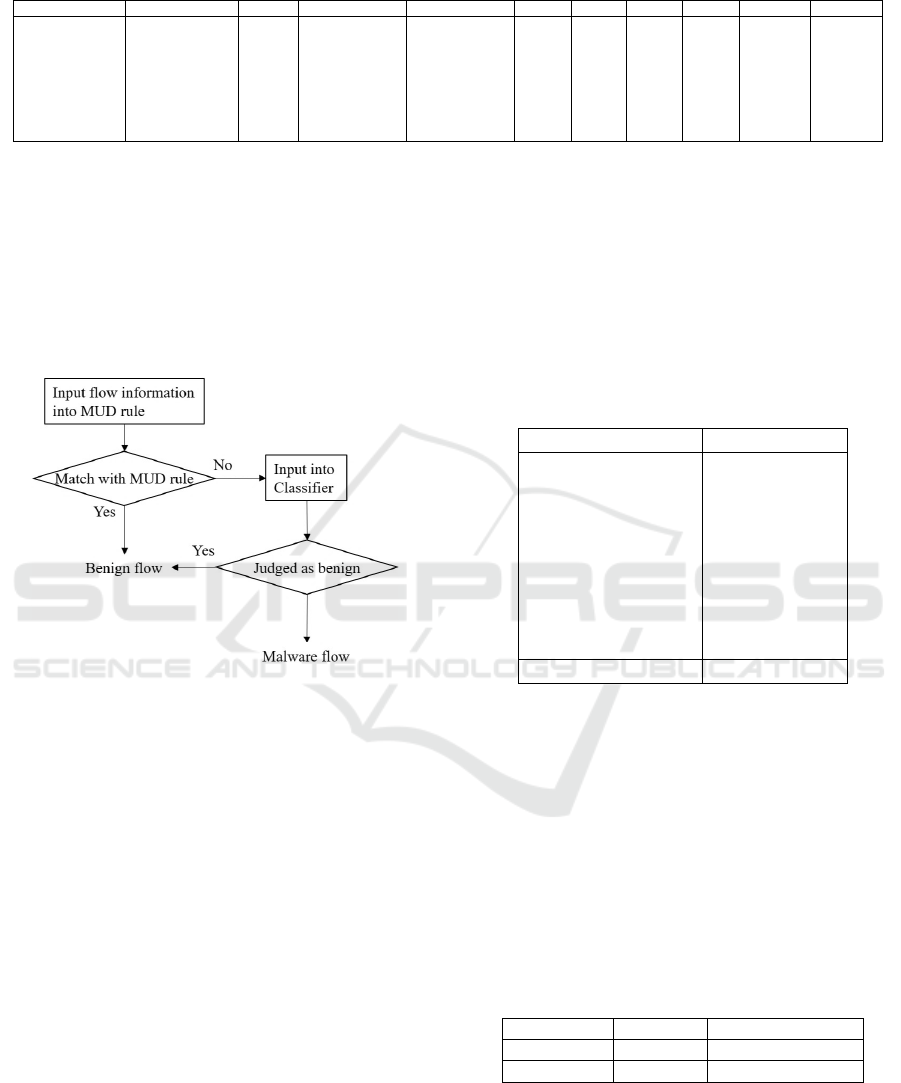
Table 2: An example of MUD rules.
srcMac dstMac ethType srcIp dstIp ipProto srcPort dstPort priority icmpType icmpCode
a1:b1:c1:d1:e1:f1 a2:b2:c2:d2:e2:f2 0x0800 192.168.1.xx xxx.xxx.xxx.xxx 6 48970 443 810 * *
a2:b2:c2:d2:e2:f2 a1:b1:c1:d1:e1:f1 0x0800 yyy.yyy.yyy.yyy * 6 443 * 750 * *
a1:b1:c1:d1:e1:f1 a2:b2:c2:d2:e2:f2 0x0800 xxx.xxx.xxx.xxx * 6 80 * 750 * *
a2:b2:c2:d2:e2:f2 a1:b1:c1:d1:e1:f1 0x0800 * xxx.xxx.xxx.xxx 6 * 443 855 * *
a2:b2:c2:d2:e2:f2 a1:b1:c1:d1:e1:f1 0x0800 xxx.xxx.xxx.xxx * 6 80 * 750 * *
a2:b2:c2:d2:e2:f2 a1:b1:c1:d1:e1:f1 0x0800 * xxx.xxx.xxx.xxx 6 * 443 855 * *
a2:b2:c2:d2:e2:f2 a1:b1:c1:d1:e1:f1 0x0800 xxx.xxx.xxx.xxx * 6 443 * 750 * *
a2:b2:c2:d2:e2:f2 a1:b1:c1:d1:e1:f1 0x0800 192.168.1.xx xxx.xxx.xxx.xxx 6 56840 443 810 * *
whether the destination address of the communication
during the training period is included in the dictionary
or not. By using the dictionary period, the jitters of
device behavior can be learned. In this paper, we gen-
erated MUD rules by inputting packets of dictionary
periods for each device into the Mudgee.
The flow of anomaly detection using MUD and
machine learning is shown in Figure 2.
Figure 2: Flow of anomaly detection.
First, we check whether the target flow conforms to
the MUD rules of the device. If there is a match, the
flow is considered to be normal. If no match is found,
the flow is input to the classifier and an error is de-
tected. In this paper, we use Isolation Forest, which is
capable of fast and accurate unsupervised learning for
anomaly detection. The unsupervised learning system
is suitable for this system because there is no need to
use the communication data of a malware infection
and the learning can be performed under the same
conditions as the real environment.
4 EVALUATION OF IPFIX
In this section, we evaluate the performance of IPFIX
and show the effectiveness. As the data for anomaly
detection, PCAP is commonly used. Similar to IP-
FIX, the PCAP without TCP/UDP payload can be
used for lightweight analysis. Here, we call it as
PCAP information. So we compare the IPFIX record
and PCAP information in this section.
4.1 Evaluation Data
First, we describe the data used in this paper. As the
data for evaluation, normal communication data of
the IoT device and anomaly communication data after
malware infection are required. For normal communi-
cation, we captured packets from the actual operation
of the IoT device for one month. The list of devices
used is shown in Table 3.
Table 3: IoT device list.
Device category No. of Devices
Smart camera 6
Smart speaker 5
IoT gateway 5
Environment sensor 2
Door phone 1
Light 1
Cleaner 1
Remote controller 1
Smart TV 1
Total 23
Here, IoT gateways are devices that integrate and con-
vert the communication of multiple IoT devices.
In order to compare the performance of IPFIX
and PCAP as data for anomaly detection, we con-
verted these collected packets into the IPFIX format
record and PCAP information. These data include
fields used for anomaly detection such as Timestamp,
source and destination MAC address, IP address, port
number, protocol, and packet length. We compared
data size and number of records for the IPFIX and
PCAP information, and the result is shown in Table 4.
Table 4: Comparison of IPFIX and PCAP information.
IPFIX PCAP information
Data size 49.4 MB 301 MB
Record num 5,319,778 23,763,198
From this result, we can find that IPFIX reduces data
size and the number of records. This is because IPFIX
aggregates multiple communications included in one
flow into one record. Thus, the effectiveness of IPFIX
is shown.
IoTBDS 2021 - 6th International Conference on Internet of Things, Big Data and Security
42
5 EVALUATION OF ANOMALY
DETECTION
In this section, we evaluate the accuracy of anomaly
detection by the proposed method.
5.1 Evaluation Data
As the data for accuracy evaluation, normal commu-
nication data of the IoT device and anomaly commu-
nication data are required.
Normal communication data is the same as that
used in Section 4. For the anomaly data, we created
packets that imitate the typical behaviors of malware
infection, such as C&C communication, host scan-
ning, and DoS attacks, and converted them into IP-
FIX. For the preparation of the simulated packets, we
prepared a total of 15 patterns based on the captured
packets of DoS attacks, host scans, and C&C server
communication, in which malware samples were col-
lected using honeypots and operated in a secure en-
vironment, and modified parameters such as commu-
nication interval and number of destinations. The pa-
rameters for each malware behavior are shown in Ta-
ble 5.
We mixed anomaly communications with test data
from one device and evaluated the detection accuracy
for each device.
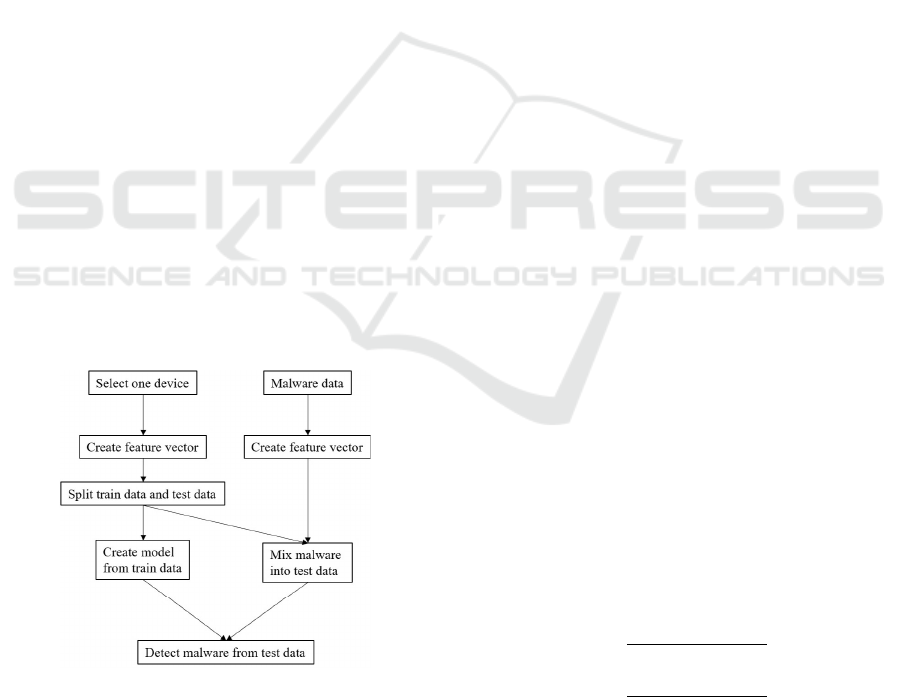
5.2 Evaluation Flow
The evaluation flow on anomaly detection is shown in
Figure 3.
Figure 3: Evaluation flow.
First, we selected the device to be evaluated. Then,
we generated features from the normal communica-
tion of the device and the malware communication.
The features were generated as 20-dimensional vec-
tors by One hot encoding using the dictionary period
described in Section 3. Descriptions of the features
are shown in Table 6.
For example, whether or not the destination IP ad-
dress is one that appeared in the dictionary period,
and whether or not the number of packets is less
than the threshold. The threshold has five variations:
average, average+standard deviationσ, average+2σ,
average+3σ, and more than average+3σ of the num-
ber in the dictionary period.
Then, the normal communication is divided into
train data and test data. The data used in this study
includes one month communication data for each de-
vice, and the first two weeks are used as train data
and the second two weeks as test data. By mixing
test data with malware data, we can create a malware-
infected state for the device. And then, the classifier
determines whether each record is normal or anoma-
lous. The classifier is created with Isolation Forest
based on the training data. The test data are first
checked against the white list generated by the MUD.
The records that match the white list are judged as
normal, and the records that do not match are input
to the classifier to determine whether they are normal
or anomalous. The above operations are repeated for
each device, and the detection results are acquired.
5.3 Evaluation Result
The detection results are obtained by combining the
results of the white list and Isolation Forest. In this
section, we denote the anomaly communication to be
detected as Positive and the normal communication
as Negative. Since white list matching is to determine
whether the communication is normal or not, the re-
sults are divided into True Negative (TN) and False
Negative (FN). The results of the Isolation Forest are
expressed as a mixed matrix including True Positive
(TP) and False Positive (FP) in addition to TN and
FN. Here, TN and FN by the white list are denoted as
T N
w
and FN
w
, and the results by Isolation Forest are
denoted as T N
i
, FN
i
, T P
i
and FP
i
. True Positive Rate
(TPR) and False Positive Rate (FPR) of the white list
and Isolation Forest for one device can be expressed
as follows.
T PR =
T P
i
FN
w
+ FN
i
+ T P
i
(1)
FPR =
FP
i
T N
w
+ T N
i
+ FP
i
(2)
In this paper, we show the effectiveness of the pro-
posed method by comparing the evaluation results of
average TPR and FPR of target devices with and with-
out the white list.
Malware Detection for IoT Devices using Automatically Generated White List and Isolation Forest
43

Table 5: Malware behavior parameters.
Type Cycle
0.33[sec]
1[min]
C&C 1[hour]
12[hour]
24[hour]
Type No. of destIP per sec
100
200
Host scan 500
1000
3000
Type No. of packets per sec
100
500
DoS 1000
1500
3000
Table 6: Feature vectors.
Feature Definition
Dest IP Destination IP address is included in dictionary data.
Dest IP (24bit) The first 24 bits of destination IP are included in dictionary data.
Dest port Destination port is included in dictionary data.
Dest IP&port pair Pair of destination IP and port is included in dictionary data.
Well known port Destination port number is below 1024.
Protocol Protocol is TCP.
Has response It has the same source IP& port pair as the destination IP& port pair.
Response count The number of response packets is larger than the record.
Response length The length of response packets is larger than the record.
Has similar packet There are different packets only for the destination port or source port.
Number of packets The number of packets is below the threshold.
Length of packets The length of packets is below the threshold.
5.3.1 Result of Conventional Method
In this paper, the anomaly detection method based
on machine learning standalone is called the conven-
tional method. Here, we adapted the method used in
our previous work (Nakahara et al., 2020) to IPFIX.
First, Table7 shows the results of the conventional
method without a white list.
Table 7: Results of conventional method.
Prediction
Anomaly Normal
Answer Anomaly 228000 3
Normal 9001 98315
Here, we present the average of the results of all
23 devices used in the evaluation. From the table,
T P
i
= 228000, FN
i
= 3, FP
i
= 9001, T N
i
= 98315,
and we can calculate that T PR = 0.999, FPR = 0.092.
This result indicates that although almost no malware
is missed, the false positive rate is high (9.2%), which
means that for practical purposes, alerts are often is-
sued even when the device is used normally.
5.3.2 Result of White List Standalone
Here, we consider using only the white list for
anomaly detection. Records that match the white list
are judged as normal and those that do not match are
judged as anomalous.
Table 8 shows the results of the white list-based
proposed method.
Table 8: Results of white list standalone.
Prediction
Anomaly Normal
Answer Anomaly 228003 0
Normal 51974 55341
The number of records captured by the white list was
55341. No record has been mistakenly allowed by
the white list for malware, so results are FN
w
= 0,
T N
w
= 55341. Other 279977 records are judged as
anomalous and the actual number of anomalies is
228003, so T P
w
= 228003, FP
w
= 51974. Then, we
calculated the average FPR of all devices and the re-
sult is FPR = 0.661.
This may be due to the change in the behavior
of devices between the training and testing periods.
Therefore, we checked the changes in the port num-
ber pairs of the destination IP addresses on which the
MUDs are based between the training and testing pe-
riods. We calculated the ratio of unique pairs of IP
addresses and port numbers in the test period that ap-
peared also in the training period. The result is shown
in 4.
For all devices, the value is greater than or equal to
0.22, and for some devices, it is above 0.90. The av-
erage ratio was 0.647. In this situation, if all commu-
nications that do not match the white list are judged
as anomaly, many false positives will occur. This
shows that the behavior of devices changes frequently
and that white lists alone cannot detect anomalies cor-
rectly.
IoTBDS 2021 - 6th International Conference on Internet of Things, Big Data and Security
44
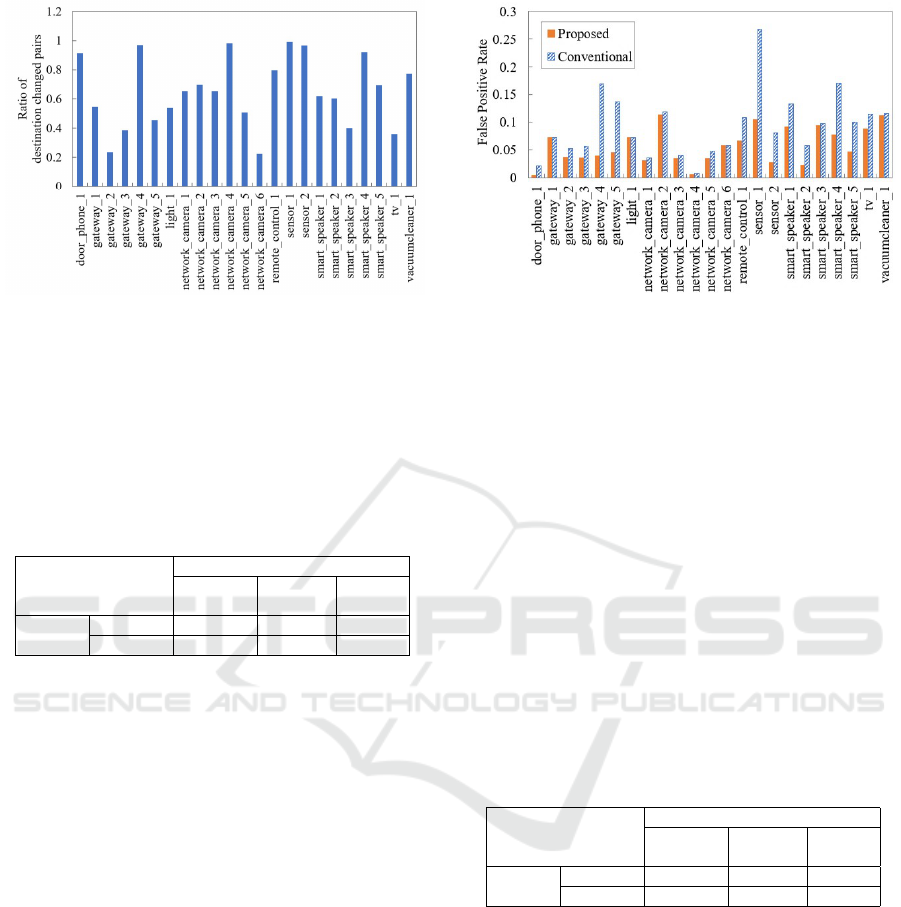
Figure 4: Ratio of changed unique pairs of IP and port.
Based on the above, we consider the hybrid system
using the machine learning and white list.
5.3.3 Result of Proposed Method
Next, Table 9 shows the results of the white list-based
proposed method.
Table 9: Results of proposed method.
Prediction
Anomaly Normal Normal
(iForest) (iForest) (WL)
Answer Anomaly 228000 3 0
Normal 6156 45818 55341
The result of the white list decision is shown in Be-
nign(WL), and the values are the same as the previ-
ous section. The prediction results of Isolation Forest
are shown in Anomaly(iForest) and Normal(iForest).
FN
i
is still 3, but FP
i
is decreased from 9001 to 6156.
And the average TPR and FPR of all devices are cal-
culated as T PR = 0.999, FPR = 0.057. The results
show that the false positive detection rate could be re-
duced by about 3.5% without reducing the positive
detection rate.
Figure 5 shows the results of calculating the FPR
for each device for the proposed and conventional
methods.
This figure shows that the FPR has been reduced in
almost all devices. In particular, we have been able to
significantly reduce the FPR in smart speakers, where
the device’s intrinsic behavior is complex, and in
IoT gateways, which aggregate the communication of
multiple devices. Although it was difficult to distin-
guish between normal communication and malware
communication in these devices by machine learning
alone, the white list makes it easier to distinguish be-
tween them by narrowing down the detection targets.
In addition, in some environmental sensors, some fea-
tures, such as the presence or absence of communica-
Figure 5: FPR per device.
tion to the well-known port and the protocol, some-
times generate patterns similar to those of anomaly
communication, and many false positives were gener-
ated.
These results indicate that the combination of
white list and machine learning can improve the false
positive detection rate without reducing the positive
detection rate compared to machine learning.
5.3.4 Result of Customized White List
Finally, in order to increase the number of normal
records captured by the white list, we loosen the rule
of the white list. Here, we created the white list using
only 24 bits of the destination IP address included in
the MUD file.
Table 10 shows the results of the loose customized
white list method.
Table 10: Results of customized white list method.
Prediction
Anomaly Normal Normal
(iForest) (iForest) (WL)
Answer Anomaly 227975 1 27
Normal 1796 9195 96324
We can see that FP
i
is decreased to 1796. And the
average TPR and FPR of all devices are calculated as
T PR = 0.999, FPR = 0.032. This is because more
normal records are captured by the customized white
list. On the other hand, as shown in Benign(WL)
where FN
w
= 27, some records have been mistak-
enly allowed by the white list. These results show that
there is a trade-off between true and false negatives in
the granularity of the white list.
Table 11 shows the results of comparison be-
tween conventional method and two types of pro-
posed method.
This result shows that the white list contributes to
the decrease of the false positive rate and trade-off
Malware Detection for IoT Devices using Automatically Generated White List and Isolation Forest
45

Table 11: Comparison of detection results.
TPR FPR
Conventional 0.9999 0.0928
White list 0.9999 0.0570
Customized white list 0.9998 0.0325
between TPR and FPR can be controlled by changing
the granularity of the white list.
6 CONCLUSIONS
In this paper, we proposed a method that combines
a white list created by MUD with machine learning
to detect malware infection in IoT devices. By us-
ing the white list, we can exclude normal commu-
nications that have been misclassified as malware by
machine learning alone from anomaly detection, and
thus reduce false positives. We evaluated the accuracy
of anomaly detection using a dataset of normal and
malware communications, and confirmed that the pro-
posed method reduced the false detection rate. More-
over, the performance varied by changing the rule of
the white list. Future work includes investigating how
to create more effective white lists, applying them
to other machine learning algorithms, and evaluating
them using more practical datasets.
REFERENCES
Abdalla, P. A. and Varol, C. (2020). Testing iot security:
The case study of an ip camera. In 2020 8th Interna-
tional Symposium on Digital Forensics and Security
(ISDFS), pages 1–5. IEEE.
Ahmed, S., Lee, Y., Hyun, S.-H., and Koo, I. (2019). Unsu-
pervised machine learning-based detection of covert
data integrity assault in smart grid networks utilizing
isolation forest. IEEE Transactions on Information
Forensics and Security, 14(10):2765–2777.
Alam, M. S. and Vuong, S. T. (2013). Random forest
classification for detecting android malware. In 2013
IEEE International Conference on Green Computing
and Communications and IEEE Internet of Things and
IEEE Cyber, Physical and Social Computing, pages
663–669. IEEE.
Antonakakis, M., April, T., Bailey, M., Bernhard, M.,
Bursztein, E., Cochran, J., Durumeric, Z., Halderman,
J. A., Invernizzi, L., Kallitsis, M., et al. (2017). Un-
derstanding the mirai botnet. In 26th USENIX Security
Symposium (USENIX Security 17), pages 1093–1110.
Brian, T., Chris, I., Michael, D., Emily, S., Dan, R.,
Matt, C., and the CERT Network Situational Aware-
ness Group Engineering Team (2018). Yaf documen-
tation. https://tools.netsa.cert.org/yaf/yaf.html. Ac-
cessed: 2020-11-17.
Claise, B., Trammell, B., and Aitken, P. (2013). Specifi-
cation of the ip flow information export (ipfix) pro-
tocol for the exchange of flow information. https:
//tools.ietf.org/html/rfc7011. Accessed: 2020-11-17.
Ding, Z. and Fei, M. (2013). An anomaly detection ap-
proach based on isolation forest algorithm for stream-
ing data using sliding window. IFAC Proceedings Vol-
umes, 46(20):12–17.
Doshi, R., Apthorpe, N., and Feamster, N. (2018). Ma-
chine learning ddos detection for consumer internet of
things devices. In 2018 IEEE Security and Privacy
Workshops (SPW), pages 29–35.
Fortino, G., Savaglio, C., Spezzano, G., and Zhou, M.
(2020). Internet of things as system of systems: A
review of methodologies, frameworks, platforms, and
tools. IEEE Transactions on Systems, Man, and Cy-
bernetics: Systems.
Hamza, A., Gharakheili, H. H., Benson, T. A., and Sivara-
man, V. (2019). Detecting volumetric attacks on lot
devices via sdn-based monitoring of mud activity. In
Proceedings of the 2019 ACM Symposium on SDN Re-
search, pages 36–48.
Hamza, A., Ranathunga, D., Gharakheili, H. H., Roughan,
M., and Sivaraman, V. (2018). Clear as mud: gener-
ating, validating and applying iot behavioral profiles.
In Proceedings of the 2018 Workshop on IoT Security
and Privacy, pages 8–14.
Hasan, M., Islam, M. M., Zarif, M. I. I., and Hashem, M.
(2019). Attack and anomaly detection in iot sensors in
iot sites using machine learning approaches. Internet
of Things, 7:100059.
Hassija, V., Chamola, V., Saxena, V., Jain, D., Goyal, P., and
Sikdar, B. (2019). A survey on iot cecurity: Applica-
tion areas, security threats, and solution architectures.
IEEE Access, 7:82721–82743.
Jung, O., Smith, P., Magin, J., and Reuter, L. (2019).
Anomaly detection in smart grids based on software
defined networks. In Proceedings of the 8th Interna-
tional Conference on Smart Cities and Green ICT Sys-
tems - SMARTGREENS,, pages 157–164. INSTICC,
SciTePress.
Kimani, K., Oduol, V., and Langat, K. (2019). Cyber se-
curity challenges for iot-based smart grid networks.
International Journal of Critical Infrastructure Pro-
tection, 25:36–49.
Kolias, C., Kambourakis, G., Stavrou, A., and Voas, J.
(2017). Ddos in the iot: Mirai and other botnets. Com-
puter, 50(7):80–84.
Lear, E., Droms, R., and Romascanu, D. (2019). Manufac-
turer usage description specification. https://tools.ietf.
org/html/rfc8520. Accessed: 2020-11-17.
Liu, F. T., Ting, K. M., and Zhou, Z.-H. (2008). Isolation
forest. In 2008 Eighth IEEE International Conference
on Data Mining, pages 413–422. IEEE.
Madeira, R. and Nunes, L. (2016). A machine learning ap-
proach for indirect human presence detection using iot
devices. In 2016 Eleventh International Conference
on Digital Information Management (ICDIM), pages
145–150.
Mizuno, S., Hatada, M., Mori, T., and Goto, S. (2017).
Botdetector: A robust and scalable approach toward
IoTBDS 2021 - 6th International Conference on Internet of Things, Big Data and Security
46

detecting malware-infected devices. In 2017 IEEE
International Conference on Communications (ICC),
pages 1–7. IEEE.
Mohanapriya, A. et al. (2020). Survey on security of iot. In
2020 International Conference on Computer Commu-
nication and Informatics (ICCCI), pages 1–8. IEEE.
Nakahara, M., Okui, N., Kobayashi, Y., and Miyake, Y.
(2020). Machine learning based malware traffic de-
tection on iot devices using summarized packet data.
In IoTBDS, pages 78–87.
Nguyen, T. D., Marchal, S., Miettinen, M., Fereidooni, H.,
Asokan, N., and Sadeghi, A.-R. (2019). D
¨
ıot: A
federated self-learning anomaly detection system for
iot. In 2019 IEEE 39th International Conference on
Distributed Computing Systems (ICDCS), pages 756–
767. IEEE.
Soltan, S., Mittal, P., and Poor, H. V. (2018). Blackiot: Iot
botnet of high wattage devices can disrupt the power
grid. In 27th USENIX Security Symposium (USENIX
Security 18), pages 15–32.
Su, J., Vasconcellos, V. D., Prasad, S., Daniele, S., Feng,
Y., and Sakurai, K. (2018). Lightweight classifica-
tion of iot malware based on image recognition. In
2018 IEEE 42nd Annual Computer Software and Ap-
plications Conference (COMPSAC), volume 2, pages
664–669. IEEE.
Zulkipli, N. H. N., Alenezi, A., and Wills, G. B. (2017).
Iot forensic: Bridging the challenges in digital foren-
sic and the internet of things. In Proceedings of the
2nd International Conference on Internet of Things,
Big Data and Security - IoTBDS,, pages 315–324. IN-
STICC, SciTePress.
Malware Detection for IoT Devices using Automatically Generated White List and Isolation Forest
47
