
Simple Matrix Factorization Collaborative Filtering for Drug
Repositioning on Cell Lines
Iv
´
an Carrera
1,3 a
, Eduardo Tejera
2 b
and In
ˆ
es Dutra
3 c
1
Departamento de Inform
´
atica y Ciencias de la Computaci
´
on, Escuela Polit
´
ecnica Nacional, Quito, Ecuador
2
Grupo de Quimio-Bioinform
´
atica, Universidad de Las Am
´
ericas, Quito, Ecuador
3
Departamento de Ci
ˆ
encia de Computadores, Universidade do Porto, Porto, Portugal
Keywords:
Drug Repositioning, Recommender Systems, Collaborative Filtering.
Abstract:
The discovery of new biological interactions, such as interactions between drugs and cell lines, can improve
the way drugs are developed. Recently, there has been important interest for predicting interactions between
drugs and targets using recommender systems; and more specifically, using recommender systems to predict
drug activity on cellular lines. In this work, we present a simple and straightforward approach for the discovery
of interactions between drugs and cellular lines using collaborative filtering. We represent cellular lines by
their drug affinity profile, and correspondingly, represent drugs by their cell line affinity profile in a single
interaction matrix. Using simple matrix factorization, we predicted previously unknown values, minimizing
the regularized squared error. We build a comprehensive dataset with information from the ChEMBL database.
Our dataset comprises 300,000+ molecules, 1,200+ cellular lines, and 3,000,000+ reported activities. We have
been able to successfully predict drug activity, and evaluate the performance of our model via utility, achieving
an Area Under ROC Curve (AUROC) of near 0.9.
1 INTRODUCTION
Drug repositioning is the process of finding new uses
outside the scope of the original medical indication
for existing drugs. Drug repositioning offers a bet-
ter risk-versus-reward trade-off compared with other
drug development strategies because repositioning
candidates have often been through several stages of
clinical development, and therefore have well-known
safety and pharmacokinetic profiles. Phases like in
vitro and in vivo screening, chemical optimization,
toxicology, bulk manufacturing, formulation devel-
opment and even early clinical development have, in
many cases, already been completed and can there-
fore be bypassed, when testing already developed
drugs (Ashburn and Thor, 2004).
De novo drug development process can take 13 to
15 years and cost between US$2 and $3 billion. De-
velopment costs are increasing, though the number of
drugs yearly approved per dollar spent on develop-
ment has remained flat or decreased (Nosengo, 2016).
a
https://orcid.org/0000-0003-4337-7433
b
https://orcid.org/0000-0002-1377-0413
c
https://orcid.org/0000-0002-3578-7769
Paul Ehrlich, winner of 1908 Nobel Prize for
Physiology or Medicine, postulated the ‘magic bullet’
concept: drugs that go straight to their intended cell-
structural targets. Targeted medicine should in theory
efficaciously attack pathogens yet remain harmless in
healthy tissues (Strebhardt and Ullrich, 2008).
One of the problems with Ehrlich’s postulate is
that once the drug reaches the body, it has no way
to prevent affecting other targets besides its main pur-
pose, causing the undesired effects of drugs. This is
the essence of the proven inefficiency of drug discov-
ery approaches based on the magic bullet paradigm
(Cruz-Monteagudo et al., 2017).
Drug repositioning works by testing biological in-
teractions or effects of drugs on genes, protein bind-
ing and molecular pathways affecting the genotype
and phenotype of humans. It identifies new thera-
peutic indications for known drugs that have different
targets (Dovrolis et al., 2017). The fundamental as-
sumption is that agents with similar properties have
similar therapeutic effects. Fig. 1 illustrates how drug
repositioning can work.
Drug repositioning is part of computer-aided drug
design (CADD), classified in structure-based and
ligand-based. Ligand-based CADD is grounded on
768
Carrera, I., Tejera, E. and Dutra, I.
Simple Matrix Factorization Collaborative Filtering for Drug Repositioning on Cell Lines.
DOI: 10.5220/0010394007680775
In Proceedings of the 14th International Joint Conference on Biomedical Engineering Systems and Technologies (BIOSTEC 2021) - Volume 5: HEALTHINF, pages 768-775
ISBN: 978-989-758-490-9
Copyright
c
2021 by SCITEPRESS – Science and Technology Publications, Lda. All rights reserved
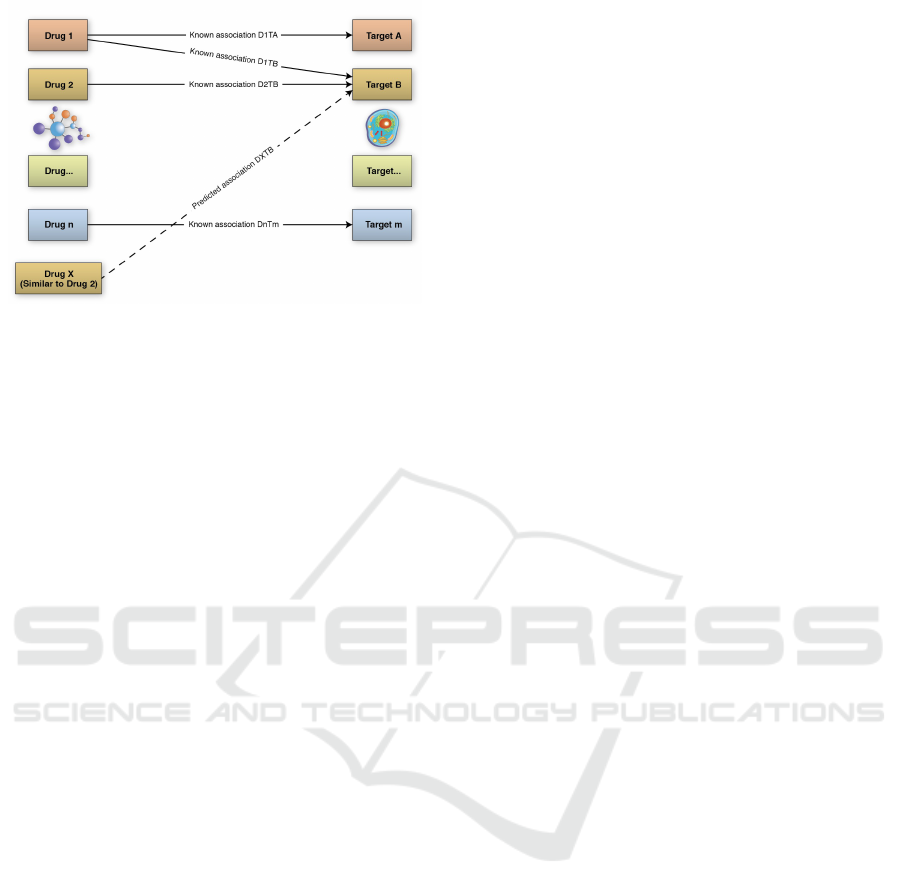
Figure 1: An example of how drug repositioning works.
molecular activity databases, tagging small molecules
as active and inactive, and through chemical similar-
ity searches (Sliwoski et al., 2014). Ligand-based
CADD is generally preferred when no or little struc-
tural information about the drug targets is available.
In every method for drug repositioning, each drug,
target, and disease has to be represented by a feature
vector. These vectors can be based on different prop-
erties: chemical structures, side effects, fingerprints,
genomic characters of targets, and phenotype infor-
mation of diseases. These models can get very com-
plex and require a large set of data, combining ge-
nomic information about cellular lines, and chemical
information about drugs.
In this work we aim to predict drug activities on
cell lines while providing a minimum amount of in-
formation, i.e., drug-cell line affinity profiles. We
present a simple and straightforward model for drug
repositioning for cellular lines using a recommender
system. The performance shown by the model is
strong, considering the simplicity of the model.
The remainder of this work is organized as fol-
lows: Section 2 describes the motivation and rele-
vance of this work, and Section 3 presents a sum-
mary of relevant related work. Section 4 describes
the dataset and methodology, and Section 5 shows the
obtained results and model evaluation. Section 6 dis-
cusses the contribution of this work, and the limita-
tions of our proposed model. Finally, Section 6 refers
to links to the database and software files for repro-
ducibility.
2 MOTIVATION
The goal of recommender systems is to infer customer
interests. The entity to which the recommendation is
provided is referred to as the user, and the product be-
ing recommended is referred to as an item. Therefore,
recommendation analysis is often based on the previ-
ous interaction between users and items, because past
interests and proclivities are often good indicators of
future choices (Aggarwal, 2016).
In recommender systems, a m × n ranking matrix,
called R, is formed, where m is the number of users,
and n is the number of items. The elements of the
matrix are denoted r, where r
i j
is the ranking given by
the user i to the item j. This matrix is very sparse, as
it only contains observed data. Collaborative filtering
recommender systems aim to predict missing ratings,
and fill matrix R. Predicted ratings are denoted ˆr
uv
for
the previously unknown ranking given by the user u
to the item v.
Collaborative filtering recommender systems
work with user-item interactions, and use the collabo-
rative power of the ratings provided by multiple users
to make recommendations. The main challenge is the
sparsity of ratings matrices (Aggarwal, 2016).
As described by (Wang et al., 2019), drug reposi-
tioning is analogous to recommendation systems. We
can understand the drug repositioning concept as rec-
ommending previously unknown drug-target interac-
tions. In this case, the ranking matrix R is an inter-
action matrix, where r
i j
represents the drug i reported
activity, or inactivity, on target j. Predicted values ˆr
uv
represent a possible activity of drug u on target v.
In this work, our goal is to recommend potential
drugs for targets. In our case, targets will be cellular
lines.
A cellular line is a population of cells, that, given
appropriate surroundings, can live, multiply, and even
express differentiated properties in a tissue-culture
dish. This cell culture is used to perform experiments
in vitro (Alberts et al., 2002). Cell lines are a very
important tool for research into the biochemistry and
cell biology of multicellular organisms.
Large drug screening projects are carried out us-
ing cancer cell lines. Cell lines help in choosing the
most effective chemotherapeutic regimen for a pa-
tient, given that an ineffective chemotherapy may in-
crease mortality and decrease quality of life in cancer
patients (Chen et al., 2013).
Drug repositioning for cellular lines is thus of
great concern, as it can help make faster and less ex-
pensive development of cancer therapies. However,
related work usually focuses developing models on
specific sets of cellular lines, using as well a small set
of candidate drugs. There aren’t many research pa-
pers aiming at a more comprehensive model with a
large set of drugs and cell lines. There is an opportu-
nity of achieving this goal using collaborative filtering
recommender systems.
Simple Matrix Factorization Collaborative Filtering for Drug Repositioning on Cell Lines
769

3 RELATED WORK
For the past years, there has been interest on re-
search about recommender systems for drug reposi-
tioning for cellular lines, as several research papers
have approached the subject. Following, we present
a brief summary of the most relevant work in the
subject. Table 1 synthesizes findings of such work.
(Gao et al., 2012) presents a collaborative filtering
model for predicting inhibitors of the Hedgehog Sig-
naling Pathway. Authors use a collaborative filtering
model for QSAR modeling, based on collective ma-
trix factorization (Singh and Gordon, 2008). They
build a matrix X, with data about the interactions of
chemical compounds on cell lines, and matrix Y , with
the descriptions of compounds, using two different
molecule descriptors: a general descriptor and a drug-
like index (DLI) for compound representation. Work
focuses on predicting interactions for 4 cellular lines:
BxPC-3, NCI-H446, SW1990, and NCI-H157.
Performance is evaluated measuring squared cor-
relation coefficient (R-square) and Root mean squared
error (RMSE). Authors achieve values of R-square
ranging from 0.4 to 0.7, and RMSE from 0.4 to 0.8.
(Cheng et al., 2012) develops three inference
methods to predict new drug-target interactions:
drug-based similarity inference (DBSI), target-based
similarity inference (TBSI) and network-based infer-
ence (NBI). These three methods are based on com-
plex network theory. Authors construct 4 benchmark
datasets comprising: 445, 210, 223, and 54 com-
pounds against 664 enzymes, 204 ion channels, 95
GPCRs and 26 nuclear receptors, respectively.
Results of 10-fold cross validation perfor-
mance evaluation for AUC were 0.9756±0.006,
0.9766±0.007, 0.9466±0.019 and 0.8386±0.087 for
enzymes, ion channels, GPCRs and nuclear receptors,
respectively. Authors validate the predictions experi-
mentally as well, in wet lab, for enzyme DPP-IV, and
receptors ERα and ERβ.
(Wang et al., 2019) constructs and decomposes
three-dimensional tensors, consisting on associations
among drugs, targets and diseases, to derive latent
factors reflecting the functional patterns of the three
entities. Authors apply Topological Data Analysis
(TDA) to cluster drugs, targets and diseases into func-
tional groups.
Authors construct a dataset comprising 549 drugs
from Drug-Bank, 424 targets from Human Protein
Reference Database (HPRD) and 340 diseases from
the Comparative Toxicogenomics Database (CTD).
They model the problem of triplet association (drug-
target-disease) prediction as tensor completion. A 3D
association tensor χ is factorized into three matrices,
called factor matrices. By multiplying factor matri-
ces, another tensor
e
χ is generalized, which contains
the approximation of the observations in χ and new
predictions recovered from the functional patterns.
This is a 3D version of singular value decomposition
(SVD). Authors assess their performance with area
under the ROC curve (AUC), ranging from 0.9673 to
0.999, and area under precision-recall curve (AUPR),
ranging from 0.861 to 0.9967.
(Suphavilai et al., 2018) proposes a method
CaDRReS that predicts cancer drug responses for un-
seen cell-lines/patients based on learning projections
into a latent pharmacogenomic space. Authors con-
struct datasets from two large-scale studies: CCLE
and GDSC (Suphavilai et al., 2018). Datasets contain
information on 491 cell-lines, 19 drugs and 9096 ex-
periments from CCLE, and 983 cell-lines, 223 drugs
and 179,633 experiments from GDSC.
Authors calculate cell-line features based on gene
expression information, and use matrix factoriza-
tion to learn a latent space to project drug and cell
line data. They evaluate their models for each cell
line, using the normalized discounted cumulative gain
(NDCG). Results show that values of NDCG range
between 0.6 and 0.9.
(Zhang et al., 2018) presents a hybrid interpola-
tion weighted collaborative filtering method to ap-
proximate the sensitivity of a given cell line to a drug
predicting anti-cancer drug response. Authors nor-
malize genomic expression profiles of cell lines to
draw their similarity matrix, and use chemical struc-
tures of drug compounds to draw their similarity ma-
trix.
Authors construct two datasets: the first with in-
formation from GDSC project, consisting of 652 cell
lines, 135 drugs, and 70,676 activity data points (ma-
trix 80.3% complete); the second dataset with infor-
mation from CCLE project, with 491 cell lines, 23
drugs, and 10,870 activity data points (matrix 96.25%
complete). Results are assessed with measures
including average Pearson Correlation Coefficient
(PCC), and RMSE between predicted and observed
drug responses. Performance results show drug-
averaged PCC of 0.58±0.15 and RMSE 1.51±0.39
for the GDSC dataset, and drug-averaged PCC of
0.74±0.08 and RMSE 0.53±0.15 for the CCLE
dataset.
(Wang et al., 2018) develops a multi-rank, multi-
layered recommender system, called ANTENNA.
Authors obtain a dataset of 199,338 chemical com-
pounds, 6,277 genes, with 233,378 unique chemical-
gene active pairs, from the combination of ZINC,
ChEMBL, and DrugBank databases, as well as the
Comparative Toxicology Database (CTD). Authors
aim at predicting novel drug-gene-disease associa-
HEALTHINF 2021 - 14th International Conference on Health Informatics
770
Table 1: Summary on the most relevant work about recommender systems for drug repositioning for cellular lines.
Work Predicting Goal Dataset size
1
Method Results
2
(Gao et al.,
2012)
Inhibitors of Hedgehog Sig-
naling Pathway
93 compounds, 4
cell lines
Collaborative filter-
ing + Content-based
R-square: [0.4-
0.7] RMSE:
[0.4-0.8]
(Cheng
et al., 2012)
Drug-target interactions via
network-based inference
445 compounds,
664 enzymes
(largest)
Content-based AUC:
0.9756±0.006
(Wang et al.,
2019)
Drug, target and disease as-
sociations by tensor decom-
position
549 drugs, 424 tar-
gets, 340 diseases
3D tensor decompo-
sition
AUC [0.97-
0.99] AUPR
[0.86-0.99]
(Suphavilai
et al., 2018)
Cancer drug responses for
unseen cell-lines/ patients
based on latent pharma-
cogenomic space.
983 cell lines, 223
drugs, 179,633 ex-
periments (largest)
Matrix decomposi-
tion
NDGC [0.6-
0.9]
(Zhang
et al., 2018)
Anti-cancer drug responses
of cell lines, incorporating
cell line and drug similari-
ties
652 cell lines, 135
drugs, 70,676 ac-
tivities (largest)
Weighted interpola-
tion collaborative fil-
tering
PCC:0.58±0.15
RMSE:
1.51±0.39
(Wang et al.,
2018)
Novel chemical - gene - dis-
ease associations
6,277 genes,
199,338 com-
pounds, 233,378
activities
Multi-rank, multi-
layered
FDR<0.02
(Liu et al.,
2018)
Anti-cancer Drug Response N/A Neighborhood-based
collaborative fil-
tering with Global
Effect Removal
PCC S/R: 0.89
RMSE S/R:
0.47
(Emdadi and
Eslahchi,
2020)
Effective cell-line and drug
features for computing drug
sensitivity
555 cell lines, 98
drugs (largest)
Logistic matrix fac-
torization
AUC: 0.76
tions, modeling the prediction of drug-disease associ-
ation problem as a One Class Collaborative Filtering
(OCCF) problem, as they understand negative data
as not needed for training the model. ANTENNA
predicted that 21,921 novel drug-disease associations
with Benjamini-Hochberg adjusted false discovery
rate (FDR) less than 0.02. Authors perform predic-
tions on a set of two cell lines, MCF-7 and MDA-
MB 468. Experimental assessment of predictions was
done in wet lab by detecting the binding of selected
drugs to a set of 438 kinases.
(Liu et al., 2018) proposes a neighborhood-based
collaborative filtering, with global effects removal
recommender system, for drug-response prediction.
Model incorporates similarities of drugs and of cell
lines in additional to the known drug response. Re-
sults are evaluated using PCC and RMSE as perfor-
mance metrics. Authors evaluated their model using
the GDSC, and CCLE datasets. They did not include
the size of their datasets. Model shows as perfor-
mance metrics a drug-averaged PCC S/R of 0.89, and
a drug-averaged RMSE S/R of 0.47.
(Emdadi and Eslahchi, 2020) presents a Drug Sen-
sitivity Prediction using Logistic Matrix Factorization
approach. Authors focus on the discovery of effec-
tive features of cell lines and drugs for computing the
probability of interaction of cell lines and drugs by
logistic matrix factorization approach. Authors built
two benchmark datasets, the first, based on GSDC,
contains 555 cell lines and 98 drugs, and the second,
based on CCLE, 363 cell lines and 24 drugs.
Authors find the t-most nearest neighbors for a
new cell line and estimate its latent vector, based on
average of its neighbors latent vectors. After obtain-
ing the latent vector, authors can predict IC
50
values
across all drugs for the cell line. Results show an AUC
of 0.760 for the GDSC dataset, and an AUC of 0.776
for the CCLE dataset.
In general, interesting work has been made on this
subject. Several papers include information from dif-
ferent datasets, each one develops its own method,
and different performance metrics are used. Nev-
ertheless, we can identify a lack of a general com-
prehensive model. Most work is done for specific
datasets, or specific diseases. Thus, we could bene-
fit from a more general approach.
Simple Matrix Factorization Collaborative Filtering for Drug Repositioning on Cell Lines
771
Moreover, we noted that all methods construct
their interaction matrices with positive interaction
values, i.e., they include information of targets that
are interact with a drug, but not include information
about targets that do not interact with a drug. We hy-
pothesize that negative interaction values could pro-
vide an interesting improvement on drug reposition-
ing recommender systems.
4 MATERIALS AND METHODS
In this work we aim at predicting drug-cell line in-
teractions using collaborative filtering of an interac-
tion matrix. The first step is to prepare the data
for the interaction matrix. We selected ChEMBL
database, an open large-scale bioactivity database ac-
cessible at https:ebi.ac.uk/chembl. ChEMBL hosts
extracted data from the medicinal chemistry litera-
ture, and bioactivity data from new sources, includ-
ing: datasets from neglected disease screening, drug
metabolism and disposition data and bioactivity data
from patents (Gaulton et al., 2012).
We follow the data preparation methodology from
(Tejera et al., 2019). Tejera et al. presents a method-
ology for discovering associations between drugs and
cell lines based on drug similarity and k-nearest
neighbors using a dataset derived from ChEMBL
database.
Figure 2: Simplified ChEMBL Data Model.
We simplified the data model from ChEMBL for
constructing the interaction matrix. Figure 2 shows
our data model: table Drug presents the information
about chemical compounds, table Cell Line about
the cellular lines, and table Interaction summarizes
the information about the reported assays and activi-
ties for a given drug-cell line pair.
Then, we select experimental data of cellular lines
from ChEMBL to populate Interaction table, and
ranking matrix R (Fig. 3). We select activities report-
ing IC50, GI50 and EC50. These values correspond to
drug concentration: IC50 is drug concentration caus-
ing 50% inhibition of the desired activity. GI50 is
concentration for 50% of maximal inhibition of cell
proliferation, and EC50 is the concentration causing
50% of maximum effect for any measured biological
effect of interest.
Figure 3: Interaction Matrix R.
We classify activities into sensitive and resistant.
An activity is sensitive when concentration is less than
or equal to 10µM, and resistant when otherwise. In
the Interaction table of the data model (Fig. 2 ), the
isActive property is boolean, having a True value
for sensitive, and False for resistant.
Most drug-cell line pairs report several assay
records, with different concentration values. We dis-
card pairs with less than 10 records, as we need con-
firmed information for our model. If there are ambi-
guities, i.e., some records report concentrations over
10µM, and other records report concentrations under
10µM, isActive property is not set.
Interaction matrix R contains all possible drug-cell
line combinations. A given r
i j
element represents the
drug i activity on cell line j. For populating matrix R,
we assigned a value of 1 for sensitive, −1 for resis-
tant, and 0 for the unknown values.
Then, process is performed over different versions
of ChEMBL. We worked with versions 24, 25, 26,
and 27 (latest).
After data tables are set, we can deploy our Col-
laborative Filtering Recommender System, as shown
in Fig. 4. We use package scikit-surprise
Python implementation for Recommender Systems
(Hug, 2020), following documentation from: sur-
prise.readthedocs.io.
For computing unkown values, we use singular
value decomposition (SVD), which requires factoring
R matrix (Koren et al., 2009). Estimated rankings ˆr
uv
,
i.e., the drug u activity on cell line v, are computed
using the formula described in equation 1.
ˆr
uv
= µ + b
u
+ b
v
+ q
T
v
p
u
(1)
To infer the unkown interaction values, we minimize
the regularized squared error, as shown in equation 2:
∑
r
uv
∈R
train
(r
uv
− ˆr
uv
)
2
+ λ
b
2
v
+ b
2
u
+ ||q
v
||
2
+ ||p
u
||
2
(2)
Minimization is performed in several epochs by
stochastic gradient descent SGD, as shown in equa-
HEALTHINF 2021 - 14th International Conference on Health Informatics
772
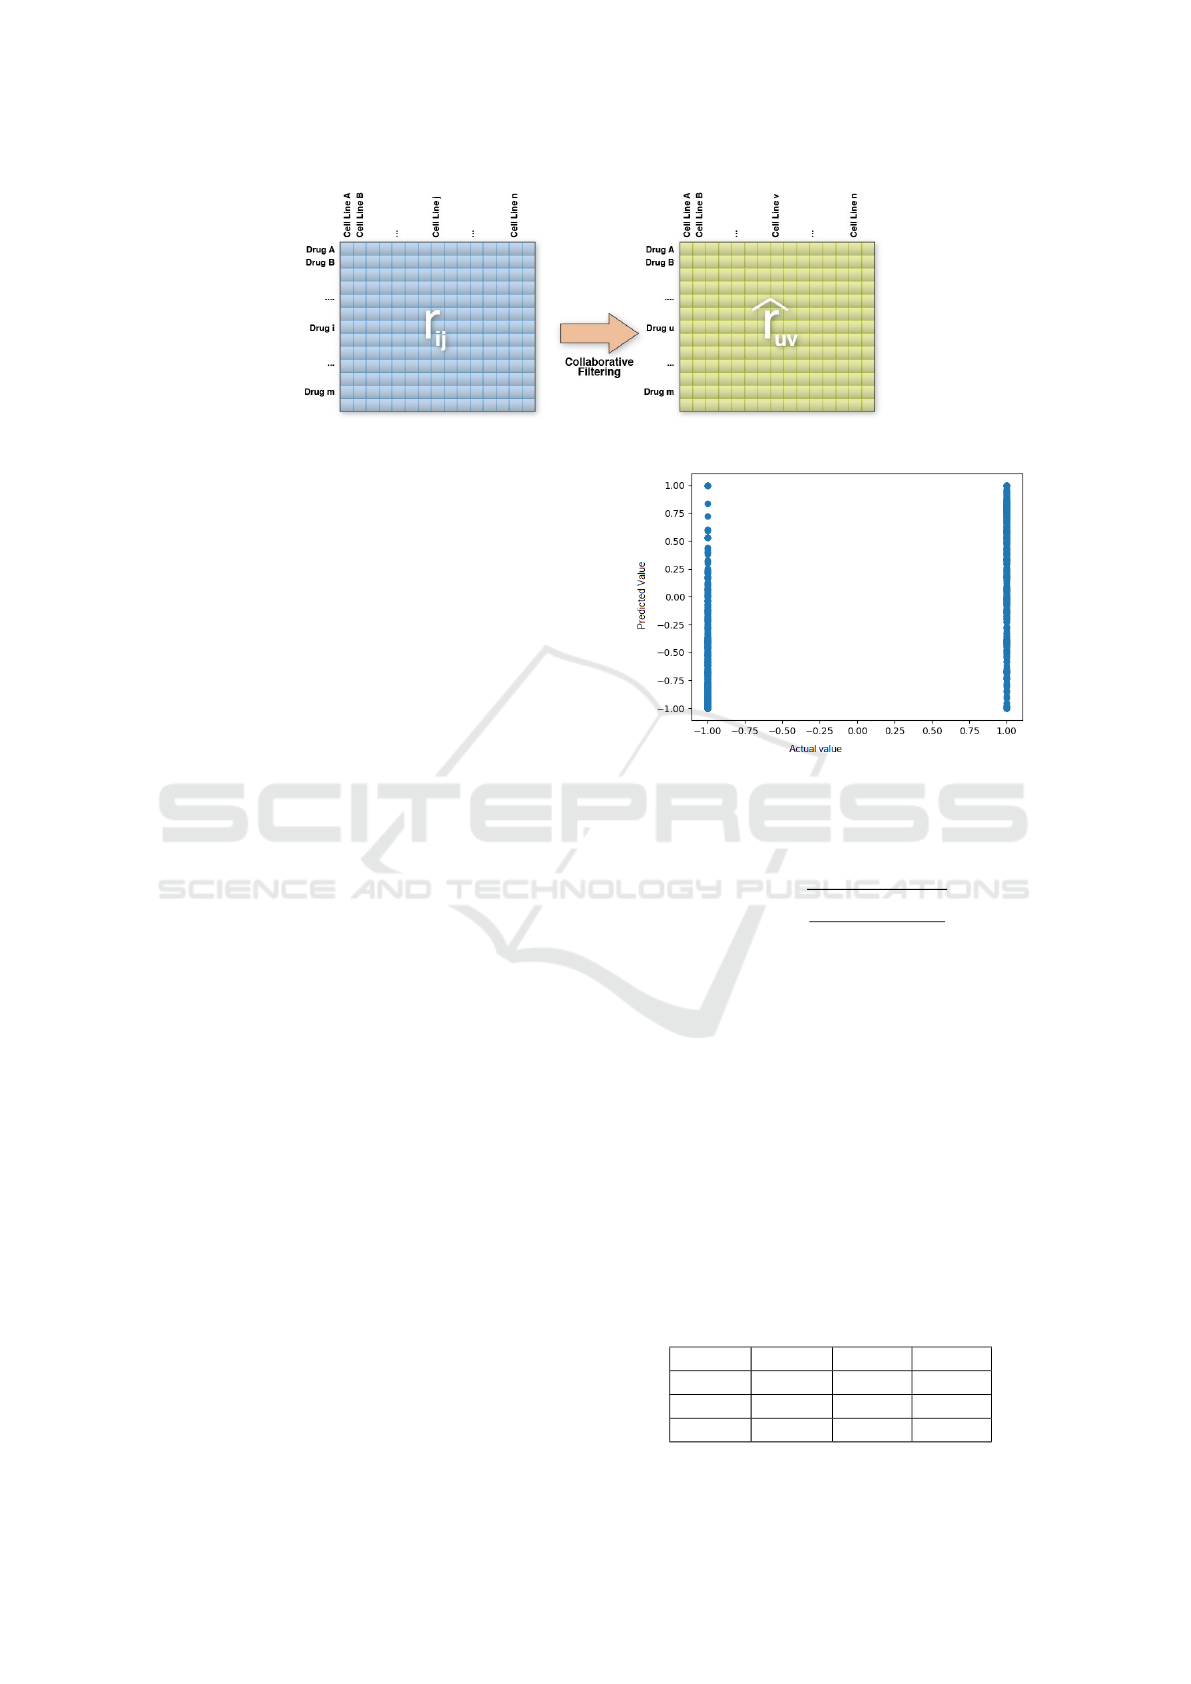
Figure 4: Collaborative Filtering for computed estimated values ˆr
i j
.
tion 3. Error e
ui
is the difference between reported
and predicted values. Baselines b
u
and b
v
correspond
to drugs, and cell lines, respectively, and are initial-
ized to 0.
b
u
← b
u
+ γ(e
uv
− λb
u
)
b
i
← b
v
+ γ(e
uv
− λb
v
)
p
u
← p
u
+ γ(e
uv
· q
v
− λp
u
)
q
i
← q
v
+ γ(e
uv
· p
u
− λq
v
)
(3)
We perform a 10-fold cross-validated GridSearch
to find the best configuration for the algorithm. For
our problem, the best configuration is: 300 epochs,
learning rate γ = 0.002, and regularization term λ =
0.1.
5 RESULTS
For assessing predictions, we compared predicted val-
ues to actual values; which is defined by (Aggarwal,
2016) as performance evaluation via utility.
We trained our model with data from ChEMBL
version 24. Then, obtained the difference between a
newer version (25, 26, and 27) and 24 as ground-truth.
This difference contains only the records in the newer
version that do not appear in base version 24. Finally,
we compared predictions for unknown values to the
reported values in the difference dataset.
We mapped results as shown in Fig. 5. Ground-
truth values are discrete: −1 for inactivities, and 1 for
activities. Predicted values are continuous, and range
between −1 and 1. Mapping shows that we can iden-
tify predicted values for inactivities. Predictions have
a large error rate which can be caused by model spar-
sity.
We computed two metrics to assess our results:
Root mean squared error (RMSE), and Area Under
Receiver Operating Characteristic curve (AUROC).
RMSE computes the overall error over set
ˆ
R (equation
4). ROC curve is drawn by plotting the false-positive
rate on the X-axis and the true-positive rate the Y-axis
for varying values of a threshold t. AUROC provides
Figure 5: Results mapping (Predicted value vs Actual
value) for versions 24 and 25.
a concrete quantitative evaluation of the effectiveness
of the method (Aggarwal, 2016).
RMSE =
s
∑
ˆr
ui
∈
ˆ
R
(r
ui
− ˆr
ui
)
2
|
ˆ
R|
. (4)
Table 2 shows values of RMSE and AUC for
model trained with ChEMBL version 24, and tested
against versions 25, 26, and 27. Best values are ob-
tained when training with v24, and testing v25.
Fig. 6 shows ROC curves for model trained with
ChEMBL version 24, and tested against versions 25,
26, and 27. When versions are more apart, i.e., v24
for training, and v27 for testing, performance de-
creases.
Finally, when working with the two most recent
versions of ChEMBL, training with v26, and testing
with v27, we achieve a RMSE of 0.684, and an Area
Under ROC curve of 0.830. Fig. 7 shows the ROC
curve for versions 26 and 27.
Table 2: RMSE and AUC for different testing datasets.
Train Test RMSE AUC
v24 v25 0.7398 0.8961
v24 v26 0.7751 0.8747
v24 v27 0.7838 0.8694
Simple Matrix Factorization Collaborative Filtering for Drug Repositioning on Cell Lines
773
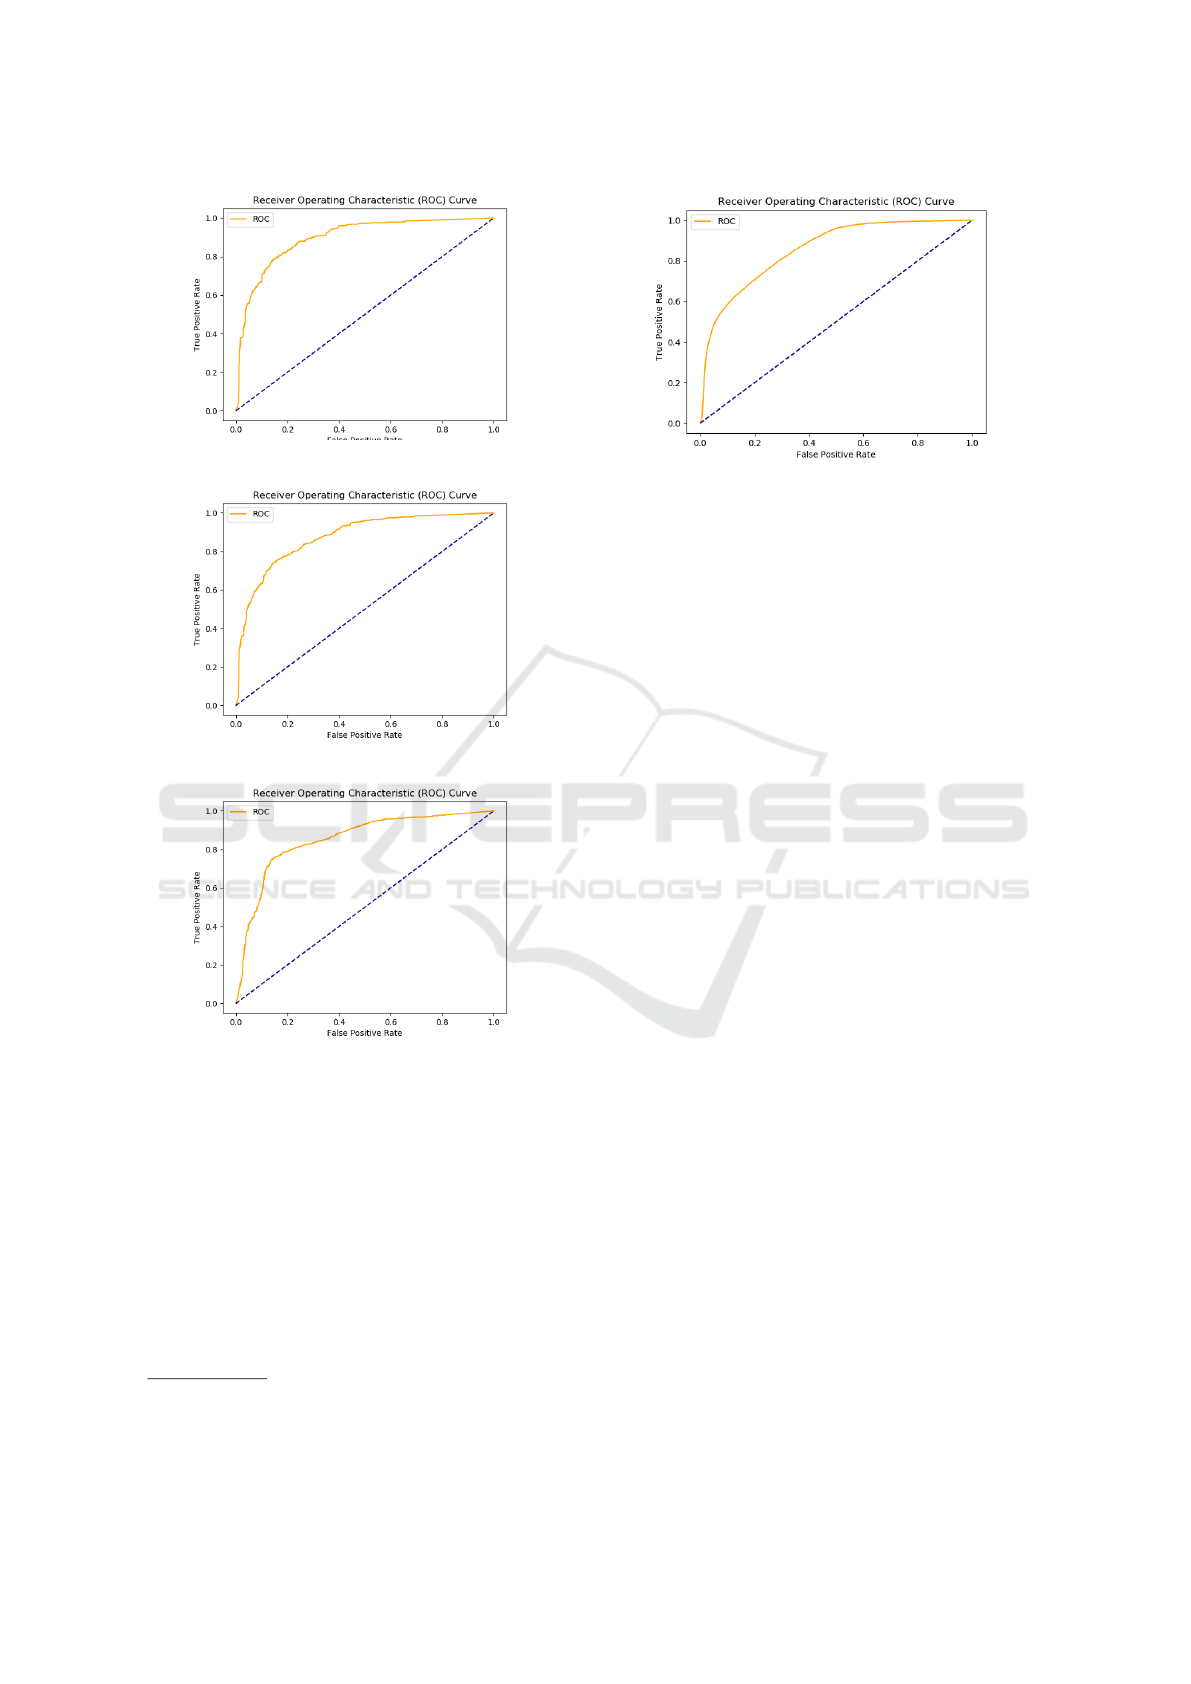
(a) Versions 24 and 25.
(b) Versions 24 and 26.
(c) Versions 24 and 27.
Figure 6: ROC curve for versions (former is for training,
latter is for testing).
6 DISCUSSION
This work achieves its goal of developing a sim-
ple, straightforward, and comprehensive model for
the discovery of new drug-cell line interactions using
a collaborative filtering recommender system. The
strong points of our model are its simplicity and its
performance. In our recommender system, an inter-
action matrix is formed, where the reported activities
1
Largest dataset if more than one is defined
2
Corresponding to largest dataset if more than one is de-
fined
Figure 7: ROC curve for versions 26 and 27.
(or inactivities) of drugs over cellular lines are stored.
Unknown values are then computed using simple ma-
trix factorization, minimizing the regularized squared
error.
Our model evaluates predicted rankings via util-
ity (Aggarwal, 2016), comparing two versions of the
same database. We use four versions of ChEMBL
database: 24 to 27. Predictions are assessed by com-
paring newer with older versions, e.g., train our model
with version 24, obtain the difference between version
25 and 24 as our ground-truth, and then assess if the
new values of version 25 can be predicted from the
information of version 24.
Compared with other recommender system mod-
els for drug repositioning, as described in Section 3,
our model is more comprehensive, i.e., it works for
a larger set of cellular lines and drugs. In our case,
our model comprehends a set of 314,392 molecules,
1,254 cellular lines, and 3,057,368 reported activities.
Our model performs well when dealing with spar-
sity, as Interaction Matrix R was only 0.77% com-
plete. Also, this model includes negative examples
of drug-cell line interactions.
We present a model that does not integrate chem-
ical data for drugs, nor genomic data for cell lines.
Nevertheless, we have been able to obtain a strong
performance for our predictions.
This work has the limitation of the cold-start prob-
lem, which is defined as what items would the system
recommend to a new user, for certain characteristics
of items and users. Given that our model does not
incorporate drug or cell lines characterization data,
there is no way of answering the cold-start problem.
In further work, methodology can be extended to
incorporate chemical data for drugs, or genomic data
for cell lines, thus leveraging this model, achieving
better performance, and approaching the cold-start
problem.
HEALTHINF 2021 - 14th International Conference on Health Informatics
774

REPRODUCIBILITY
Experiments were performed on a server at the De-
partment of Computer Science at the University of
Porto. Server is a GNU/Linux server with 503GiB
of RAM, 96-core Intel(R) Xeon(R) Gold 6252 CPU
@ 2.10GHz processor.
Datasets and Python code for these experiments
are stored in Github repository: (https://github.com/
ivan-carrera/biostec2021).
REFERENCES
Aggarwal, C. C. (2016). Recommender Systems: The Text-
book. Communications of the ACM. Springer Inter-
national Publishing, NY, USA.
Alberts, B., Johnson, A., Lewis, J., Raff, M., Roberts, K.,
and Walter, P. (2002). Isolating cells and growing
them in culture. In Molecular Biology of the Cell. 4th
edition. Garland Science.
Ashburn, T. T. and Thor, K. B. (2004). Drug reposition-
ing: identifying and developing new uses for exist-
ing drugs. Nature Reviews Drug Discovery, 3(8):673–
683.
Chen, J., Cheng, G.-H., Chen, L.-P., Pang, T.-Y., and Wang,
X.-L. (2013). Prediction of Chemotherapeutic Re-
sponse in Unresectable Non-small-cell Lung Cancer
(NSCLC) Patients by 3-(4,5-Dimethylthiazol-2-yl)-
5-(3-carboxymethoxyphenyl)-2-(4-sulfophenyl)-2H-
tetrazolium (MTS) Assay. Asian Pacific Journal of
Cancer Prevention, 14(5):3057–3062.
Cheng, F., Liu, C., Jiang, J., Lu, W., Li, W., Liu, G., Zhou,
W., Huang, J., and Tang, Y. (2012). Prediction of
Drug-Target Interactions and Drug Repositioning via
Network-Based Inference. PLoS Computational Biol-
ogy, 8(5):e1002503.
Cruz-Monteagudo, M., Sch
¨
urer, S., Tejera, E., P
´
erez-
Castillo, Y., Medina-Franco, J. L., S
´
anchez-
Rodr
´
ıguez, A., and Borges, F. (2017). Systemic
QSAR and phenotypic virtual screening: chasing
butterflies in drug discovery. Drug Discovery Today,
22(7):994–1007.
Dovrolis, N., Kolios, G., Spyrou, G., and Maroulakou, I.
(2017). Laying in silico pipelines for drug reposition-
ing: a paradigm in ensemble analysis for neurodegen-
erative diseases. Drug Discovery Today, 22(5):805–
813.
Emdadi, A. and Eslahchi, C. (2020). DSPLMF: A Method
for Cancer Drug Sensitivity Prediction Using a Novel
Regularization Approach in Logistic Matrix Factor-
ization. Frontiers in Genetics, 11.
Gao, J., Che, D., Zheng, V. W., Zhu, R., and Liu, Q. (2012).
Integrated QSAR study for inhibitors of hedgehog sig-
nal pathway against multiple cell lines:a collaborative
filtering method. BMC Bioinformatics, 13(1):186.
Gaulton, A., Bellis, L. J., Bento, A. P., Chambers, J.,
Davies, M., Hersey, A., Light, Y., McGlinchey, S.,
Michalovich, D., Al-Lazikani, B., and Overington,
J. P. (2012). ChEMBL: a large-scale bioactivity
database for drug discovery. Nucleic Acids Research,
40(D1):D1100–D1107.
Hug, N. (2020). Surprise: A python library for recom-
mender systems. Journal of Open Source Software,
5(52):2174.
Koren, Y., Bell, R., and Volinsky, C. (2009). Matrix Factor-
ization Techniques for Recommender Systems. Com-
puter, 42(8):30–37.
Liu, H., Zhao, Y., Zhang, L., and Chen, X. (2018). Anti-
cancer Drug Response Prediction Using Neighbor-
Based Collaborative Filtering with Global Effect Re-
moval. Molecular Therapy - Nucleic Acids, 13:303–
311.
Nosengo, N. (2016). Can you teach old drugs new tricks?
Nature, 534(7607):314–316.
Singh, A. P. and Gordon, G. J. (2008). Relational Learning
via Collective Matrix Factorization. In Proceedings
of the 14th ACM SIGKDD International Conference
on Knowledge Discovery and Data Mining, KDD ’08,
page 650–658, New York, NY, USA. Association for
Computing Machinery.
Sliwoski, G., Kothiwale, S., Meiler, J., and Lowe, E. W.
(2014). Computational methods in drug discovery.
Pharmacological Reviews, 66(1):334–395.
Strebhardt, K. and Ullrich, A. (2008). Paul Ehrlich’s magic
bullet concept: 100 years of progress. Nature Reviews
Cancer, 8(6):473–480.
Suphavilai, C., Bertrand, D., and Nagarajan, N. (2018). Pre-
dicting Cancer Drug Response using a Recommender
System. Bioinformatics, 34(22):3907–3914.
Tejera, E., Carrera, I., Jimenes-Vargas, K., Armijos-
Jaramillo, V., S
´
anchez-Rodr
´
ıguez, A., Cruz-
Monteagudo, M., and Perez-Castillo, Y. (2019). Cell
fishing: A similarity based approach and machine
learning strategy for multiple cell lines-compound
sensitivity prediction. PLoS ONE, 14(10):1–11.
Wang, A., Lim, H., Cheng, S.-Y., and Xie, L. (2018).
ANTENNA, a Multi-Rank, Multi-Layered Recom-
mender System for Inferring Reliable Drug-Gene-
Disease Associations: Repurposing Diazoxide as a
Targeted Anti-Cancer Therapy. IEEE/ACM Transac-
tions on Computational Biology and Bioinformatics,
15(6):1960–1967.
Wang, R., Li, S., Cheng, L., Wong, M. H., and Leung, K. S.
(2019). Predicting associations among drugs, targets
and diseases by tensor decomposition for drug reposi-
tioning. BMC Bioinformatics, 20(S26):628.
Zhang, L., Chen, X., Guan, N.-N., Liu, H., and Li, J.-Q.
(2018). A Hybrid Interpolation Weighted Collabora-
tive Filtering Method for Anti-cancer Drug Response
Prediction. Frontiers in Pharmacology, 9(SEP).
Simple Matrix Factorization Collaborative Filtering for Drug Repositioning on Cell Lines
775
