
The Relationship between Psychological Workload and Oculomotor
Indices under Visual Search Task Execution
Tomomi Okano and Minoru Nakayama
School of Engineering, Information and Communications Engineering, Tokyo Institute of Technology,
W9–107, Ookayama 2–12–1, Meguro-ku, Tokyo, 152–8550 Japan
Keywords:
Eye Movement, Microsaccade, Pupil Diameter, NASA-TLX, Psychological Workload, Subjective Evaluation.
Abstract:
In this paper, we have focused especially on microsaccade and pupil diameter to extract relationships with
psychological workload. We measured how these oculomotor feature values changes to 10 subjects when
executing visual search tasks containing psychological workload. To evaluate the amount of psychological
workload, we used a systematic evaluation index, NASA-TLX and analyzed by combining pupil movements
with answer rate and difficulty of both tasks. As a result, we have discovered that by the difference of psycho-
logical workload and 2 experimental conditions, microsaccade frequency and task performance changes.
1 INTRODUCTION
Us human beings are constantly making eye move-
ments. Not only when moving our eyes while chang-
ing the point of view, but also while we are gazing.
The reason why we have constant eye movements is
because only a small portion of the retina in our eyes
have good vision, thus in order to perceive a visual
object clearly in the center of the retina, we need to
generate eye movements. Therefore, the eye move-
ment which shakes in small increments, are necessary
for us to maintain vision.
Have you ever experienced your eyes shaking bit
by bit when getting nervous? That is a kind of
an eye movement due to psychological workload,
hence there may be a close relationship between the
two. For example, pupil diameter is smaller when
parasympathetic nervous system is working to the ad-
vantage and larger when sympathetic nervous system
is as so. Throughan analysis of pupil size and salivary
amylase, when subjects are shown disgusting stim-
uli images, it shows that there is an association be-
tween stress and pupillary response. (Atsuhiko et al.,
2011) Moreover, there are other researches that de-
scribes the cellular activity of the rostral colliculus
in the midbrain, which is responsible for transmitting
oculomotor information as signals, is closely related
to generating microsaccade. Microsaccades and other
oculomotor features are strongly associated with psy-
chological workload.
Recently, innovative eye-based systems are being
developed, includingbiometric identification and eye-
tracking technology. In order to promote the devel-
opment of an eye-friendly equipment in the future,
we believe that a feedback of psychological workload
of the operation is necessary.Variety of features such
as microsaccade, pupil size, and gaze time have been
proposed to objectively evaluate psychological stress
of users while using devices. In addition, because eye
movements can be measured without contact, it is ex-
pected to be an excellent indicator for objective eval-
uation. Through the study of changes in oculomotor
features due to psychological workload, the detection
of eye movement patterns during negative psycholog-
ical movements will help in the development of an
eye-friendly, smooth operative electronic devices.
Although we have noted that there has been many
similar studies linking microsaccade frequency and
psychological workload, there are still many un-
knowns. The general consideration of the relationship
between microsaccade frequency and psychological
workload is not clear since it has not used a system-
atic workload assessment. We created 2 experimen-
tal tasks with different presentation time and subjec-
tively evaluatedthem using NASA-TLX. The purpose
of this research are 2 points shown below.
• Clarifying the relationship between oculomo-
tor indices and psychological workload with a
systematic psychological workload assessment,
NASA-TLX.
• To examine effects of differences in presentation
time of various visual stimuli.
Okano, T. and Nakayama, M.
The Relationship between Psychological Workload and Oculomotor Indices under Visual Search Task Execution.
DOI: 10.5220/0010393403650371
In Proceedings of the 14th International Joint Conference on Biomedical Engineering Systems and Technologies (BIOSTEC 2021) - Volume 4: BIOSIGNALS, pages 365-371
ISBN: 978-989-758-490-9
Copyright
c
2021 by SCITEPRESS – Science and Technology Publications, Lda. All rights reserved
365
2 METHOD
2.1 Experimental Overview
In this research, we used 2 experimental tasks with
different stimuli presentation time to clarify the rela-
tionship between psychological workload and oculo-
motor features during task performance. Experiments
were conducted under the assumption that differences
in stimuli presentation time could be related to dif-
ferences in gaze area. The goal of the tasks were to
count the amount of specified figures to search for
in each question by looking at a screen with vari-
ous figures presented. Under the execution of experi-
ments, changes in psychological workload, microsac-
cade, and pupil size were investigated.
2.2 Experimental Tasks
In accordance with the purpose of experiment, 2 tasks
with different presentation time of the stimuli target
were created for observing eye movements caused by
psychological workload. By watching the screen with
several combination of figures, subjects were asked to
respond from 3 choices using the keyboard. In order
to keep the difficulty of the task linear, as the ques-
tion number increased by 1, the number of figures
displayed on the screen increased by 1, with the initial
value of 3 and 2 for Experiment 1 and 2 respectively
(See Table 1 for detail). To prevent microsaccades
from occurring due to excessive eye movements, a
cross was presented in the center of the screen as a fix-
ation point and subjects were instructed to keep their
eyes on it as long as possible. Presentation time and
specific procedures of the stimuli in each experiment
are listed below.
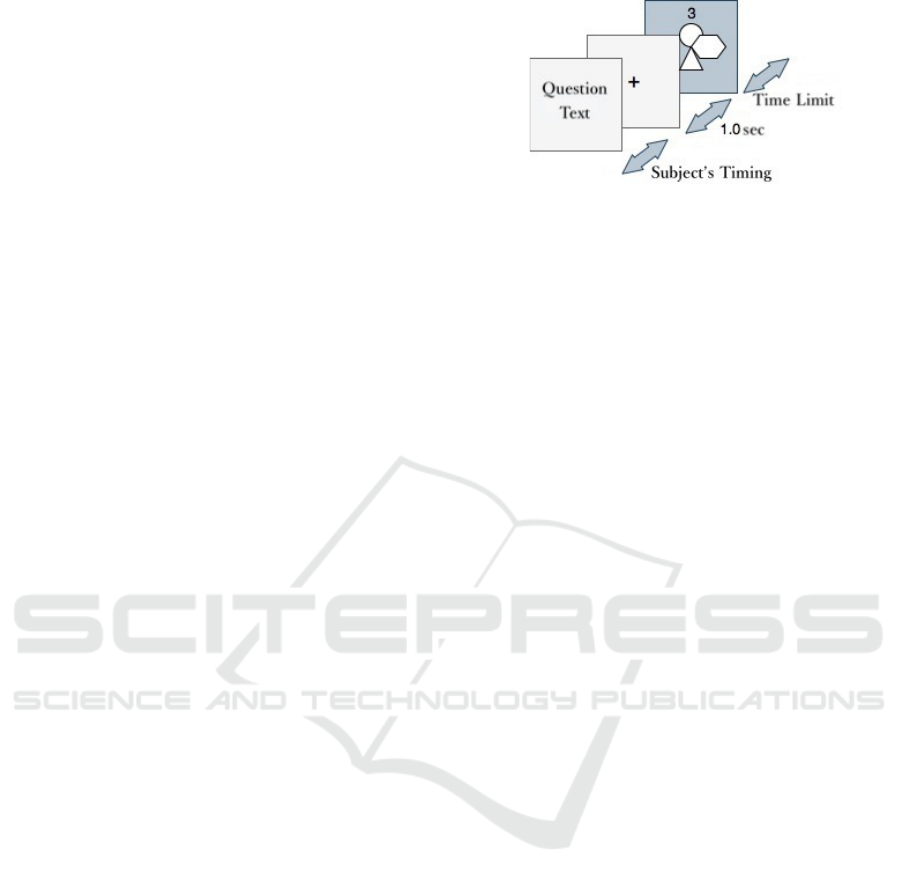
2.2.1 Experiment 1
The flow of presenting experimental stimuli in Exper-
iment 1 are as follows.
1. The figure asked to search for, 3 choices necessary
for answering, time limit are presented. When a
key is pressed by the subject, it switches to the
next slide.
2. A cross appears in the center of the screen for 1.0
second.
3. Various combinations of figures with overlap are
presented for 3 or 5 seconds(depends on the time
limit decided for each question). Subjects are able
to answer using the keyboard during this period of
time and when the answer is executed, it switches
to the next question.
Figure 1: Flow of Experiment 1.
To make subjects feel stronger psychological
workload, time limit was randomly set to 3 or 5 sec-
onds and there was no regularity for each question. 3
choices required for answering were also numerically
irregular. Figures that were presented were any com-
bination of 7 shapes, circles, triangles, squares, pen-
tagons, hexagons, heptagons, and octagons. Detailed
information about each question, time limit, and re-
quested figures to search for are shown in Table 1,
and the flow of Experiment 1 is shown in Figure 1.
2.2.2 Experiment 2
The flow of presenting experimental stimuli in Exper-
iment 2 are as follows.
1. The figure asked to search for, 3 choices necessary
for answering, time limit are presented. When a
key is pressed by the subject, it switches to the
next slide.
2. A cross appears in the center of the screen for 1.0
second.
3. For 0.5 seconds, various combinations of figures
are presented.
4. Cross flash continues for 2.4 seconds. Subjects
are able to answer using the keyboard during this
period of time and the screen does not change
even if the response is given.
Same as in Experiment 1, Experiment 2 was a
task to count figures that were asked by looking at the
screen with various figures presented. The difference
of the two were the number of seconds figures being
presented and the timing of the subject’s responses.
Detailed information about each question, time limit,
and requested figures to search for are shown in Table
1, and the flow of Experiment 2 is shown in Figure 2.
2.3 Experimental Devices
We used ViewPoint Eye Tracker 400 Hz Binocular
USB made by Arrington Research to measure eye
movements. Other devices such as the camera to mea-
sure the line of sight, infrared light irradiation device
that maintains brightness, jaw stand to fix the position
BIOSIGNALS 2021 - 14th International Conference on Bio-inspired Systems and Signal Processing
366
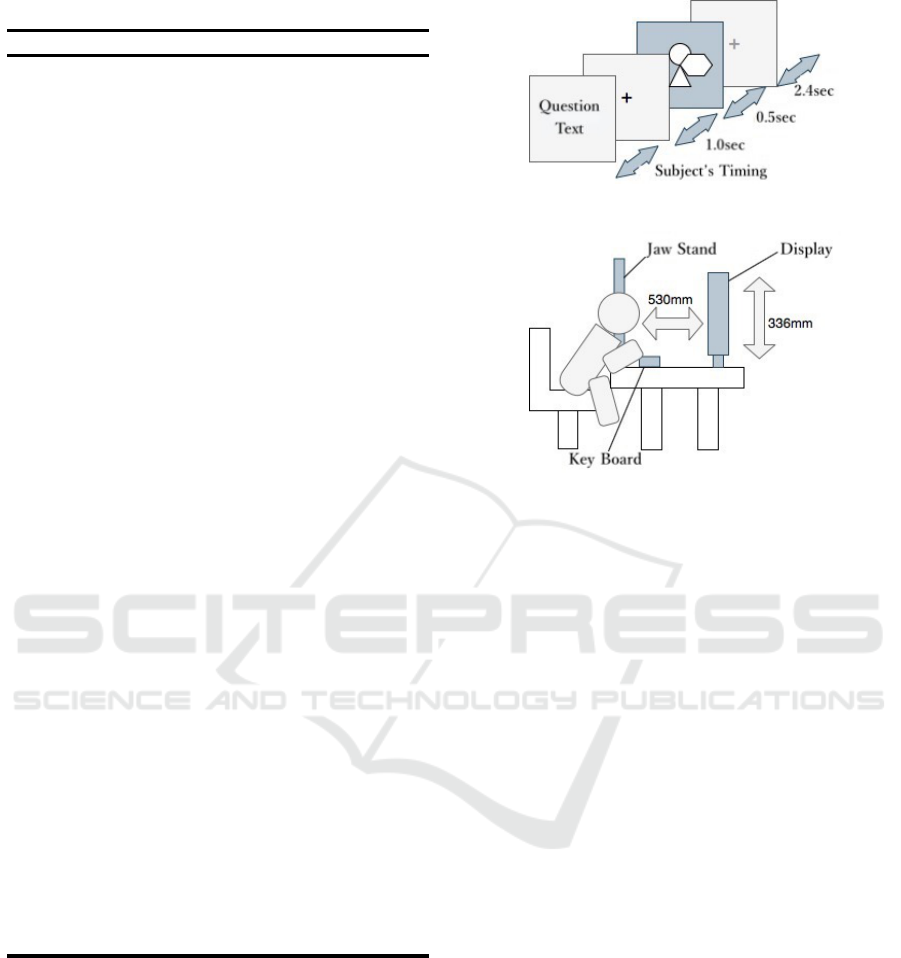
Table 1: Detailed information on experimental tasks.
Ques.No. Exp. Limit Amount Figure
1
Exp.1 3 3
Circle
Exp.2 - 2
2
Exp.1 3 4
Circle
Exp.2 - 3
3
Exp.1 3 5
Circle
Exp.2 - 4
4
Exp.1 3 6
Circle
Exp.2 - 5
5
Exp.1 3 7
Triangle
Exp.2 - 6
6
Exp.1 5 8 Square
Exp.2 - 7 Triangle
7
Exp.1 5 9 Heptagon
Exp.2 - 8 Square
8
Exp.1 3 10 Circle
Exp.2 - 9 Triangle
9
Exp.1 5 11 Hexagon
Exp.2 - 10 Pentagon
10
Exp.1 5 12
Circle
Exp.2 - 11
11
Exp.1 5 13 Circle
Exp.2 - 12 Triangle
12
Exp.1 5 14 Circle
Exp.2 - 13 Octagon
13
Exp.1 3 15 Circle
Exp.2 - 14 Square
14
Exp.1 5 16 Octagon
Exp.2 - 15 Circle
15
Exp.1 3 17 Triangle
Exp.2 - 16 Pentagon
16
Exp.1 3 18 Square
Exp.2 - 17 Heptagon
17
Exp.1 5 19 Pentagon
Exp.2 - 18 Triangle
18
Exp.1 5 20 Pentagon
Exp.2 - 19 Circle
19
Exp.1 5 21
Pentagon
Exp.2 - 20
20
Exp.1 5 22 Hexagon
Exp.2 - 21 Circle
of the head, Windows computer and keyboard to dis-
play stimuli and for answering were also used. Exper-
imental program was created using MATLABR2019a
and Psychtoolbox-3 was used to present experimental
stimuli.
Size of the display used was 336mm by 596.6mm
and we defined the distance from the jaw stand to the
display as 530mm. Sampling rate was 420Hz, in or-
der to prevent the line of sight from changing signifi-
cantly due to the vigorous eye movements of subjects,
graphic stimuli were set to fit in 87 mm square in the
center of the screen within a visual angle of 10 deg.
Figure 2: Flow of Experiment 2.
Figure 3: Schematic diagram of 2 experiments.
2.4 Subjective Evaluation
To evaluate the degree of psychological workload, the
following rating scales were used to assess in both
experiments.
2.4.1 NASA-TLX
To evaluate psychological workload, we asked sub-
jects to answer a subjective survey based on NASA-
TLX, a systematic psychological workload scale. We
considered other types of psychological workload
evaluation method such as SWAT although we chose
NASA-TLX because it had various types of evalua-
tion scales.
NASA-TLX, the most commonly used subjective
workload evaluation scale, is a method to obtain the
final workload as a numerical value by appropriately
weighting each 6 evaluation scales. For 6 specified
scales, there are line segments marked ”low” and
”high” at both ends and subjects were asked to mark
one point on the line segment where their feelings ap-
ply. The position of the mark is calculated as a raw
score. There is a calculation method of weight coef-
ficients using one-to-one comparison method. How-
ever in this method, weighting coefficients of items
that are not selected may be treated as 0, which leads
to calculation assuming with no contribution from
those items even though the raw score is not 0. There-
fore, we used a method to calculate weighting coeffi-
cients, by ranking each raw score. This method elim-
inates the possibility of items with a contribution of
The Relationship between Psychological Workload and Oculomotor Indices under Visual Search Task Execution
367
0, even though the raw scores are not 0. If the raw
scores are equal, the average of those ranks are taken.
From the ranking, weighting coefficient of all items
are determined, with the highest raw score to 6, other
items in descending order. The numeric amount of
psychological workload can be calculated by divid-
ing the sum of the multiplication of weighting coeffi-
cient and raw score of each scale by 21(= the addition
of 6 numbers 1 to 6) (Shinji, 2015). 6 items used in
NASA-TLX are listed below.
• Mental Demand (MD)
• Physical Demand (PD)
• Temporal Demand (TD)
• Performance (OP)
• Effort (EF)
• Frustration Level (FR)
2.4.2 Psychological State Assessment Items
Psychological state was rated on a scale of 1 (very
low) to 5 (very high) for 6 items: difficulty, irrita-
tion, impatience, confusion, activity, and exhilaration,
based on the evaluation items in (Haruki Mizushina,
2011).
2.5 Experimental Procedure
A total of 4 experiments were conducted per subject
(2 for Experiment 1, 2 for Experiment 2). With 20
questions in both experiments, we were able to obtain
data of 80 trials per subject. After completing every
experiment, subjects were asked to fill out a subjective
evaluation form about their psychological state to rate
how they felt. Since subjects needed to put off their
jaws from the jaw stand to answer the questionaire, in
order to prevent errors due to changes in the position
of the head and face when resuming, 9 points were
calibrated to confirm whether the left eye was clearly
visible and to obtain accurate viewpoints each time
the experiment restarted.
Prior to the experiment, subjects were asked to fill
out a consent form with full explanation of the exper-
iment. Informed consent was approved by the ethi-
cal committee of Tokyo Institute of Technology. (Ap-
proval number: A19054)
2.6 Subjects
Subjects were 10 undergraduateand graduate students
(5 males and 5 females) aged 20 to 23 years old. They
were confirmed if they had proper eye sight (both
eyes above 0.8 (American style 20/25)) with naked
eye vision or corrected vision. In this experiment,
corrected vision was limited to contact lens wearers
since glasses may reflect unnecessary light.
3 RESULTS
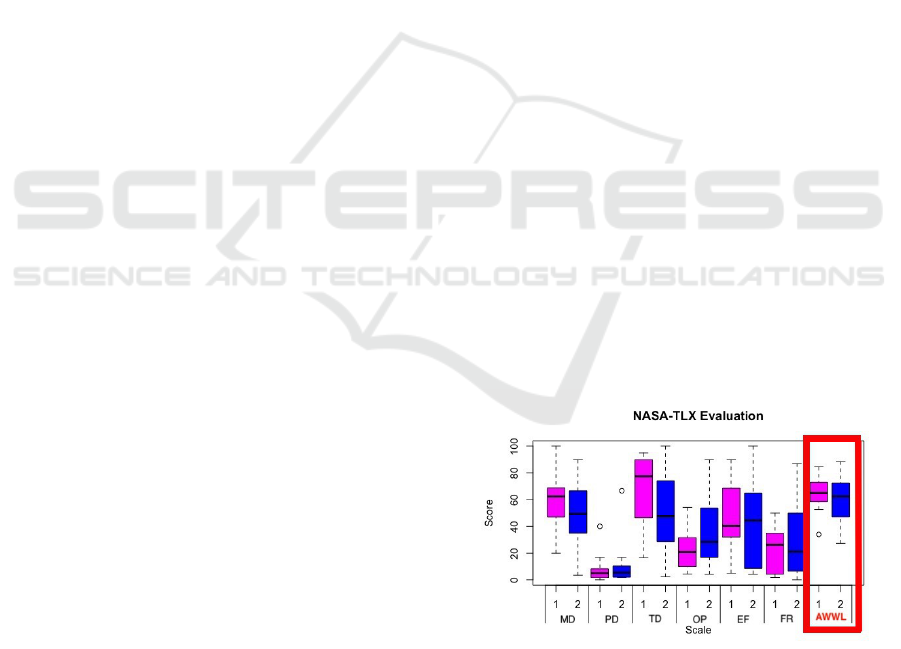
3.1 Subjective Evaluation
The results of psychological workload analyzed us-
ing NASA-TLX are shown as a boxplot in Figure 4.
It shows the distribution of 6 scales and AWWL score,
which is the overall value of psychological workload.
From this figure, 3 items, mental demand (MD), tem-
poral demand (TD) and frustration level (FR), were
higher in Experiment 1 than in Experiment 2, while
the remainingthree items, physical demand (PD), per-
formance (OP) and effort (EF), were higher in Exper-
iment 2 than in Experiment 1. Furthermore, AWWL
score for Experiment 1 was higher than that for Exper-
iment 2. A two-tailed t-test at 5% significance level
showed no significant difference in AWWL score be-
tween the experiments, although there was a tendency
that Experiment 1 had stronger psychological work-
load than in Experiment 2.
Distributions of psychological state assessment
items in 2 experiments are shown in Figure 5 and re-
sults of a two-tailed t-test at 5% level of significance
between 2 experiments for each items are shown in
Table 2. From Figure 5, most of the subjects gen-
erally found high load on difficulty and impatience.
Table 2 shows that there was a significant difference
in exhilaration at 5% level of significance between 2
experiments.
Figure 4: Subjective evaluation results in NASA-TLX for 2
experiments.
BIOSIGNALS 2021 - 14th International Conference on Bio-inspired Systems and Signal Processing
368
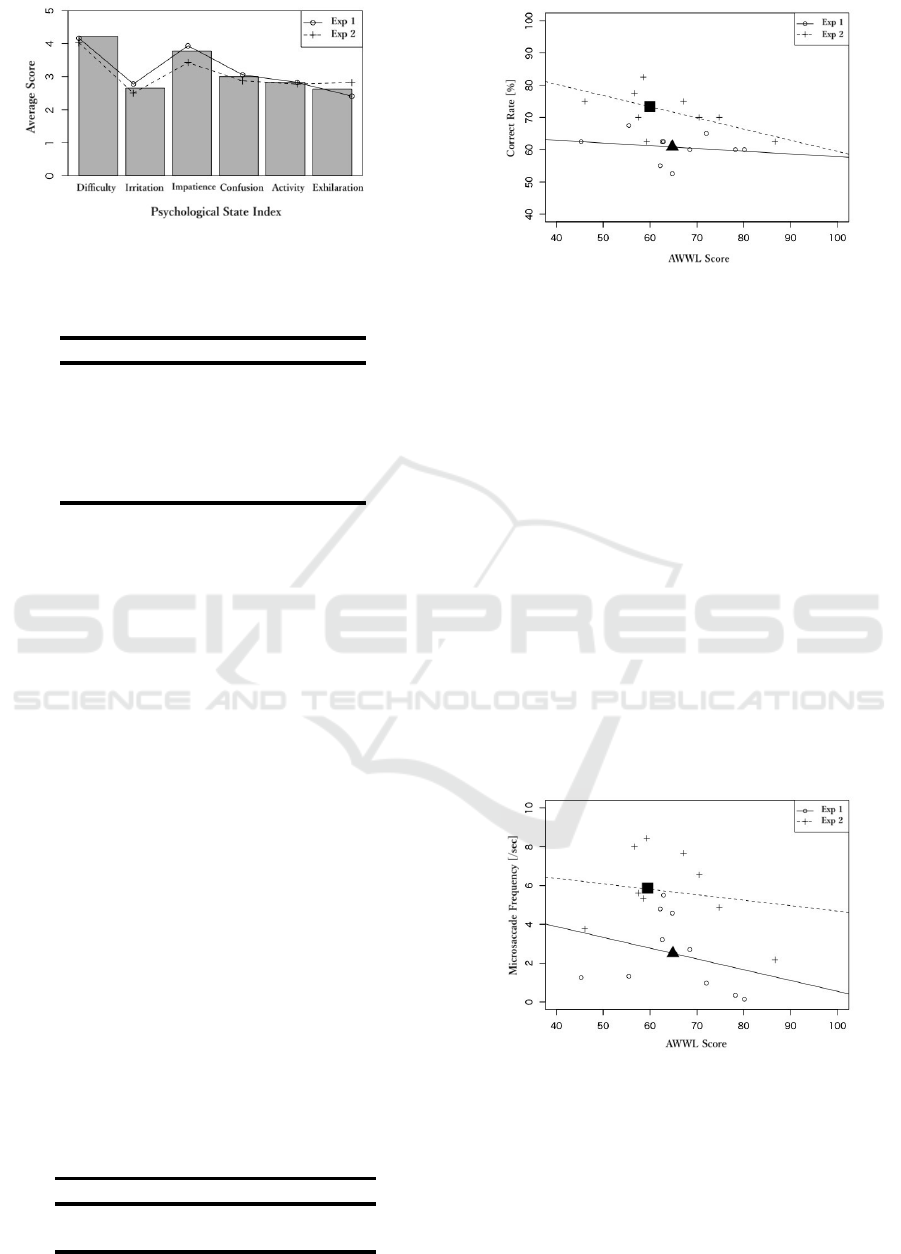
Figure 5: Evaluation results in specific psychological state
indicators.
Table 2: T-test (two-tailed) for psychological state index of
each experiment.
Psychological State t df p
Difficulty 0.99 15.82 n.s.
Irritation -1.82 26.97 0.080
Impatience 2.04 24.07 0.052
Confusion -1.27 28.85 n.s.
Activity 0.25 25.45 n.s.
Exhilaration -2.91 21.27 < 0.05
3.2 Relationship between Psychological
Workload and Assessment Features
for Different Presentation Time
The relationship between AWWL score and 3 indices,
correct rate, microsaccade frequency, and pupil diam-
eter, were analyzed in each experiment. For anal-
ysis, the threshold of pupil aspect ratio was set at
0.75. Data below 0.75 were treated as blinks there-
fore we excluded them under the constraint that pupil
size were sufficient for all subjects. For the analysis of
microsaccades, we utilized a method using the speed
of eye movements in (Ralf, 2006) (Ralf and Reinhold,
2003) (Ralf et al., 2015) and extracted those with am-
plitude less than 1 deg, maximum velocity of less than
200 deg/s to exclude saccades. The reference value of
pupil size was defined as the average of pupil diame-
ters in the cross presentation (the first 1.0 seconds of
each experiment). Table 3 shows the mean value of
correct rate, microsaccade frequency, and pupil size
of each experiment. A two-tailed t-test at 5% level of
significance for 3 indices showed t(14.54) = − 4.44,
p < 0.05 for correct rate, t(18) = 3.76,p < 0.05 for
microsaccade frequency, that reveals significant dif-
ferences due to experimental conditions. There was
Table 3: Mean values of 3 indicies in each experiment.
Correct Rate MS Freq. Pupil Ratio
Exp. 1 60.75 2.479 0.992
Exp. 2 73.00 5.779 0.995
Figure 6: AWWL score and correct rate.
no significant difference in pupil diameter.
This result shows that microsaccade frequency is
higher in Experiment 2 than in Experiment 1. Since
microsaccade is an oculomotor feature that occurs
when gazing, one of the reasons for the increase of
microsaccade frequency in Experiment 2 may be be-
cause eye movements were suppressed in shorter pre-
sentation time since gaze area was relatively larger.
Figures 6 to 8 are scatter plots showing the rela-
tionship between AWWL score (an index of psycho-
logical workload) and correct rate, microsaccade fre-
quency, pupil diameter respectively in 2 experiments,
with the regression lines of the analysis of covari-
ance at 5% level of significance for each. Black col-
ored triangles and squares represent the mean value of
AWWL score in Experiment 1 and 2. A table of anal-
ysis variance with equality tests for regression coef-
ficients on correct rate, microsaccade frequency, and
pupil diameter for AWWL score are shown in Table 4
to 6.
Figure 7: AWWL score and microsaccade frequency.
Table 4 shows that there was a difference on cor-
rect rate from an effect of different AWWL scores
and experimental conditions. As shown in 2 regres-
sion lines in Figure 6, correct rate decreased as psy-
chological workload increased and correct rate was
higher in Experiment 2, where the presentation time
The Relationship between Psychological Workload and Oculomotor Indices under Visual Search Task Execution
369
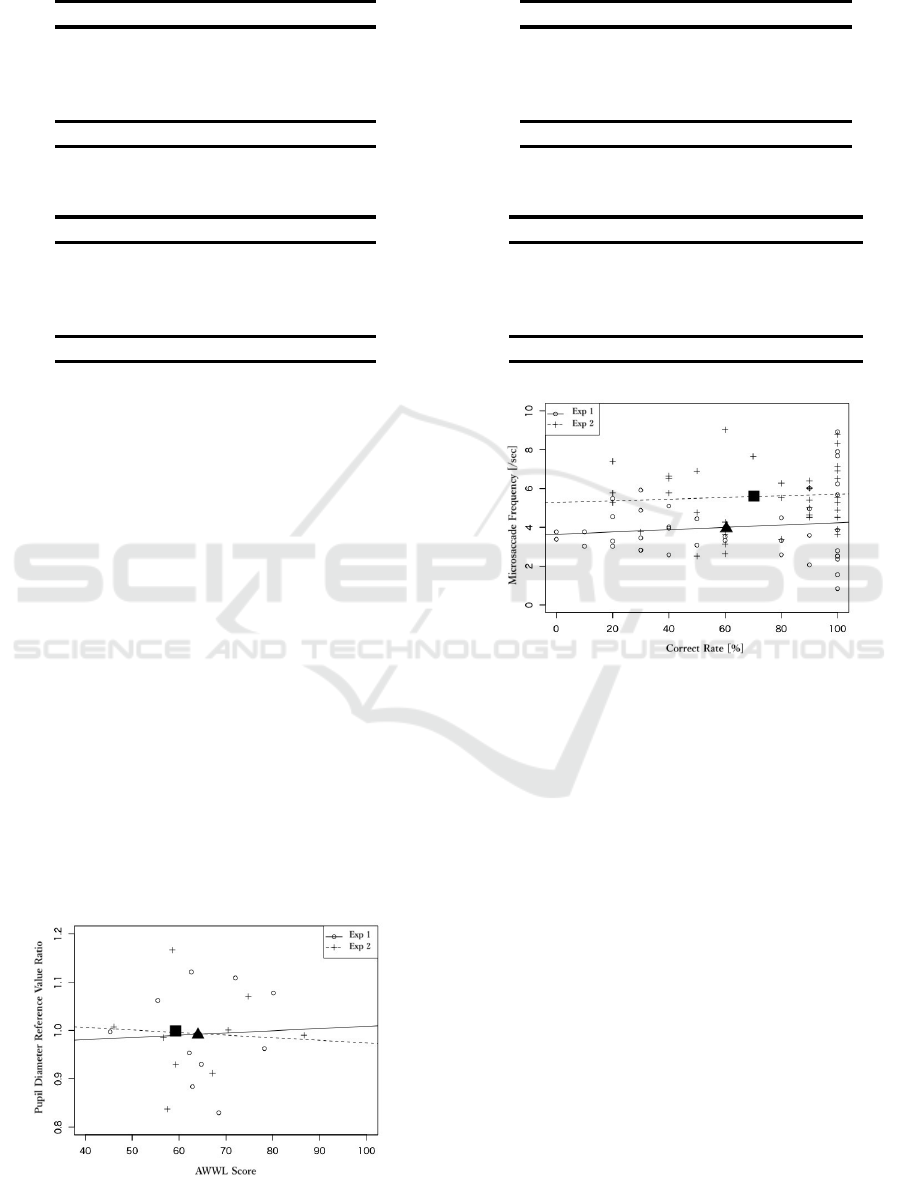
Table 4: Analysis of variance table with AWWL score in
correct rate.
Factors df SS F p
AWWL 1 358.2 13.30 < 0.05
Exp. 1 602.0 22.36 < 0.05
AWWL×Exp. 1 45.0 1.67 n.s.
Residual 16 430.8
Total 19 1436.0
Table 5: Analysis of variance table with AWWL score in
MS frequency.
Factors df SS F p
AWWL 1 10.58 2.62 0.12
Exp. 1 47.97 11.90 < 0.05
AWWL×Exp. 1 0.50 0.12 n.s.
Residual 16 64.52
Total 19 123.57
was shorter. Table 5 shows that there was a signif-
icant effect in different experimental conditions on
microsaccade frequency, with p = 0.12 for AWWL
scores, indicating a trend on an effect. In other
words, microsaccade frequency was affected by dif-
ferent experimental conditions and the occurrence of
microsaccade was higher in Experiment 2, which had
a shorter presentation time. In the regression line
shown in Figure 7, microsaccade frequencydecreased
as AWWL score increased, indicating that microsac-
cade frequency was reduced as psychological work-
load increased. For pupil diameter, there was no sig-
nificant effect on both AWWL score and experimen-
tal conditions, as shown in Table 6. There was no
interaction between AWWL scores and experimen-
tal conditions for all 3 indices. Thus, the effects of
different AWWL scores and experimental conditions
were found to work independently. Next, since
NASA-TLX is a macroscopic assessment, we exam-
ined the distribution of microsaccade frequency by
correct rates. As before, a plot of regression lines for
each experiment when performing an analysis of co-
Figure 8: AWWL score and pupil diameter.
Table 6: Analysis of variance table with AWWL score in
pupil diameter.
Factors df SS(10
−4
) F (10
−2
) p
AWWL 1 1.6 1.6 n.s.
Exp. 1 0.1 0.1 n.s.
AWWL×Exp. 1 6.5 6.5 n.s.
Residual 16 1607.4
Total 19 1615.6
Table 7: Analysis of variance table with microsaccade fre-
quency and correct rate.
Factors df SS F p
Correct Rate 1 8.13 2.89 n.s.
Exp. 1 44.71 15.87 < 0.05
Correct Rate × Exp. 1 0.04 0.02 n.s.
Residual 76 214.16
Total 79 267.04
Figure 9: Correct rate and microsaccade frequency.
variance at 5% level of significance are shown in Fig-
ure 9 and the analysis of variance table is shown in
Table 7. Black colored triangles and squares repre-
sent the mean value of correct rates in Experiments 1
and 2. Table 7 shows that differences in experimental
conditions significantly affected changes in microsac-
cade frequency and there was no interaction between
correct rates and experimental conditions. The re-
gression lines in Figure 9 shows that microsaccade
frequency was lower in Experiment 1 than in Experi-
ment 2 hence microsaccade frequencywas suppressed
in Experiment 1, which had a higher psychological
workload.
4 DISCUSSION AND SUMMARY
This article focused on microsaccade and pupil diam-
eter in 2 experiments with different presentation time
and analyzed the relationship between microsaccade
and pupil diameter using NASA-TLX, a systematic
BIOSIGNALS 2021 - 14th International Conference on Bio-inspired Systems and Signal Processing
370

measurement of psychological workload. Since there
were 80 trials per 1 subject, between-subjects factor
was taken into account by the repeated trials of sub-
jects.
• Differences between AWWL scores from NASA-
TLX assessment and experimental conditions
were found to have an effect of changing values
on 2 indices, correct rate and microsaccade fre-
quency. In other words, we could confirm that
correct rate and microsaccade frequency varied
depending on the difference in conditions of 2 ex-
periments which had different presentation time.
• There were negative correlations between AWWL
scores and correct rates, AWWL scores and mi-
crosaccade frequency, positive correlation be-
tween correct rates and microsaccade frequency.
Microsaccade frequency was significantly sup-
pressed as AWWL score increased which in-
dicates that psychological workload affects mi-
crosaccade frequency.
• From the experimental task shown in this arti-
cle, we were able to confirm differences in mi-
crosaccade frequency with different degrees of
psychological workload, however no correlation
was found for pupil diameter.
• An analysis of subjective assessments made by
subjects and various oculomotor features showed
that eye movements can help to estimate psycho-
logical workload.
In the future, we would like to examine in detail
how the differences in presentation time of experi-
mental stimuli affects in the size of gaze area.
REFERENCES
Atsuhiko, I., Takeshi, K., Tohru, K., Kosuke, M., Isao, H.,
and Takehiko, B. (2011). Evaluation of stressed con-
dition using pupillary responses (japanese). Seitai Ik-
ougaku (Biomedical engineering) 49(6):946-951.
Haruki Mizushina, Kiyomi Sakamoto, H. K.(2011). The
relationship between psychological stress induced by
task workload and dynamic characteristics of saccadic
eye movements (japanese). Denshi Jouhou Tsushin
Gakkai Ronbunshi (The IEICE transactions on in-
formation and systems (Japanese edition)) Vol.j94-D
No.10 pp.1640-1651.
Hideki, F. (2010). Increased saccade error due to stress
(japanese). Roudou Anzen Eisei Sougou Kenkyujo
Tokubetu Kenkyu Houkoku (National Institute of Oc-
cupational Safety and Health, Japan Report).
Hiroyuki, S. (2010). Temporal changes in the frequency
of microsaccades during the visual angle search task
(japanese). VISION Vol.22, No.2, 131-134.
Iijima, A. (2012). Visually induced autonomic modulation
and evaluation of the autonomic nervous system with
visual function (japanese). Equilibrium Res Vol.71(3)’
194-199.
Keiichiro, I. and Shiro, U. (2012). Neuronal mechanisms
for generation of microsaccades (japanese). Nihon
Shinkei Kairo Gakkaishi (Japanese Neural Network
Society report) Vol.19, No.3’135-144.
Krzysztof, K., Andrew, T., Anna, N., Cezary, B., and
Izabela, K. (2018). Eye tracking cognitive load
using pupil diameter and microsaccades with fixed
gaze. Eye tracking cognitive load using pupil diameter
and microsaccades with fixed gaze.PLoS ONE 13(9):
e0203629.
Ralf, E. (2006). Microsaccades: a microcosm for research
on oculomotor control, attention, and visual percep-
tion. CHAPTER 9, Martinez-Conde, Macknik, Mar-
tinez, Alonso and Tse(Eds.) Progress in Brain Re-
search, Vol.154.
Ralf, E., Petra, S., Konstantin, M., and Hans, T. (2015).
Microsaccade toolbox 0.9. Potsdam Mind Research
Repository.
Ralf, E. and Reinhold, K. (2003). Microsaccades uncover
the orientation of covert attention. Vision Research,
43, 1035-1045.
Shigeru, H. and Naoki, M. (1996). Japanese version of
nasa task load index: Sensitivity of its workload
score to difficulty of three different laboratory tasks
(japanese). Ningen Kougaku (The Japanese journal of
ergonomics) 32(2), 71-79.
Shinji, M. (2015). Special issues no. 3:measurement tech-
nique for ergonomics, section 3:psychological mea-
surements and analyses(6), mental workload assess-
ment and analysis -a reconsideration of the nasa-tlx-
(japanese). Ningen Kougaku (The Japanese journal of
ergonomics) Vol51, No.6.
Shinji Miyake, M. K.-S. (1993). Subjective mental work-
load assessment technique-an introduction to nasa- tlx
and swat and a proposal of simple scoring methods-
(japanese). Ningen Kougaku (The Japanese journal of
ergonomics) Vol29, No.6.
Yuta, T., Atsushi, N., and Nishida, T. (2015). Quanti-
tative relationship between human internal state and
pupil diameter (japanese). Jouhou Shori Gakkai
Dai77kai Zenkokutaikai (Information Processing So-
ciety of Japan 77th National Convention), 4-413 4-
414.
The Relationship between Psychological Workload and Oculomotor Indices under Visual Search Task Execution
371
