
Measuring Centers of Special Targets in Digital Still Images and
Movie Frames: Approach and Evaluation
Shakhzod Takhirov
a
Department of Civil and Environmental Engineering, University of California, Berkeley, U.S.A.
Keywords: Image Correlation, Digital Still Images, Digital Movie Frames, Non-contact Displacement Measurements,
Best Fitting, Evaluation.
Abstract: Digital cameras are undergoing explosive developments. As a result, high-resolution digital cameras have
become very affordable, especially with the latest growth in smart phone technologies. Hence, the usage of
existing measuring technologies and the development of new measuring technologies utilizing digital cameras
is in high demand. This paper utilizes special black and white patterns, the so-called targets, to measure the
relative displacement between two points. The paper introduces a new approach in measuring the location of
their centers that is based on best fitting the transition zones to straight lines. The intersection of these lines
produces the location of the center with sub-pixel accuracy. A special experimental rig was designed and built
to evaluate the approach and compare the measurements to those obtained by a conventional position
transducer connected to a data acquisition system. In the first part of the paper, the accuracy of the position
transducer and the experimental setup is discussed. It is shown that the accuracy of the setup is much greater
than the measurement expected from the digital images. Based on this, it was used as a reference system to
evaluate the approach. In the second half of the paper, the approach is evaluated based on monitoring two
targets. One of them is fixed and serves as a reference point, whereas another one is floating. The latter can
move along the linear bearing system axis, which is orthogonal to the axis of the camera lens. The
displacements of the floating target in respect to the fixed target were measured by a position transducer
connected to a data acquisition system. The relative displacement of the floating target is captured by the
digital camera and is based on the current location of the floating and fixed targets. This paper shows adequate
accuracy of the approach and provides recommendations on the ways of keeping it at high accuracy for
practical applications in experimental earthquake engineering.
1 INTRODUCTION
Digital still imaging cameras are commonly used as
an affordable tool for measuring surface deformations
and displacements of test specimens in experimental
studies. Digital still images can also be extracted from
digital movies as individual frames. This provides an
opportunity to use digital cameras in quasi-static and
dynamic experiments as well. Certainly, in the latter
case the main limitation is going to be the number of
frames per second. With the current development in
digital cameras, access to high-resolution cameras
with rates greater than the normal 30 frames per
second is rapidly increasing. In addition, the cost of
cameras is dramatically decreasing because of high
demand by several industries: autonomous cars,
a
https://orcid.org/0000-0002-4396-7946
surveillance monitoring cameras, and smart phones,
to name a few. Therefore, the usage of digital still
images or movie frames is steadily increasing in
many fields, including experimental earthquake
engineering. A digital imaging camera has become an
affordable and easy to access tool for monitoring
surface deformations and relative displacements
(Ogorzalek et al 2017, as an example). In addition, it
represents one of the most cost-effective ways of
measuring the relative displacements of a complex
system with several moving parts. An example is
presented in Figure 1. This image shows a typical
suspended ceiling system consisting of a grid and lay-
in panels. Because of the gap between the grid and the
panels, the movements of the grid are different from
those of the panels. To monitor all these displacement
136
Takhirov, S.
Measuring Centers of Special Targets in Digital Still Images and Movie Frames: Approach and Evaluation.
DOI: 10.5220/0010392901360142
In Proceedings of the 9th International Conference on Photonics, Optics and Laser Technology (PHOTOPTICS 2021), pages 136-142
ISBN: 978-989-758-492-3
Copyright
c
2021 by SCITEPRESS – Science and Technology Publications, Lda. All rights reserved
differences, an installation of many position
transducers is needed, which is not practical. In
addition, conventional instrumentation is not
preferred because it can alter the system performance
due to the added weight of instrumentation. This can
be addressed by utilizing measurement techniques
based on the digital images. In this case, the
movements of the panels and the grid can be
monitored by these non-contact measurements.
Figure 1: Monitoring grid and panel displacements in
testing of suspended ceiling system.
2 MOTIVATION
The main motivation was to develop a reliable
technique of non-contact displacement measurements
when installation of many position transducers is not
practical or too expensive. In addition, accuracy
estimation is crucial for achieving high quality of test
data and such, needs to be provided for the analysis
of the experimental data. Recommendations on the
position of the camera in respect to the experimental
setup required to achieve higher accuracy are very
valuable too. In addition, the proper selection of
settings in digital cameras is also very important to
achieve high-quality measurements.
3 EXPERIMENTAL SETUP AND
REFERENCE INSTRUMENT
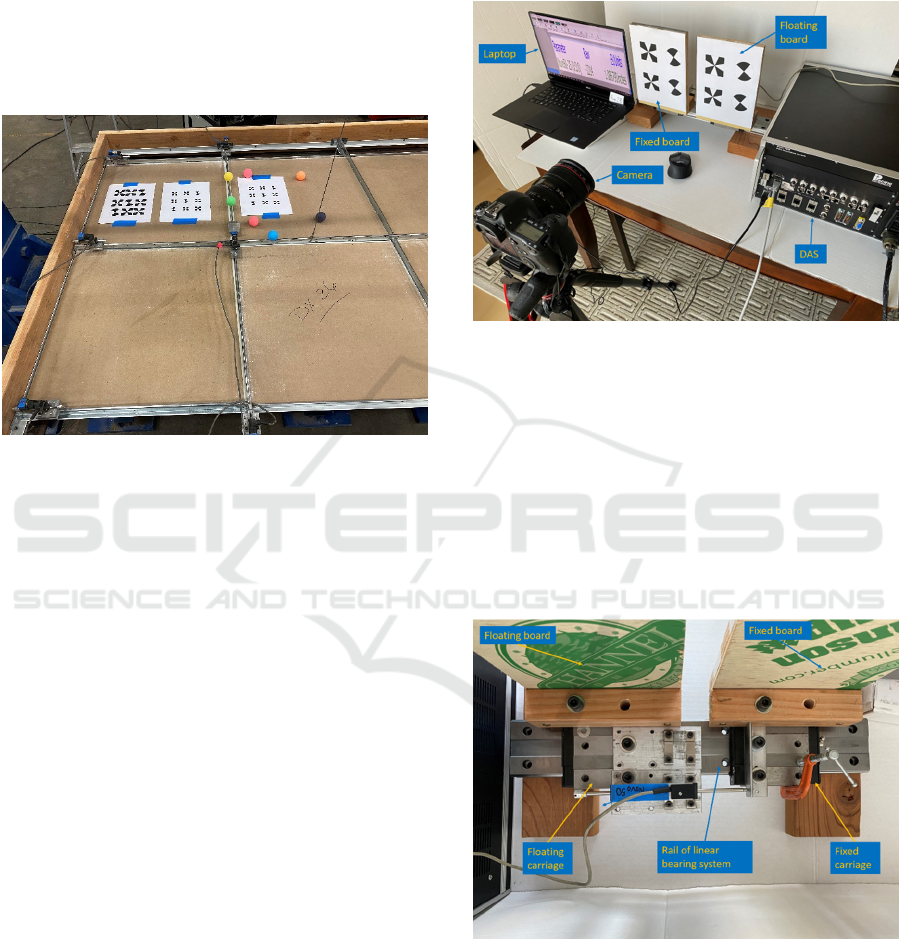
A special experimental setup was developed and
assembled to evaluate the accuracy of the monitoring
conducted by the targets. As shown in Figure 2, the
targets were installed on two vertical boards located
in the same plane. Each target represents a special
black and white pattern printed on a sheet of paper
and attached to the surface to be monitored. Quite a
few patterns are used in practical applications with a
recent extensive review of their specifics summarized
in (Janßen et al 2019).
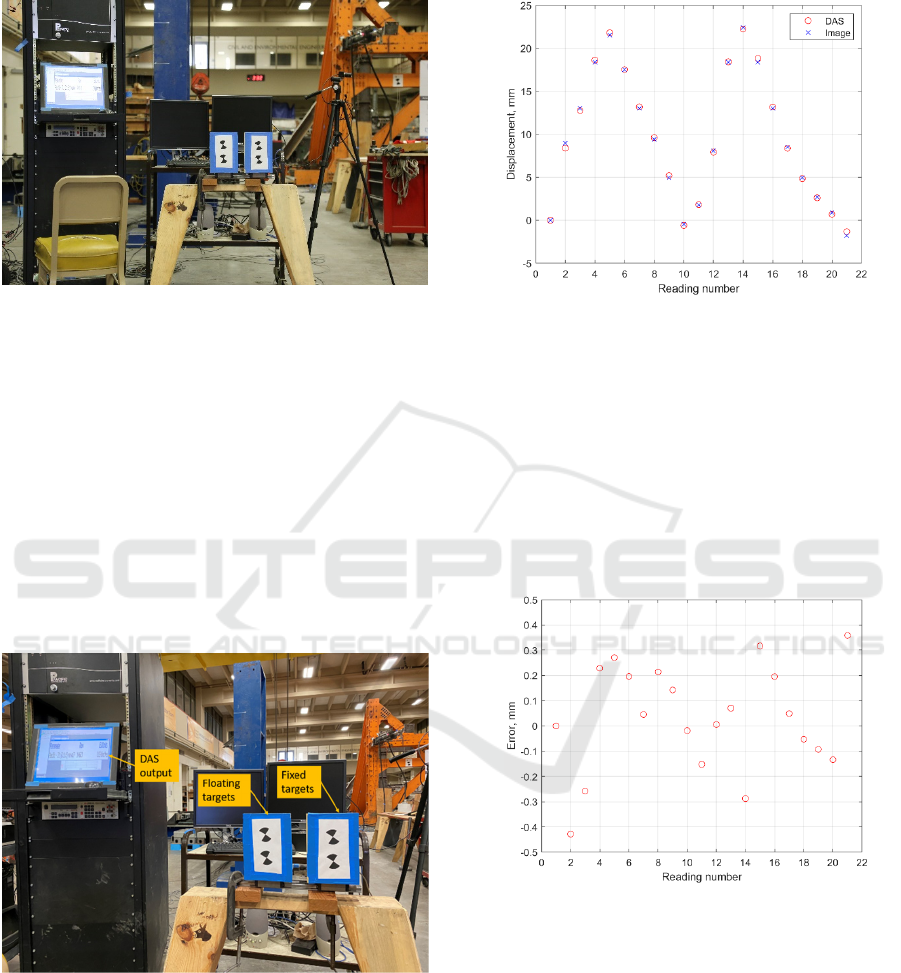
Figure 2: Front view of experimental setup.
Each board shown in Figure 2 was attached to a
different carriage of a linear bearing system as shown
in Figure 3. One of them was fixed and the other was
free to slide along the rail of the linear bearing system.
The latter was called a floating carriage. The axis of
the linear bearing system was orthogonal to the axis
of the camera’s lens. As a result, due to the presence
of the linear bearing system, both boards were
restrained to move in the same plane orthogonal to the
camera’s lens.
Figure 3: Top view of experimental setup: linear bearing
system with carriages.
The relative displacement between the fixed and
floating carriages was monitored by a position
transducer as shown in Figure 4. This position
transducer was used as a reference. The setup utilized
TR0050 (Novotechnik U.S., Inc., 2014), a position
transducer with a specified linearity of 0.15% of full
Measuring Centers of Special Targets in Digital Still Images and Movie Frames: Approach and Evaluation
137
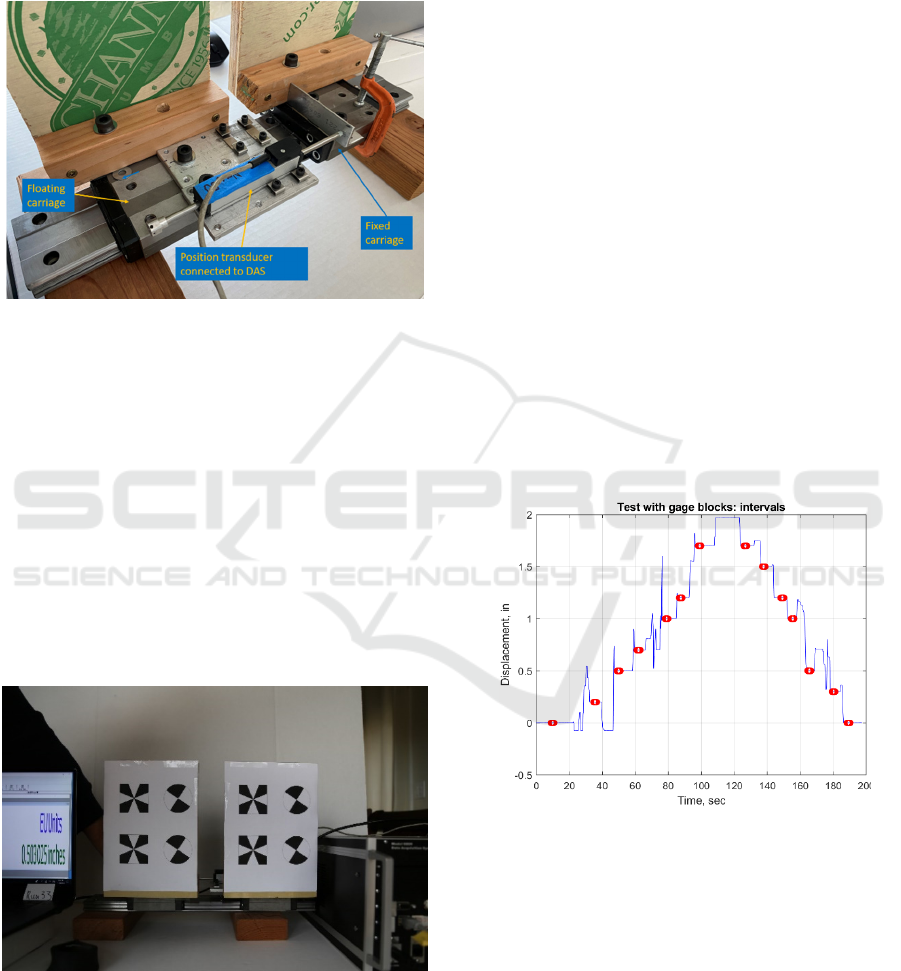
scale. The transducer had a full stroke of 50 mm or
about 2 inches. The readings of the position
transducer were acquired by PI-6008U, a data
acquisition system (DAS) from Pacific Instruments,
Inc. (Pacific Instruments, Inc, 2017).
Figure 4: Reference position transducer to monitor relative
displacement.
A few targets were installed on the boards as
presented in Figure 5. One of them is a black and
white target commonly used for laser scanning (see
Takhirov, 2010, as an example). The second one, is a
target similar to the so-called BOTA8 proposed by
(Janßen et al 2019). The target used in this study
utilized an opposite colouring pattern when compared
to BOTA8. For the purposes of this paper, the
discussion of the approach and its evaluation are
discussed only for the round target. A full-frame
digital camera, Canon EOS 6D DSLR in this
particular case, was installed on a tripod to capture the
movements of the floating targets.
Figure 5: Typical image frame.
A typical still image of the targets is presented in
Figure 5. It shows the floating and fixed boards on the
right and left sides, respectively. In addition, to
achieve real-time correlation to the reference
displacement, the latter was displayed on the left side
of the screen as shown in Figure 5. Presence of the
reference displacement in the same image with the
targets is especially important for movie frames
because then no time correlation is needed.
4 EVALUATION OF
REFERENCE ACCURACY
Prior to evaluating the target monitoring accuracy
approach, accuracy of the reference position
transducer was measured. It was performed in the
following way. High-precision steel calibration
blocks were used (Mitutoyo, 2016). The blocks were
Grade 0 which ensures that their tolerance is about a
few micro-inches (or about 0.0001 mm). The position
transducer was calibrated at two points and its
readings were checked with several gage blocks at
many other displacement points as presented in
Figure 6. This plot shows the readings collected by
DAS when the position transducer is displaced by
various gage blocks. The collected data was averaged
over 400 points to obtain a reading of the reference
position transducer with a certain gage block. Those
points are shown as red circles in Figure 6.
Figure 6: Displacement of position transducer with various
high-precision gage blocks.
Each averaged reading was compared to the
corresponding gage block and the error between the
two values was calculated. It is presented in Figure 7.
As it is shown in this plot, the error does not exceed
0.015 mm. Based on the specifications of the position
transducer, the expected linearity is 0.15% of full-
scale, which equals to 0.075 mm for the 50 mm
instrument used herein. Hence, based on this accuracy
measurement, it was concluded that the accuracy of
this particular transducer is much better than the
PHOTOPTICS 2021 - 9th International Conference on Photonics, Optics and Laser Technology
138
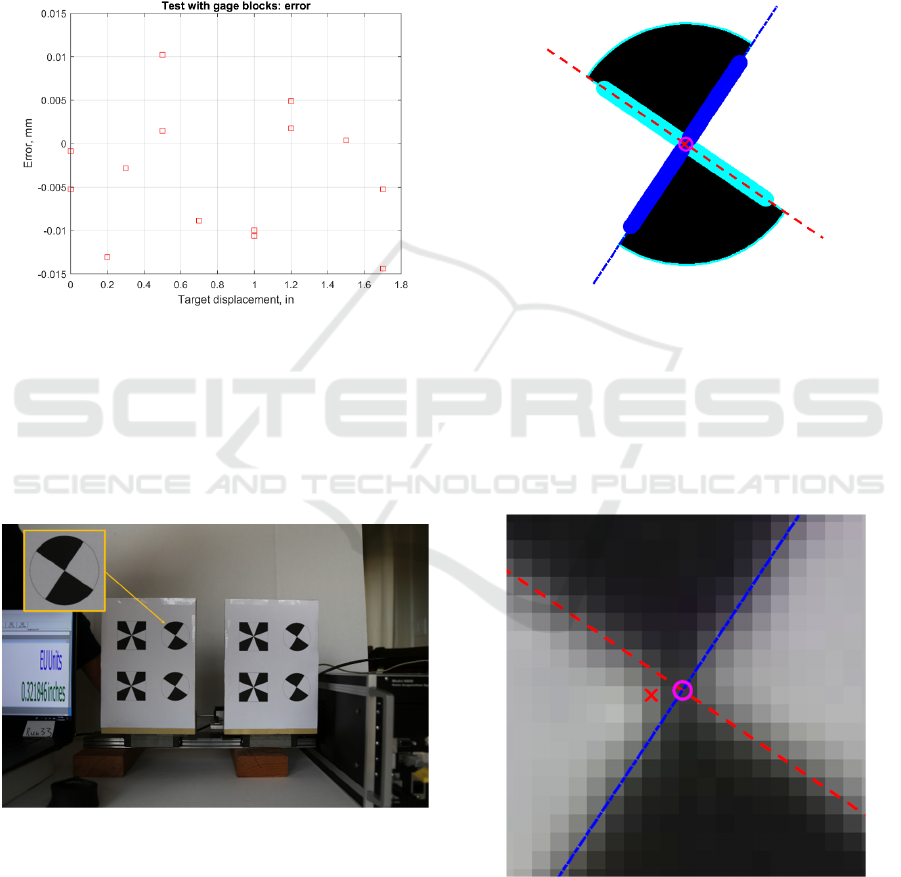
specifications established for their mass production.
It is worth noting that the accuracy measurement
included possible uncertainties associated with the
data acquisition system and DAS accessories (a cable,
for example).
These preparatory steps show that this
experimental setup has an adequate accuracy for the
evaluation of the accuracy of monitoring by targets
introduced in this paper.
Figure 7: Error of position transducer with respect to gage
blocks.
5 RESULTS OF IMAGE
REDUCTIONS: CLOSE
PROXIMITY
Figure 8: Step 1: find target’s pattern in image.
All image manipulations were conducted in the
Matlab environment (MathWorks, 2016). The image
reduction was based on utilization of the target’s
specific pattern. It was conducted in two steps. In the
first step, the location of the target’s pattern shown in
Figure 8 was identified based on Fast Normalized
Cross-Correlation, FNCC, (Lewis, 1995a and 1995b).
In this step, the location of the target’s center is
estimated with pixel accuracy.
In the second step, the transition points between
the black and white zones are determined. Based on
the target pattern, points for two subsets are separated
from each other. One subset corresponds to a slope of
less than 90 degrees whereas another one corresponds
to a slope greater than 90 degrees. These subsets are
best fit to straight lines as presented in Figure 9.
Figure 9: Step 2: Target’s center as intersection of two
straight lines best fit to the transition points.
As it was noted earlier, step 1 serves as an
intermediate step to identify an approximate location
of the target’s center. This step helps to speed up the
calculation of a more accurate estimation of the
target’s center. The difference between the results of
the two steps is presented in Figure 10.
Figure 10: Target’s center: step 1 (red cross) and step 2
(magenta circle).
As it can be seen from Figure 10, step 2 estimates
the target’s center with a subpixel accuracy. Now, if
the correlation between the pixels and the engineering
Measuring Centers of Special Targets in Digital Still Images and Movie Frames: Approach and Evaluation
139
units is defined, this approach estimates the location
of the center in mm with a much higher accuracy than
the one based on the FNCC procedure.
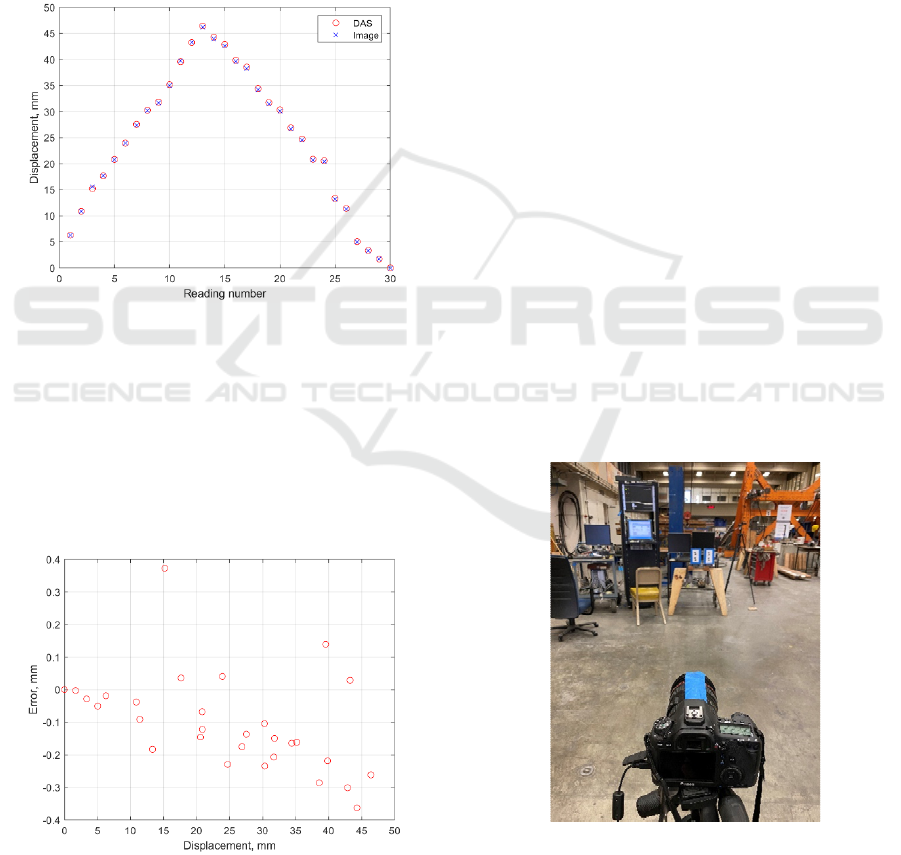
The correlation between the pixels and
engineering units, mm in this case, was based on
measurements of the target’s radius in both pixels and
mm. A comparison between the measurements of the
position transducer and the moving target monitored
by the still images, is presented in Figure 11. The plot
shows close correlation between the two
measurements. It is worth noting that this discussion
and this plot is based on the estimation of the relative
displacements between the fixed and floating targets.
Figure 11: Displacements of target compared to that of the
reference position transducer.
An error or the difference between the two
measurements does not exceed 0.4 mm as presented
in Figure 12. This error is shifted towards negative
values when the image measurement is less than the
displacement measured by the position transducer.
Hence, in this particular case, the displacement
measured from the image is underestimated.
Figure 12: Error of target’s center estimation with respect
to the reference position transducer.
It is worth noting that the size of each target was
about 0.7% of the 3648 pixels by 5472 pixels images
taken by this camera. A lens with variable focal
distance was used and for this test the focal distance
of the images was 32 mm.
The error of 0.4 mm is well below the accuracy of
the experimental setup discussed earlier. The
accuracy can be increased by correcting the images
for the lens distortion and other means. Some of the
possible ways of improving the accuracy are
discussed below.
6 RESULTS OF IMAGE
REDUCTIONS: CAMERA
PLACED FURTHER AWAY
To evaluate the approach, a number of tests were
conducted with the camera placed further away from
the targets. In the first case described above, the
camera was placed about 1 meter away from the
targets. As a result, the target occupies a relatively
large portion of the overall image. By placing the
camera further away, the targets occupy a much
smaller portion of the image. For the second case
considered here, the camera was placed about 5
meters away as presented in Figure 13.
A typical image taken by the camera at this
distance is presented in Figure 14. The focal distance
of the lens was set at 65 mm. As a result, each target
occupies about 0.06% of the 3648 pixels by 5472
pixels image’s area.
Figure 13: Camera placed at further way distance.
A smaller relative target size is very important in
experimental studies because then the larger surface
PHOTOPTICS 2021 - 9th International Conference on Photonics, Optics and Laser Technology
140
of a test specimen can be included in the same frame
for simultaneous visual monitoring.
Figure 14: Targets occupy very small portion of the image.
To avoid any possibility of relative movement of
the camera, the camera was placed on the strong floor
of the test laboratory and all triggering was done
remotely. The latter ensures that small but unexpected
movements of the camera resulting from pushing the
triggering button on top of the camera are completely
avoided.
The same experimental setup was utilized as the
in the previous case of the closely placed camera. The
direct correlation between the actual displacement of
the target and image was achieved by combining the
displacement output of the DAS into the same image
with targets as presented in Figure 15.
Figure 15: The reference displacement is combined into
each image.
A correlation between the pixels and engineering
units, mm in this case, were based on measurements
of the distance between the top and bottom targets in
both pixels and mm. A comparison between the
displacement measured by the reference position
transducer and the displacement measured from the
image is presented in Figure 16.
Figure 16: Comparison of the displacement measured from
images to that of the reference position transducer.
The error between the two measurements is
presented in Figure 17. As presented in the plot, the
error between the displacements measured from the
images and from the position transducer does not
exceed ±0.5 mm. It is worth reminding that this
accuracy was achieved from a distance of about 5m,
which is quite remarkable. The result is consistent
with the one obtained earlier when the camera was
placed much closer to the targets.
Figure 17: Error between the displacements measured from
images and that of the reference position transducer.
This accuracy was achieved based on the
following measures. First, the relative size of the
target was reduced to about 0.07% of the overall
image area. This reduces the effects of the lens
distortion. Second, the camera was triggered
remotely, so any contact with the camera was
excluded to avoid any undesired movements of the
camera by pushing on the triggering button. Third, the
focal distance of the lens was increased to reduce the
effect of the lens distortion. Fourth, a calibration
Measuring Centers of Special Targets in Digital Still Images and Movie Frames: Approach and Evaluation
141

factor converting pixels into engineering units was
based on a relatively larger distance, a distance
between the top and bottom targets. In this case, a
small error in the distance measurements will not
result in a large error in conversion of pixels into mm.
For future applications of the approach in
experimental studies, these measures are
recommended to be used so adequate accuracy of the
measurements can be achieved.
Some other variables affecting the measurements
will be studied in future investigations.
7 CONCLUSIONS
This paper utilizes special black and white patterns,
the so-called targets, to measure the relative
displacement between two points. The paper
introduces a new approach in measuring the location
of their centers that is based on best fitting the
transition zones to straight lines. An intersection of
these lines produces the location of the center with
sub-pixel accuracy. A special experimental rig was
designed and built to evaluate the approach and
compare the measurements to those obtained by a
conventional position transducer connected to a data
acquisition system. In the first part of the paper, the
accuracy of the position transducer and the
experimental setup is estimated. It is shown that the
accuracy of the setup is much greater than the
measurement expected from the digital images. Based
on this, it was used as a reference system to evaluate
the approach. In the second half of the paper, the
approach is evaluated based on monitoring two
targets. One of them is fixed and serves as a reference
point whereas another one is floating. The latter can
move along the linear bearing system axis which is
orthogonal to the axis of the camera lens. The
displacements of the floating target in respect to the
fixed target were measured by a position transducer
connected to a data acquisition system. The relative
displacement of the floating target is captured by the
digital camera and is based on the current location of
the floating and fixed targets. The paper shows
adequate accuracy of the approach and provides
recommendations on the ways of keeping it at a high
accuracy for practical applications in experimental
earthquake engineering.
ACKNOWLEDGEMENTS
Special thanks are due to Sensor Fusion and
Monitoring Technologies, LLC for providing access
to the PI-6008U data acquisition system which was
crucial for achieving the objectives of the paper.
Special thanks are due to Ms. Lola Takhirov of UC
Berkeley for editing the paper.
REFERENCES
Janßen, J., Medic, T., Kuhlmann H., and Holst, C. (2019).
Decreasing the Uncertainty of the Target Center
Estimation at Terrestrial Laser Scanning by Choosing
the Best Algorithm and by Improving the Target
Design. Remote Sensing. 11, 845;
doi:10.3390/rs11070845.
Lewis, J. P. (1995a). Fast Template Matching, Vision
Interface, p. 120-123,1995.
Lewis, J. P. (1995b). Fast Normalized Cross-Correlation,
Industrial Light & Magic.
http://citeseerx.ist.psu.edu/viewdoc/download?doi=10.
1.1.21.6062&rep=rep1&type=pdf.
MathWorks (2016). Matlab Version R2016b.
Mitutoyo (2016). https://www.mitutoyo.com/wp-
content/uploads/2016/09/E-section-Gage-Blocks.pdf
last retrieved on 11/23/20.
Novotechnik U. ., Inc. (2014).
https://www.novotechnik.com/pdfs/TRTRS.pdf last
retrieved on 11/23/20.
Kenneth A. Ogorzalek, Blake W. Dilsworth and Shakhzod
M. Takhirov (2017). ‘Experimental Program for
Historic and Contemporary Strengthening of Wood
Connections and Advanced Measurements by Laser
Scanning and Image Tracking’. PROHITECH2017, 3rd
International Conference on Protection of Historical
Constructions, 12-15 July 2017, Lisbon, Portugal.
Pacific Instruments, Inc. (2017).
http://catalog.pacificinstruments.com/Asset/6008U_En
closure%204-slot%2012V%20DC%20USB%
20Control%20&%20Data%20Interface.pdf last
retrieved on 11/23/20.
Takhirov, S. M. (2010). Laser Scanners in Structural
Assessment and FE modeling, 2010 Structures
Congress, Orlando, Florida, May 12-15, 2010.
PHOTOPTICS 2021 - 9th International Conference on Photonics, Optics and Laser Technology
142
