
Holographic Interferometry Real Time Imaging of Refraction Index
2D Distribution and Surface Deformations in Biomedicine
N. A. Davidenko
1
, X. Zheng
2
, I. I. Davidenko
1
, V. A. Pavlov
1
, N. G. Chuprina
1
, N. Kuranda
1
,
S. L. Studzinsky
1
, A. Pandya
2
, H. Mahdi
2
, A. Ladak
2
, C. Gergely
3
, F. Cuisinier
3
and A. Douplik
2,4
1
Taras Shevchenko National University, 64/13, Volodymyrska Street, City of Kyiv, 01601, Ukraine
2
Photonics Group, Department of Physics, Ryerson University, 350 Victoria Street, Toronto, M5B 2K3, Canada
3
Université de Montpellier, 34090, Montpellier, France
4
Keenan Research Centre of the LKS Knowledge Institute, St. Michael Hospital, Toronto, M5B 1W8, Canada
Keywords: Holography, Interferometry, Imaging, Holography Interferometry, Double Exposure Holography,
Holography Interferometry Imaging, Photodynamic Therapy, Dentistry, Biomedicine.
Abstract: Holographic Interferometry of 2D Imaging of Refraction Index and Surface Deformations were recorded in
in real time video: (1) monitoring of local refraction index perturbation at accuracy of 10
-4
in transmission
mode during heat and photochemical reactions with human hemoglobin using methylene blue, protoporphyrin
IX and rhodamine as the photosensitizers and (2) monitoring in reflectance mode of human tooth local
mechanical pressure at accuracy of 10
-7
m.
1 INTRODUCTION
In this study, we explored potentials of holography
interference imaging in transmission and reflectance
modes. The transmission mode was exploited to map
the refraction index modifications inside the phantom
while the reflectance mode was employed to monitor
the surface displacement map of the human tooth.
We explored photochemical and photothermal
reaction due to interaction of light and hemoglobin at
presence of a photosensitizer. Hemoglobin was
selected as a component of blood that is the main
absorber of light in visible range. Blood is the main
oxygen supplier of biotissues and oxygen is one of the
key components of photodynamic therapy (PDT).
Blood is also a main carrier of photosensitizers (PSs)
administrated systemically – orally or intravenously.
PDT is a non-surgical treatment modality based on
photochemical reactions and administrated as a part
of clinical routine in Europe, Japan, Australia, North
and South America (Wilson B.C., Patterson, M.S.,
2008). PDT is an extremely precise and controllable
light-based therapy targeting malignant lesions,
mostly focusing on those that develop across
significant areas (e.g., esophageal cancer) or
relatively shallow depth (GI tract, prostate), or
applied as an antimicrobial therapy (Hamblin MR,
Hasan T., 2004). Within the biophotonics market
sector, PDT demonstrates the highest growth, almost
40% annually (Biophotonics Market, Tematys,
2013). Pharmaceutical companies, such as Axcan,
Parmaceuticals Inc, Nigma, Glaxo-Welcome Inc,
DUSA, Photocure, Galdderma and others have
become important players in PDT.
The physical processes involved in the PDT
interaction of laser beam and material are divided into
three parts: (1) absorption of the light energy; (2)
transformation of this energy into chemical energy
and/or into heat; (3) ultimate chemical reaction and/or
phase transformation. In some cases, it is difficult to
distinct hyperthermal and photochemical reactions,
hence in the study at the current stage we consider the
both effects taking place.
PDT is a photochemical reaction involving (1)
light, (2) photosensitive molecules (photosensitizer)
absorbing light and (3) ambient molecular oxygen
(O
2
) generating reactive oxygen species (ROS),
which in turn destroy biotissue cells or extracellular
matrix (Dougherty, T.J. et al, 1998). These include
the Type I (sensitizer-substrate) and Type II
(sensitizer-oxygen) reactions. Type II photochemical
reactions (Fig. 1) represent the transfer of light energy
to the molecular oxygen conversion into singlet
oxygen (
1
O
2
). In this study, we presume only the
216
Davidenko, N., Zheng, X., Davidenko, I., Pavlov, V., Chuprina, N., Kuranda, N., Studzinsky, S., Pandya, A., Mahdi, H., Ladak, A., Gergely, C., Cuisinier, F. and Douplik, A.
Holographic Interferometry Real Time Imaging of Refraction Index 2D Distribution and Surface Deformations in Biomedicine.
DOI: 10.5220/0010390802160220
In Proceedings of the 14th International Joint Conference on Biomedical Engineering Systems and Technologies (BIOSTEC 2021) - Volume 2: BIOIMAGING, pages 216-220
ISBN: 978-989-758-490-9
Copyright
c
2021 by SCITEPRESS – Science and Technology Publications, Lda. All rights reserved
second type of oxygen dependent photochemical
reaction which comes with release of
1
O
2
taking into
account the photosensitizer used in the study –
Methylene Blue. Methylene Blue is an FDA-
approved clinical dye, which also can be used as a
photosensitizer (Foster TH et al., 2010). The II type
of PDT reaction leads to both depletion of dissolved
molecular oxygen and eventually to conversion of
oxygenated to reduced form of hemoglobin (Douplik
A., Stratonnikov A., Loschenov V et al., 2011), and
to photobleaching or photodegradation of the
photosensitizers. An example of such conversions
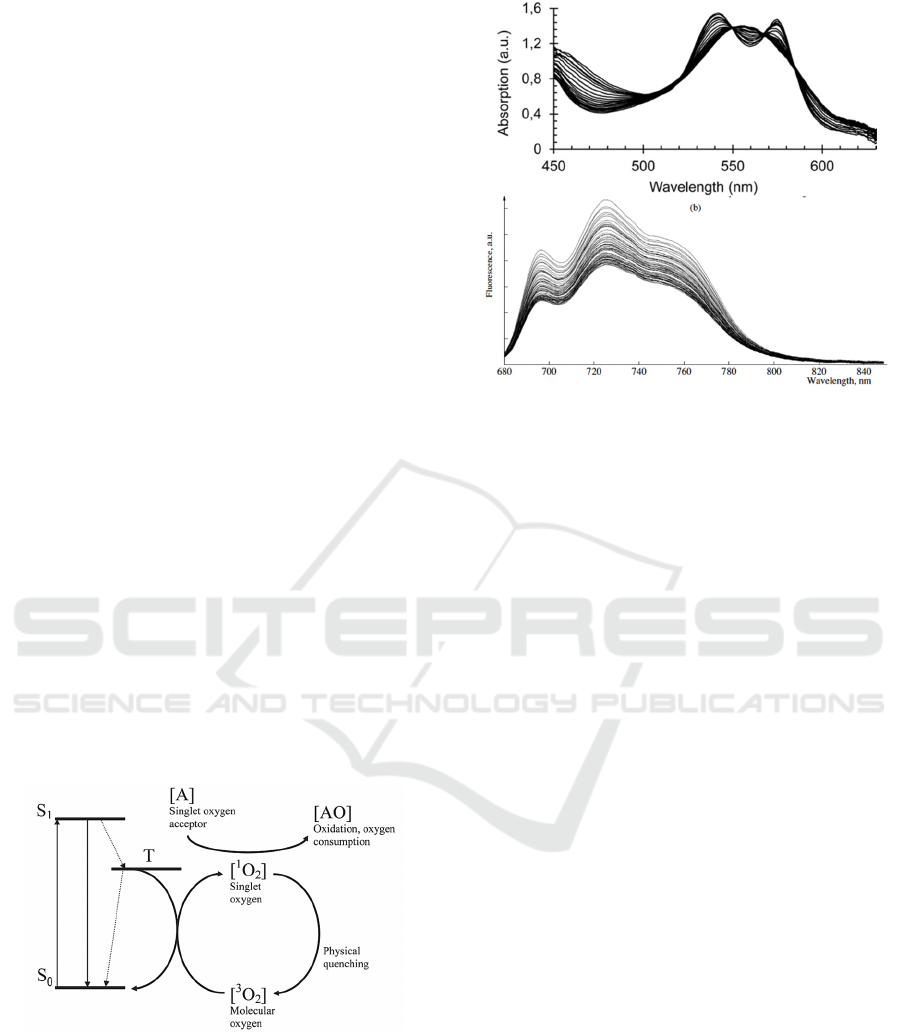
from the previous studies is demonstrated in Fig. 2
a,b. The transformation of hemoglobin from the
oxygenated to deoxygenated form is clearly observed,
confirming oxygen consumption during PDT (Fig.
2a). The photosensitizer photobleaching during PDT
without a substantial change in the spectral line shape
is demonstrated in Fig. 2b. Absorption and
fluorescence spectroscopy and imaging have been
successfully applied in reflectance mode for PDT
monitoring (Dougherty et al., 1998). However,
currently there are no monitoring techniques that can
be applied for PDT in optically transparent tissues
and organs such as eye. This study is an attempt to
develop a PDT monitoring technology capable to
register reactions in optically transparent tissues
based on local alterations of the refractive index,
exploiting the model reaction with human
hemoglobin, which was previously successfully
studies and described by absorption and fluorescence
methods.
Figure 1: Jablonski diagram of the processes during second
type of PDT reaction (via singlet oxygen generation
mechanism) (Modified from Douplik A., Stratonnikov A.,
Loschenov V et al, 2011).
Holographic interferometry monitoring of
hyperthermal and photochemical reactions with
human hemoglobin have been conducted under
control of the sample absorption spectra.
Figure 2: a)The absorption spectra variation in blood
sample incubated with Methylene Blue during laser
irradiation. The initial two-hump spectrum of oxygenated
hemoglobin (HbO
2
) transformed into a single peak
spectrum of reduced hemoglobin (RHb) as a result of PDT
reaction. b)Fluorescence spectra from a blood sample
incubated with Phtalocyanine Aluminum (Photosence) as
the photosensitizer at a concentration of 20 μM. Laser
fluence rate is 25 mW/cm
2
at 670 nm. The time interval
between spectra is 20 s. (Modified from Douplik A.,
Stratonnikov A., Loschenov V et al, 2003, 2011).
In dentistry, there is a demand to assess how the
tooth undergoes by mechanical pressure in case of
counter implants. Identification of particular points of
high mechanical pressure and pressure gradients is
required.
2 MATERIALS AND METHODS
2.1
Materials
Lyophilised human hemoglobin powder (H7379
Sigma-Aldrich, USA) was used for this study
component, replacing red blood cells, as it is readily
available and easily handled. Due to the process of
lyophilisation approximately 80-85% of the
hemoglobin is methemoglobin (MetHb). Sodium
dithionite (S310-100 Fisher Scientific) was added to
MetHb in phosphate buffered solution (PBS)
(Multicell sterile, Wisent inc., Canada) to form
reduced haemoglobin (HbR) which was then
oxygenated to form oxyhaemoglobin (HbO
2
)
according to the procedure described in our previous
paper (Zhernovaya, Sidoruk, Tuchin, Douplik, 2011)
providing ultimate concentration 0.5 g/L.
Holographic Interferometry Real Time Imaging of Refraction Index 2D Distribution and Surface Deformations in Biomedicine
217
Photosensitizers Protoporphyrin IX (PPIX, Sigma-
Aldrich, USA) and Rhodamine (Sigma-Aldrich,
USA) were added to the solution creating
concentrations of 0.05g/L and 0.02 g/L accordingly.
Half of the samples with PPIX were created in liquid
form, and the other half was prepared on 300-Bloom
gelatin derived from acid-cured porcine skin (G2500,
Sigma-Aldrich Corp., St. Louis, MO) forming
polymerized samples. The samples with Rhodamine
were created only in liquid form. The control samples
included: (1) PBS, (2) PBS/10%-gelatin, (3)
PBS/0.5g/L Hb, (4) PBS/0.05g/L PPIX, (5)
PBS/10%-gelatin/0.5 g/L Hb, (6) PBS/10%-
gelatin/0.05g/L PPIX, (7) - PBS/0.02g/L Rhodamine
3 samples were used in each experimental group
including both the control and PPIX experiments. For
Rhodamine control and experiment were used 2
samples per group.
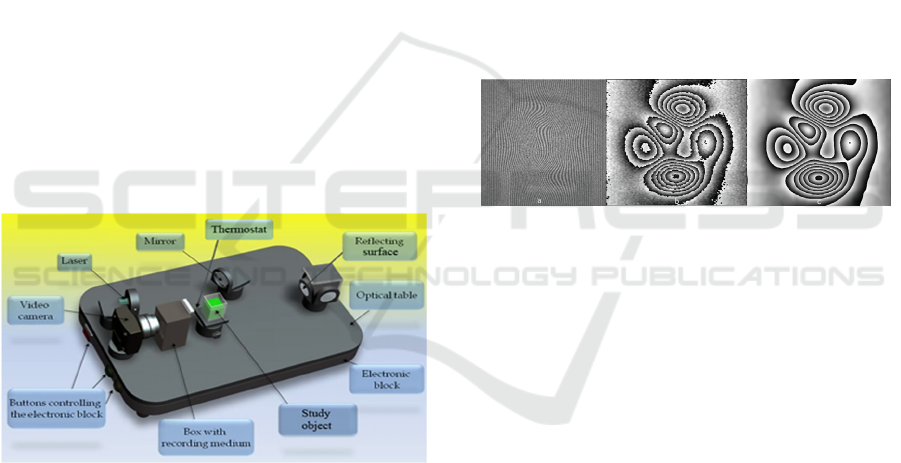
2.2 Experimental Setup
The absorption spectra were measured on Shimadzu
UV-3600 spectrophotometer (Japan). The
Holography Interference setup is depicted in Fig. 3
and described in (Derzhypolska L., Davidenko N.,
2006).
Figure 3:
Double exposure real time Holography
Interferometry setup.
A black-and-white web camera was used for
experiment with PPIX and for the Rhodamine
experiment we used a RGB camera (Basler ac-
A2000-165uc, Basler AG, Germany). Red laser diode
was employed for holography (660 nm, 4mW,
INTEGRAF LLC, USA) and green laser diode (532
nm, 50 mW, Thorlabs, USA) used for irradiation
providing the irradiance of 62 mW/cm
2
. A long pass
interference filter (Comar Optics, UK) was exploited
to facilitate both the irradiation of the sample and
holography interference imaging acquisition.
The monitoring of PDT reactions was carried out
in transmission mode, while monitoring of the surface
displacement map of the human tooth was conducted
in reflectance mode.
2.3 Data Processing
Fringe images was processed with carrier
frequencies. Fringe patterns with carrier frequencies
are processed using the Fourier transform method
discussed earlier in introduction. A Matlab function
that includes an automatic and a manual
implementation of the method was obtained from
Matlab File Exchange (mathworks.com/
fileexchange/53421). The user of the GUI is given the
option of manually selecting the side peak in the
Fourier spectrum representing c(x,y), or an automatic
option can be used but the user has to specify the
width of the side peak in the Fourier spectrum.
Increasing the width avoids negating phase
information but allows for more noise to be included.
Figure 4: (a) noisy fringe pattern; (b) noisy extracted phase
using the Fourier transform method; (c) denoised phase
using WFT.
In addition, the user is given an option to use a
windowed Fourier transform after demodulation in
order to denoise the obtained phase before
unwrapping at the cost of significantly increasing
processing time. The application of a windowed
Fourier transform (WFT) for fringe analysis was first
proposed in (Qian Kemao, 2004). The combination of
the Fourier transform method and the WFT was tested
and proven to be successful. Figure 4 shows the
effectiveness of using the WFT method in denoising
phase.
3 RESULTS AND CONCLUSIONS
The holography interference images for control
experiments are depicted in Fig. 5 (a snapshot from
the video clip at 60th second). A partial formation of
the first interference ring can be observed only in case
of PBS/10%-gelatin/0.5 g/L Hb sample (Fig. 5 c),
which apparently was caused by the hyperthermal
effect, while the control samples with PBS/gelatin
BIOIMAGING 2021 - 8th International Conference on Bioimaging
218
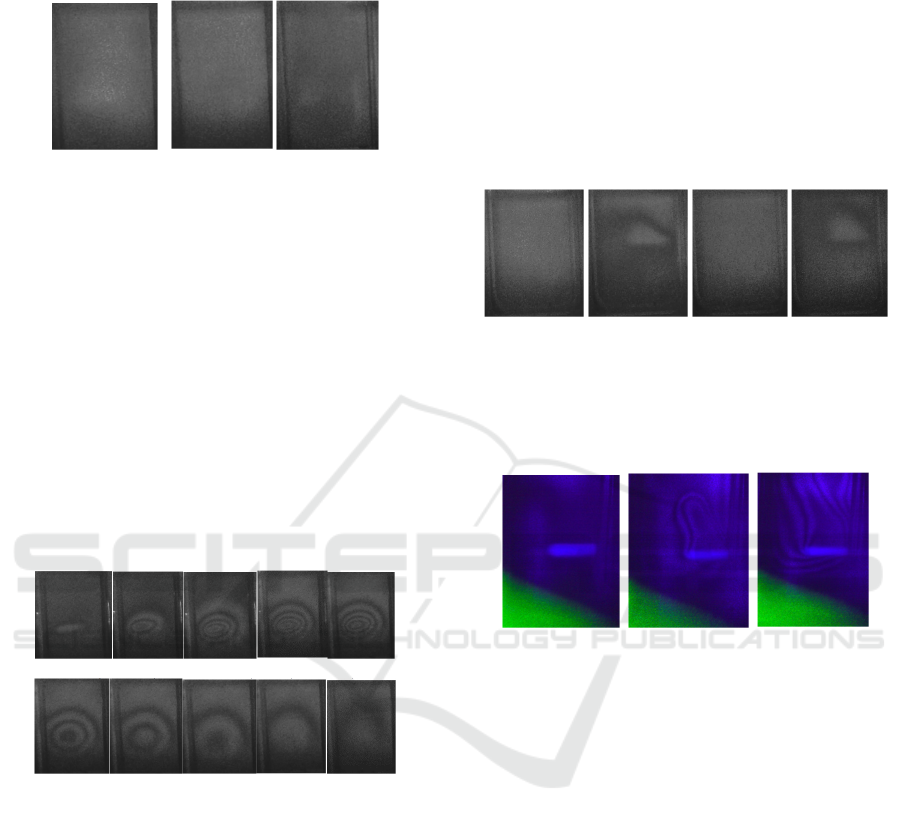
and Methylene Blue/gelatin (Fig. 5a, b) did not
manifest any registerable photochemical reaction.
a) b) c)
Figure 5: Holography interference images for control
experiment (60
th
second snapshot): a) gelatin only; b)
gelatin plus Methylene Blue; c) gelatin plus Hemoglobin.
The contours of the cuvette walls are clearly seen.
The holography interference images for
Methylene Blue experiment are shown in Fig. 6
demonstrating a significant reaction forming ca. 5
interference rings, which approximately matches a
modification of the refraction index by 5 folds.
Preliminary we could conclude that contributions
of photochemical reactions are considerably higher
than a pure heating effect. Once the green laser
irradiation was switched off, in the experimental
samples the refraction index returned back to its
original values within 60 seconds.
a) b) c) d) e)
f) g) h) i) j)
Figure 6: Holography interference snapshot from video clip
images for Methylene Blue experiment arranged in seconds
of irradiation: a) 2 s; b) 10 s, c) 30 s, d) 59 s, e) 60s (laser is
switched off), f) 65 s (5 seconds later after laser switched
off), g) 70 s, h) 80 s, i) 90 s, k) 120 s. The long pass filter
was set in front of the camera to let a minor leak of the
irradiation green light to expose onto the side walls of the
cuvette for monitoring the irradiation condition consistency
(a-d). The laser was switched off in the frames e-j. The
white circle in the center of the interference pattern of the
first frame (a) is the irradiation spot location (not scaled, the
diameter of the spot was 1.5 mm).
As a result of the work, the heat and photochemically
induced reactions with human hemoglobin have been
successfully monitored by holography interference
method towards development of PDT monitoring
technology in transparent tissues.
The holography interference images for PPIX
experiment are depicted in Fig. 7. A formation of the
interference ring can be observed. The holography
interference images for Rhodamine C experiment are
depicted in Fig. 8. The control samples with PBS,
gelatin and PPIX did not manifest any photochemical
reaction. The control samples with HbO2 only have
shown some reactions but much less than that of with
PPIX plus HbO2 experiments even after 60 seconds
of irradiation.
a) b) c) d)
Figure 7: Holography interference images for PPIX
experiment: a) liquid sample before irradiation; b) liquid
sample, beginning of the reaction (25th second); c) gelatin
sample before laser irradiation; d) gelatin sample,
beginning of the reaction (12th second).
a) b) c)
Figure 8: Holography interference images for Rhodamine
C experiment: a) liquid sample before irradiation; b) liquid
sample, beginning of the reaction (2nd second), c) liquid
sample, development of the reaction (4th second). The long
pass filter was set in front of the camera to let a minor leak
of the irradiation green light to expose onto the bottom left
corner of the frame for monitoring the irradiation condition
consistency. The light rod shape in the center of the frame
is the irradiation spot.
The reaction without photosensitizer was interpreted
as a pure heating effect. Once the green laser
irradiation was off, in the gelatin samples the RHb
have been completely oxygenated back during 1-2
minutes. Such a fast resurrection of RHb to HbO2 has
not been observed in liquid samples.
Holography interference images in reflectance
mode for tooth before and after applying mechanical
pressure are shown in Fig. 9 a,b. The mechanical
pressure was applied from the top. Estimated
displacement of the surface was ca. 80 nm.
Holographic Interferometry Real Time Imaging of Refraction Index 2D Distribution and Surface Deformations in Biomedicine
219

a) b)
Figure 9: Holography interference images for tooth before
applying mechanical pressure (a) and after (b). The
mechanical pressure was applied from the top. Estimated
displacement of the surface was ca. 80 nm.
The heat, photochemically induced reactions with
human hemoglobin and surface deformation due to
mechanical pressure have been successfully
monitored by holography interference method
towards development of monitoring technology in
both transparent and opaque tissues for biomedicine.
ACKNOWLEDGEMENTS
This study was supported by the Natural Sciences and
Engineering Research Council of Canada (NSERC),
Personal Discovery Grant (Douplik A), Ryerson
University Health Research Grant. Aman Ladak was
supported by NSERC Engage grant
.
REFERENCES
Wilson B.C., Patterson, M.S. The physics, biophysics and
technology of photodynamic therapy. Phys. Med. Biol.,
53, R61–R109, (2008).
Hamblin MR, Hasan T. Photodynamic therapy: A new
antimicrobial approach to infectious diseases?
Photochem Photobiol Sci. 4;3: 436–50, (2004)
Biophotonics Market Technologies and Market Analysis,
Tematys, Cortesy of EPIC, (2013).
Dougherty, T. J., Gomer, C.J., Henderson, B.W., Jori, G.,
Kessel, D., Korbelik, M., Moan, J., Peng, Q.
Photodynamic therapy. J. Nutl. Cancer Znst., 90, 889-
905, (1998).
Baran T. M., Giesselman B. R., Hu R, Biel MA, Foster
TH."Factors influencing tumor response to
photodynamic therapy sensitized by intratumor
administration of methylene blue." Lasers in surgery &
medicine”, 42(8):728-35 (2010)
Douplik A., Stratonnikov A., Zhernovaya O. and
Loschenov V. “Modifications of Blood Optical
Properties during Photodynamic Reactions in Vitro and
in Vivo”, Chapter 20 in “Advanced optical cytometry:
methods and disease diagnoses”, Edited by V.V.
Tuchin, Wiley-VCH, (2011)
Stratonnikov A., Douplik A., Loschenov V., “Oxygen
Consumption and Photobleaching in Whole Blood
Incubated with Photosensitizer Induced by Laser
Irradiation,” Laser Physics 13 (1), 1-21, (2003)
Zhernovaya O., Sidoruk O., Tuchin V., Douplik A., “The
refractive index of human hemoglobin in the visible
range”, Phys Med Biol. 56(13): 4013-21 (2011)
Derzhypolska L., Davidenko N., Medved N. and Pryadko
L. "Holographic projection interferometer with
photorefractive recording media", Proc. SPIE 6023,
Tenth International Conf. on Nonlinear Optics of
Liquid and Photorefractive Crystals, 60230O
(December 06, 2006); doi:10.1117/12.648209 (2006)
Matlab function for extraction of phase from interferogram.
Retrieved August 16, 2017, from https://www.mathw
orks.com/matlabcentral/fileexchange/53421-matlab-
function-for-extraction-of-phase-from-interferogram
Kemao, Q., Windowed fourier transform for fringe pattern
analysis. Applied Optics, 43(13), 2695-2702. (2004).
BIOIMAGING 2021 - 8th International Conference on Bioimaging
220
