
Multi-objective Classification and Feature Selection of Covid-19 Proteins
Sequences using NSGA-II and MAP-Elites
Vijay Sambhe
1 a
, Shanmukha Rajesh
1 b
, Enrique Naredo
1,2 c
, Douglas Mota Dias
1,2,3 d
,
Meghana Kshirsagar
1,2 e
and Conor Ryan
1,2 f
1
University of Limerick, Limerick, Ireland
2
Lero – Science Foundation Ireland Research Centre for Software, Ireland
3
UERJ – Rio de Janeiro State University, Brazil
Keywords:
DNA Sequences, MAP-Elites, k-mer, NSGA-II, Feature Selection, Genetic Algorithms.
Abstract:
The advent of the Covid-19 pandemic has resulted in a global crisis making the health systems vulnerable,
challenging the research community to find novel approaches to facilitate early detection of infections. This
open-up a window of opportunity to exploit machine learning and artificial intelligence techniques to address
some of the issues related to this disease. In this work, we address the classification of ten SARS-CoV-2
protein sequences related to Covid-19 using k-mer frequency as features and considering two objectives; clas-
sification performance and feature selection. The first set of experiments considered the objectives one at the
time, four techniques were used for the feature selection and twelve well known machine learning methods,
where three are neural network based for the classification. The second set of experiments considered a multi-
objective approach where we tested a well known multi-objective approach Non-dominated Sorting Genetic
Algorithm II (NSGA-II), and the Multi-dimensional Archive of Phenotypic Elites (MAP-Elites), which con-
siders quality+diversity containers to guide the search through elite solutions. The experimental results shows
that ResNet and PCA is the best combination using single objectives. Whereas, for the mulit-classification,
NSGA-II outperforms ME with two out of three classifiers, while ME gets competitive results bringing more
diverse set of solutions.
1 INTRODUCTION
Covid-19 has become a major concern for the whole
world. Currently, there is a heavy workload on patho-
logical laboratories and many cases tested there have
been instances of false-negative test results (Wets-
man, 2020; Abc7news, 2020). On the other hand,
even with false-positive test results, a patient can face
the wrong medication.
In the current pandemic situation of Covid-19,
health care systems are experiencing extremely high
demand for testing of Corona infections. At the same
time, health care systems struggle not to ignore the
testing of other traditional infections.
The biotechnology field can benefit immensely
from computer science methods such as machine
a
https://orcid.org/0000-0003-3057-8172
b
https://orcid.org/0000-0002-2477-3089
c
https://orcid.org/0000-0001-9818-911X
d
https://orcid.org/0000-0002-1783-6352
e
https://orcid.org/0000-0002-8182-2465
f
https://orcid.org/0000-0002-7002-5815
learning, deep neural networks, evolutionary comput-
ing, and data mining. In a very recent development, a
team at MIT (Massachusetts Institute of Technology)
Artificial Intelligence agency took a novel approach
to predicting peptides to provide a high population
of coverage for a Covid-19 spike protein-based vac-
cine which is in multiple clinical trials (Rachel, 2020;
Hamley, 2020).
Artificial intelligence techniques can aid in diag-
nostics to treatments offering support to healthcare
(Bohr and Memarzadeh, 2020). One method of in-
fection detection is offered through the pattern recog-
nition of genetic sequences of the viral and bacterial
infectious organisms.
In this research work, we address the problem of
feature reduction and multi-classification of protein
sequences of “Severe acute respiratory syndrome-
related coronavirus”, commonly named as SARS-
CoV-2 (Gorbalenya et al., 2020). We conducted pri-
marily two sets of experiments: single and multi-
objective optimization approaches. In the single-
objective approach, we used four techniques for the
feature selection, and from their results, we per-
Sambhe, V., Rajesh, S., Naredo, E., Dias, D., Kshirsagar, M. and Ryan, C.
Multi-objective Classification and Feature Selection of Covid-19 Proteins Sequences using NSGA-II and MAP-Elites.
DOI: 10.5220/0010388512411248
In Proceedings of the 13th International Conference on Agents and Artificial Intelligence (ICAART 2021) - Volume 2, pages 1241-1248
ISBN: 978-989-758-484-8
Copyright
c
2021 by SCITEPRESS – Science and Technology Publications, Lda. All rights reserved
1241

formed the classification using 12 methods, where 9
are well-known traditional machine learning methods
and the last three are neural network-based methods.
In the multi-objective optimization, we addressed
both the feature selection and the classification prob-
lem at the same time, using Non-dominated Sorting
Genetic Algorithm II (NSGA-II) (Deb et al., 2002),
and Map-Elites (ME) (Mouret and Clune, 2015) ap-
plying just three of the best classifiers found in the
previous process. On one hand, NSGA-II is a well
known multi-objective evolutionary algorithm, where
the standard implementation rewards solutions closer
to the target. On the other hand, ME is a state-of-the-
art method that guides the search by considering both
quality and diversity.
In the literature, we can find several works us-
ing conventional methods to address deoxyribonu-
cleic acid (DNA) sequences, to our best of our knowl-
edge, this is the first work to apply ME on this prob-
lem domain.
The experimental results show that the protein se-
quences classification can be addressed using a multi-
objective approach obtaining a set of solutions con-
sidering both objectives; classification performance
and feature selection in the Pareto front. On the other
hand, ME reaches similar classification performance
and bringing more diverse solutions, and deserves a
deeper study to apply this approach to solve similar
problem domains.
In this paper, Section 2 describes the related work,
Information on SARS-CoV-2 sequences, NSGA-II,
and Map-Elites Algorithm. Section 3 is dedicated to
the experimental setup, then Section 4 presents and
discusses the experimental results. Finally, Section 5
gives the conclusions and future work.
2 BACKGROUND
The Coronavirus disease (Covid-19) is mainly trans-
mitted to human beings through droplets, coughs,
sneezes, or exhales from infected persons. The
SARS-CoV-2 is composed of various proteins and the
tissue samples collected from a person infected with
the Covid-19 virus contain the samples of these same
proteins.
In its replicating mechanism in a human host cell,
these various structural and non-structural proteins
are produced again and composed together to form
a whole new viral entity. The study of virology of
the Covid-19 virus gives a better understanding of the
structure of the virus and the proteins it contains.
In biological terms, DNA computing is a compli-
cated task that relies heavily on biochemical reactions
of DNA molecules leading it many times to imper-
fect computations. To make this molecular compu-
tation reliable, more efforts are focused on designing
a better DNA sequencing methods. Authors in (Kim
et al., 2002) formulated the DNA sequence design by
using a multi-objective evolutionary algorithm (EA)
constrained in nature into the DNA sequence design
system.
In another study, (Randhawa et al., 2020) used
a supervised machine learning-based approach for a
real-time prediction of Covid19 virus for its taxon-
omy predictions providing the hypothesis of the bat
origin theory. They used several traditional machine
learning techniques to tackle that task; Linear Dis-
criminant, Linear SVM, Quadratic SVM, Fine KNN,
Subspace Discriminant, Subspace KNN, and Accu-
racy.
More recently in (Alkady et al., 2020), used hu-
man protein sequences of COVID-19 to predict the
country origin of the sample and considered three
stages including data preprocessing, data labeling,
and classification. In the classification stage, the
authors applied several machine learning methods,
such as Linear Regression (LR), K-Nearest Neighbor
(KNN), and Support Vector Machine (SVM) classi-
fiers.
The Covid-19 disease virus has structural and
non-structural components made up of proteins. It
is already well known that coronavirus disease-2019
(COVID-19) is caused by the SARS-CoV-2 virus
(Romano et al., 2020).
The SARS-CoV-2 virus has one of the largest
known ribonucleic acid (RNA) genomes. A com-
mon measurement used to describe the length of a
DNA or RNA molecule is kb, which stands for ’kilo-
base pairs’, where a base pair corresponds to approx-
imately 3.4
˚
A (340 pm) of length along the strand,
and to roughly 618 or 643 daltons for DNA and RNA
respectively(Alberts et al., 2018). This virus is ap-
proximately 30 kb in length and is a positive sense
single-stranded genomic RNA (Khailany et al., 2020;
Malik, 2020).
Some viruses encode RNA genome to store their
genetic information (Cm.jefferson.edu, ). As the
SARS-CoV-2 virus infects humans, the replicating
mechanism of the virus involves the replication of
the same proteins and later forming of the whole vi-
ral entity. Our aim is that the correct classification of
the viral protein sequences could help towards the di-
agnostic assessment and detection of vaccination ap-
proaches.
A genome sequence is described in terms of four
basic nucleotides; A, T, G, and C, which denote chem-
ical bases adenine, thymine, guanine, and cytosine
ICAART 2021 - 13th International Conference on Agents and Artificial Intelligence
1242

respectively. An amino acid is specified by a triplet
of these bases and a protein is composed of one
or more chains of amino acids (Cm.jefferson.edu, ;
Genome.gov, ). Furthermore, the protein sequences
encode regions in terms of the bases, in this work we
use this specific information to address the classifica-
tion of SARS-CoV-2 virus samples.
The term of k-mer is primarily used within the
context of computational genomics and sequence
analysis, in which k-mers are composed of nu-
cleotides (i.e. A, T, G, and C), and they are subse-
quences of length k contained within a biological se-
quence (Compeau et al., 2011).
Given a sequence of length k, the term k-
mer refers to all possible combinations of the sub-
sequences in that sequence. More generally, a se-
quence of length m will have m − k + 1 k-mers and n
k
total possible k-mers, where n is the number of possi-
ble monomers, four in the case of DNA corresponding
to the base nucleotides.
The use of k-mer is widely used in many of the
applications related to DNA sequences; for instance,
a study from (Solis-Reyes et al., 2018) used k-mer
based and deep neural networks for sub-typing of
HIV-1 genome having higher accuracy against a com-
plex dataset.
In a research paper by (Kaehler, 2017), the au-
thors used a metagenomic data with DNA sequences
from bacterial communities. The raw sequence data
was transformed using k-mers and a numeric summa-
rization vector. To address the high dimensionality,
some feature selection methods were used to reduce
the number of dimensions.
On the other hand, there is some evidence of using
evolutionary algorithms to address DNA sequences.
For instance, in (Chen et al., 1999) authors used ge-
netic algorithms to manipulate bit strings using point-
wise mutation and crossover.
Furthermore, a study by (Quinonez et al., 2019)
addressed the problem of feature selection using the
Map-Elites algorithm in a classification problem us-
ing Bayes Classifier becoming a good choice to use
in this research work.
NSGA-II resemble the process of natural selection
by selecting the fittest individuals and reproduction
in order to produce offspring of the next generation
(Davis, 1991). In general, we can define an individual
composed by a tuple of the form I = (P, G,S), where
P stands for the phenotype, G for the genotype, and S
for the score.
The observable properties of the individual I are
known as the phenotype P, i.e. protein sequences. For
a classification problem, the features selected from
the protein sequences are used to make a decision to
what class label they belong, then that solution is eval-
uated trough a function, which will we refer as to the
fitness function because it assigns a quality score to
P, named as fitness score S.
In the evolutionary process individuals I with
higher S have more chances to recombine their G with
other individuals or just to mutate some position in G,
creating in this way increasingly better solutions until
ideally an optimal or near-optimal one appears.
The Multi-dimensional Archive of Phenotypic
Elites also known as Map-Elites (ME) (Mouret and
Clune, 2015) is an algorithm that illuminates the con-
tainers of quality and diversity where the solutions are
stored. ME creates a map of high-performing solu-
tions (elites) searching the higher-dimensional feature
space and mapping them in a low dimensional feature
space defined by the user and keeping a diverse set of
high-performing solutions.
Implementing ME requires defining the feature
space of interest, for instance, by classification perfor-
mance and feature selection. These dimensions can
be discretized and their granularity is manually or au-
tomatically specified. ME search for the highest per-
forming solution for each cell in the already defined
search space.
The overall process of ME is similar to any
population-based algorithm, starting with a random
population. ME concurrently map the genotypical
and phenotypical storing the information into contain-
ers of the same size, this way the mapping process is
easily performed.
The general process starts choosing a cell or set
of cells in the container to perform genetic operations
and create new solutions that are placed in the con-
tainer if there is not any other solution inside. Best
solutions replace the old solutions and the cell is il-
luminated with the new quality score. These elite so-
lutions are replaced iteratively by new and better so-
lutions, maintaining the diversity of solutions which
helps to avoid getting into regions of local optima.
3 EXPERIMENTAL SETUP
In this section, we give a detailed explanation of the
whole process to address the multi-classification of
Covid protein sequences.
The samples from SARS-CoV-2 were manually
collected from the viral protein dataset was down-
loaded from the virus repositories from (NCBI, 2020)
and the search parameters were: (i) Virus: SARS-
CoV-2, (ii) Texid: 2697049, (iii) Host: Homo (hu-
mans), (iv) Taxid:9605, (v) Data type: Protein coding
region, (vi) File format: FASTA.
Multi-objective Classification and Feature Selection of Covid-19 Proteins Sequences using NSGA-II and MAP-Elites
1243

In this research, we worked with 10 classes of pro-
teins from a downloaded dataset with 78,555 samples
and the length of the protein sequences ranged from
6 to 3,822 nucleotides. In this work, we selected 10
protein sequences from the coding region; Envelope
protein, Membrane glycoprotein, Nucleocapsid phos-
phoprotein, orf10, orf3, orf6, orf7a, orf7b, orf8, and
Spike glycoprotein.
At the time of this research, there had been mini-
mal mutation with the SARS-CoV-2 virus in humans,
hence the samples from across the globe were quite
identical. The raw dataset contained 72,605 dupli-
cated samples from a total of 78,555, and after re-
moval, we got only 5,950 unique samples.
The next step in pre-processing the dataset was to
balance the classes. Three protein classes had less
than 300 samples and the other three more than 700
samples. We used a resampling method to increase
the lower represented classes and a downsampling
method for the over-represented classes. The thresh-
old to balance the entire dataset was 500, where just
the class envelope contains 9 more samples, result-
ing in a total of 5,009 samples in the pre-processed
dataset.
Following the conventional approach used in
bioinformatics, we used sub-sequences of length k
contained within the dataset samples (Kaehler, 2017;
Randhawa et al., 2020).
In this work, we empirically selected k = 6 to
use all the sub-sequences of length 6. The number
of k-mers contained in the samples is variable, and
a typical sample could contain more than 12,000 k-
mers. The information used from the k-mers is the
frequency found in each sample.
To avoid any bias from the k-mers frequency, we
used the normalization technique called Term Fre-
quency Inverse Document Frequency (TF-IDF) ap-
plied to each k-mer. TF-IDF is a well-known tech-
nique in Natural Language Processing (NLP), useful
for scoring words (Prawira, 2020). Here, TF-IDF is
used to evaluate how relevant a k-mer is to a collec-
tion of protein sub-sequences in each sample. This
is done by multiplying the frequency a k-mer appears
in a sub-sequence and the inverse sub-sequence fre-
quency of the k-mer across a set of sub-sequences.
The protein classification problem then is ad-
dressed using the resulting frequency vector as a fea-
ture vector with a domain in [0, 1] to relate each sam-
ple to one of the ten protein classes. In the following
sections, we explain two different sets of experiments
to address the classification and feature selection. The
first set of experiments addresses each task separately
as a single-objective optimization problem. On the
other hand, the second set of experiments addresses
both at the same time as a multi-objective optimiza-
tion problem.
In this set of experiments, the classification of
SARS-CoV-2 protein sequences is addressed as a
single-objective optimization problem. The goal is to
test twelve well known classifier methods with four
feature selection strategies each and using a stratified
5-fold cross-validation. From now on we refer to the
features as the vector of k-mer frequency from each
sample, where in some cases they can contain more
than 12,000 features.
The feature selection strategies used are: (i) PCA,
(ii) 75th-Perc, (iii) α-Best, and (iv) β-Best. The first
strategy for feature selection used is the principal
component analysis (PCA). We extracted 9 principal
components so that it covered 95% variance of the
data. The second strategy used is selecting the fea-
tures according to a percentile of the highest scores,
where we selected the 75th percentile (75th-Perc) us-
ing the Chi-squared distribution. For this technique,
the number of features obtained was 91.
The third and fourth strategies select the best
features from two measures; ANOVA and the Chi-
squared distribution. Using the third one, we selected
α as 1,000 highest scores (α-Best), using the analysis
of variance (ANOVA) and the F-test to verify the vari-
ance between the means of α features significantly
different, for this technique. Using the fourth one, we
selected β as 1,000 highest scores (β-Best), using the
Chi-squared distribution for this technique.
Table 1 shows the list of twelve classifier methods
used in our experiments, where the first nine are well
known traditional machine learning methods and the
last three methods are neural network-based.
For the CNN method, we used 1D convolution
layer (Conv1D), rectified linear unit (activation layer),
Max Pooling 1D, and finally a fully connected layer,
using 50 epochs for training with the loss function
‘categorical crossentropy’ and the optimizer ‘adam’.
To apply Conv1D, we had to transform the input data
by expanding the shape of the array by inserting a new
axis.
Whereas, the ResNet, the residual block con-
sists of a stacking of convolutional (Conv1D), batch
normalization, rectified linear (ReLU) activation,
Conv1D, and again batch normalization layers.
For the multi-objective optimization, we used two
methods: (i) NSGA-II, and (ii) MAP-Elites. From
the first set of experiments, we select three of the ma-
chine learning methods as classifiers: MNB, SGD,
and RF. The dataset for these experiments was di-
vided into 75% for training (3,756) and 25% for test-
ing (1,253). The features used in this set of experi-
ments are the same used for the single-objective ex-
ICAART 2021 - 13th International Conference on Agents and Artificial Intelligence
1244

Table 1: List of the methods used as classifiers in the ex-
periments. Short stands for the abbreviation for the method
used.
Short Description
MNB Naive Bayes for multinomial models
SGD Stochastic Gradient Descent
RF Random Forest
KNN k-nearest neighbors
GNB Gaussian Naive Bayes
LR Logistic Regression classifier
LSV Linear Support Vector classifier
SVM-p SVM with polynomial kernel function
SVM-r SVM with Radial Basis Functions
NN Neural Network
CNN Convolutional Neural Network
ResNet Residual Neural Network
periments. We design the first experiment to compare
NSGA-II vs MAP-Elites using 200 features randomly
chosen, then we performed a second experiment to
analyse the performance of MAP-Elites considering
the entire features set (>12,000).
Table 2: Parameters used to run NSGA-II and MAP-Elites.
Parameter Value
Runs 30
Generations 100
Population 100
Selection Tournament, (size 3)
Crossover One point, 0.9
Mutation 0.1
Table 2 shows the main parameters used to run exper-
iments with NSGA-II and MAP-Elites. A binary rep-
resentation was used on the comparison from both al-
gorithms to perform the feature selection. In the sec-
ond ME experiment, we used a discrete representation
composed of integers in the range of the total number
of dimensions of the dataset. We extended this exper-
iment further by changing two parameters with popu-
lation size as 1,000 and generations as 1,000. But we
used only the MNB classifier.
The function used to reward the best classifiers on
all the experiments is based on the accuracy perfor-
mance, given by
Accuracy =
T P + T N
T P + T N + FP + FN
(1)
In all the experiments we used open-source tools,
such as Python3, scikit-learn, NumPy, SciPy, and
matplotlib. For the multi-objective experiments, we
used mainly DEAP (Fortin et al., 2012), and QDpy
(Cazenille, 2018) with modification to implement the
cross over rate and mutation rate for the integration
with DEAP.
4 RESULTS
This section presents the experimental results from
the single and multi-objective approaches to address
the classification and feature selection of protein se-
quences of SARS-CoV-2.
4.1 Single-objective
In this set of experiments, we addressed first the fea-
ture selection and then the classification problem. The
classifier methods used are listed in Table 1 and the
techniques used for feature selection are (i) PCA, (ii)
75th-Perc, (iii) α-Best, and (iv) β-Best. ResNet is the
overall best classifier from all the single objective set
of experiments, particularly using PCA as the feature
selection technique. RF is the best classifier when us-
ing 75th−Perc, CNN is the best combined with α-
Best, and MNB with β-Best.
Table 3 shows a summary of the experimental re-
sults for accuracy performance. The table shows an
averaged performance using a stratified 5-fold cross-
validation for each combination.
The experimental results show a high performance
from all traditional machine learning methods tested.
The first three methods shown in the first section
of Table 3 are used for the multi-objective experi-
ments. The neural network-based methods perform
quite well, particularly the CNN and ResNet choices.
Table 3: Summary of the single objective classification ac-
curacy performance for the four feature selection techniques
in the columns and nine well known machine learning meth-
ods in the first section of the rows and three neural networks
based at the final section, best performance are bold.
Classifier PCA 75th-Perc α-Best β-Best
MNB 0.9569 0.9860 0.9928 0.9998
SGD 0.9792 0.9898 0.9968 0.9984
RF 0.9984 0.9934 0.9976 0.9988
KNN 0.9986 0.9916 0.9974 0.9986
GNB 0.9858 0.9639 0.9914 0.9914
LR 0.9940 0.9908 0.9938 0.9976
LSV 0.9620 0.9914 0.9896 0.9980
SVM-p 0.9930 0.7624 0.6412 0.8491
SVM-r 0.9936 0.9840 0.9828 0.9914
NN 0.9978 0.9926 0.9952 0.9990
CNN 0.9750 0.9926 0.9980 0.9990
ResNet 0.9990 0.9978 0.9990 0.9932
Multi-objective Classification and Feature Selection of Covid-19 Proteins Sequences using NSGA-II and MAP-Elites
1245
4.2 Multi-objective
In the second set of experiments, we selected just
three of the best classifiers from the first set of exper-
iments, and we addressed both feature selection and
the classification problem using a multi-objective ap-
proach. As an optimizer, we used two different al-
gorithms; (i) NSGA-II, and (ii) the quality-diversity
algorithm named as MAP-Elites (ME).
Table 4 summarizes the experimental results, and
the columns show the three traditional classifiers se-
lected from the single objective experiments. The
upper section of the table shows the averaged per-
formance results from the experiments using 200
features randomly selected for NSGA-II and ME.
Whereas, in the lower section of the table, the third
row shows the averaged performance results from the
experiments using all the features only for ME, with
100 individuals in the population (ME2-100), and the
fourth row shows the results using a similar config-
uration, but increasing the population size to 1,000
individuals (ME2-1000).
This comparison gives evidence that NSGA-II fo-
cuses on selecting a reduced number of features,
meanwhile ME focus more on finding more diverse
solutions with a higher number of features.
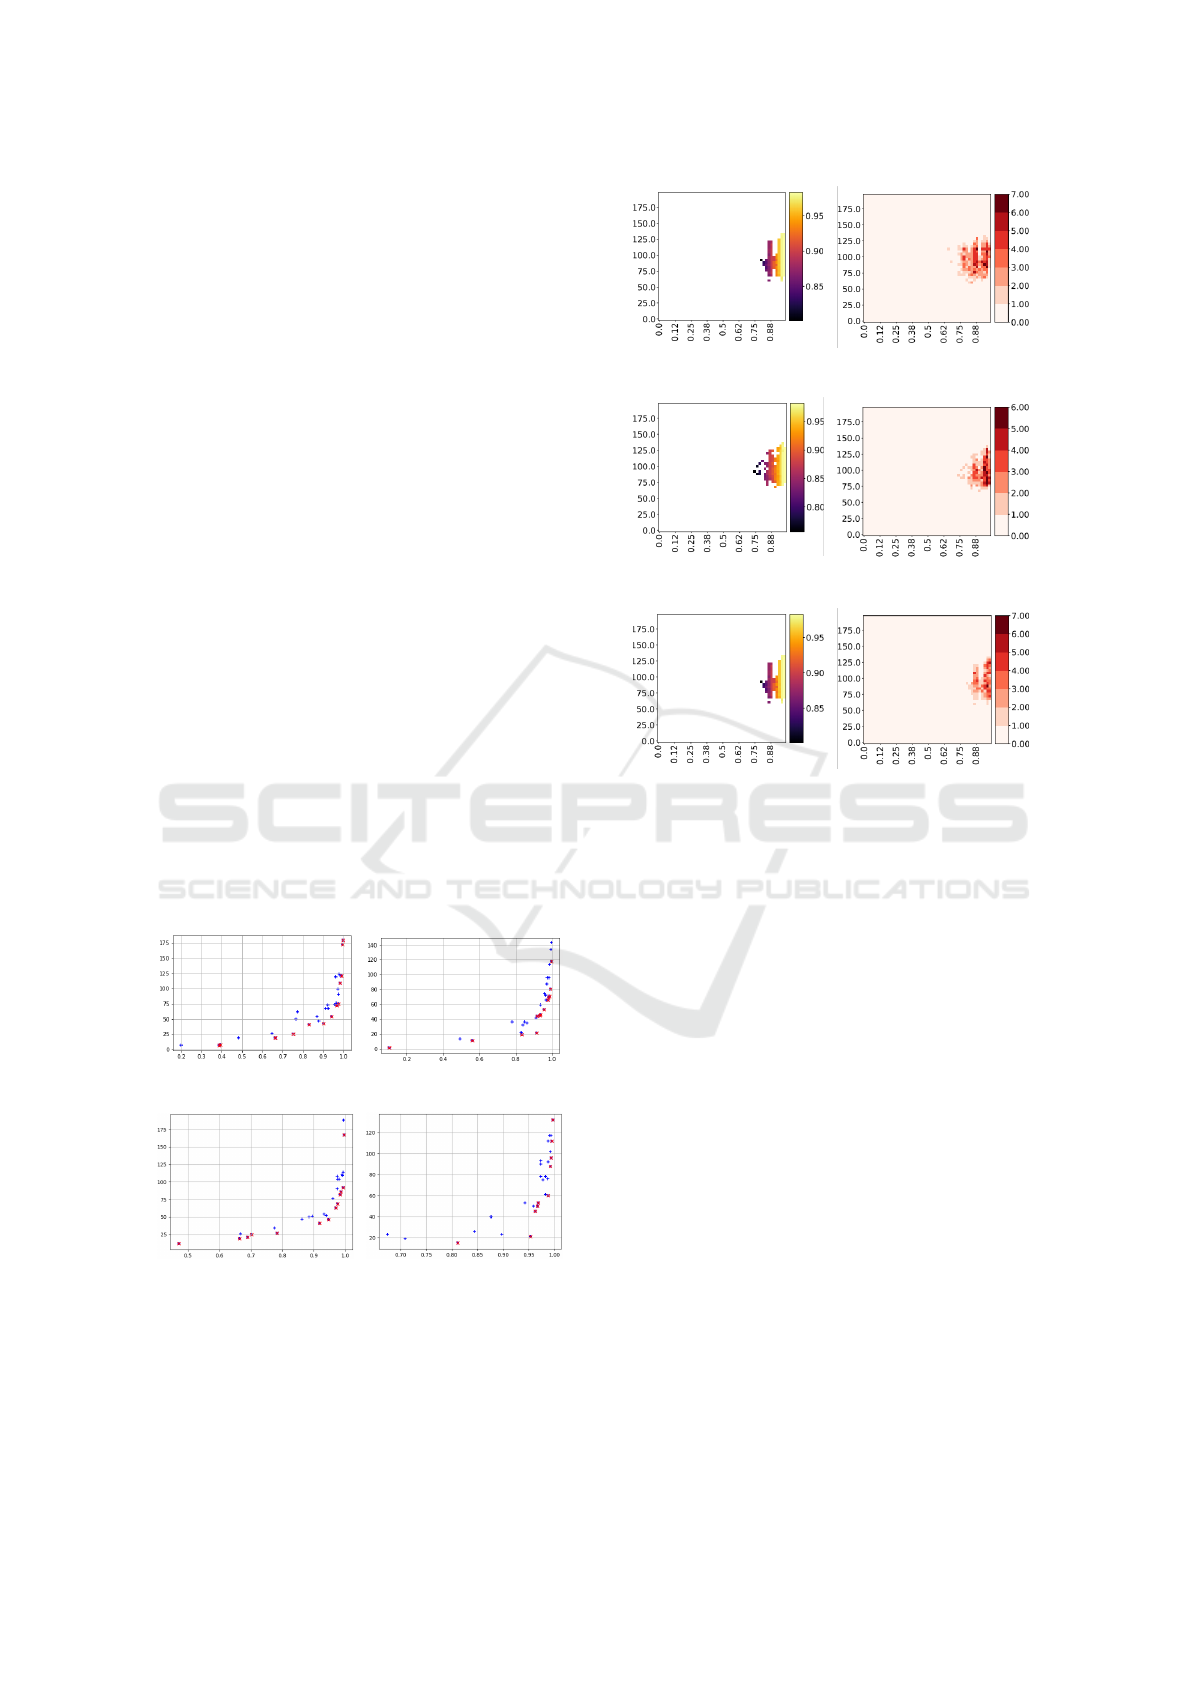
Furthermore, Figure 2 shows the quality and di-
versity containers from a typical run of ME, where
each row shows both containers from each classifier
used: MNB, SGD, and RF. The results of this experi-
ment considers 200 randomly chosen features.
(a) ME2-MNB-100 (b) ME2-MNB-1000
(c) ME2-SGD-100 (d) ME2-RF-100
Figure 1: Plots showing the Pareto front of a typical run
from ME using all features; the postfix stands for the num-
ber of individuals used.
The experimental results using the multi-objective ap-
proach, using either NSGA-II or ME, showed that ad-
dressing the selection feature and the accuracy at the
(a) Quality-MNB (b) Diversity-MNB
(c) Quality-SGD (d) Diversity-SGD
(e) Quality-RF (f) Diversity-RF
Figure 2: Illumination of the quality and diversity contain-
ers of ME from a typical run using 200 features randomly
chosen.
same time is better than the combination of the tradi-
tional machine learning methods and the feature se-
lection techniques using a single-objective approach,
but not better than the specific combination of MNB
classifier and β-Best feature selection technique.
This experiment shows that by increasing the
number of individuals in the population, ME searches
the space more uniformly and bring more diversity in
the solutions, reaching more than 95% of accuracy,
while selecting a low number of features.
In Figure 3, we can observe four sub-figures show-
ing in the columns the quality and diversity contain-
ers for ME and in the rows the plots for the classifier
used; the last row shows the plots for the choice of
using 1,000 individuals. In this experiment, we used
all the features available and the experimental results
show that the combination of ME and MNB get better
results as expected, and another benefit is the reduc-
tion of features selected to get this performance.
ICAART 2021 - 13th International Conference on Agents and Artificial Intelligence
1246

Table 4: Multi-objective averaged classification performance over 30 experimental runs for NSGA-II and MAP-Elites.
MNB SGD RF
Accuracy Features Accuracy Features Accuracy Features
NSGA-II 0.9801 ± 0.0000 37 ± 12 0.9815 ± 0.0004 48 ± 16 0.9815 ± 0.0004 25 ± 3
ME 0.9776 ± 0.0000 78 ± 6 0.9809 ± 0.0011 78 ± 4 0.9827 ± 0.0000 71 ± 4
ME-2 0.8305 ± 0.2000 70 ± 44 0.8952 ± 0.1300 72 ± 41 0.9403 ± 0.0802 68 ± 33
(a) Q-MNB, Ind:100 (b) D-MNB, Ind:100
(c) Q-SGD, Ind:100 (d) D-SGD, Ind:100
(e) Q-RF, Ind:100 (f) D-RF, Ind:100
(g) Q-MNB, Ind:1000 (h) D-MNB, Ind:1000
Figure 3: Illumination of the quality and diversity contain-
ers of ME from a typical run using all features. The first
three rows show the classifier with 100 individuals, and the
fourth row shows the containers of the MNB classifier using
1,000 individuals.
5 CONCLUSIONS
In this research work, we addressed the problem of
multi-classification and feature selection of protein
sequences of SARS-CoV-2 using single and multi-
objective approaches using the protein sequences as
coding regions. The pre-processing consisted of re-
moving duplicates and balancing the dataset. The
features used consisted of the normalized k-mer fre-
quency. In the first set of conventional experiments,
we used a single-objective approach addressing first
the feature selection and then the classification prob-
lem. For the feature selection, we used four tech-
niques for the feature selection and twelve well-
known machine learning classifier methods, nine tra-
ditional ones, and three neural network-based.
In the second set of experiments, we selected just
three of the best classifiers from the first set of exper-
iments and we addressed both feature selection and
the classification problem using a multi-objective ap-
proach. As an optimiser, we used two different algo-
rithms; (i) NSGA-II, and (ii) a quality-diversity algo-
rithm named as MAP-Elites. Furthermore, we imple-
mented the mutation and crossover rate on the QDpy
library to integrate it with DEAP.
The experimental results show that a combination
of conventional methods can be used to perform sep-
arately the feature selection first and then the clas-
sification, having good results. Furthermore, the re-
sults show that this problem can be successfully ad-
dressed as a multi-classification optimization problem
using a traditional evolutionary algorithm or a quality-
diversity algorithm, such as MAP-Elites.
NSGA-II shows that consistently selects fewer
features and getting a good classification perfor-
mance. On the other hand, MAP-Elites clearly shows
that explores better the search space and finds a wider
Pareto front, while getting competitive results. This
research shows that dimension reduction and multi-
classification can be applied on long RNA-based viral
genomic sequences and such a mechanism can be use
for diagnostic purposes.
There are several different directions to follow
from this research line, for instance, using protein se-
Multi-objective Classification and Feature Selection of Covid-19 Proteins Sequences using NSGA-II and MAP-Elites
1247

quences from other diseases and train models to iden-
tify correctly the samples with SARS-CoV-2. An-
other research line is to use genetic programming or
grammatical evolution to evolve classifiers and MAP-
Elites to keep a trade off between quality and diversity
in the solutions and compare the evolutionary meth-
ods against state-of-the-art machine learning, such as;
(i) gradient boosting, and (ii) least absolute shrinkage
and selection operator (LASSO).
ACKNOWLEDGEMENTS
This work was conducted with the financial sup-
port of the Science Foundation Ireland (SFI) Centre
for Research Training in Artificial Intelligence un-
der Grant No. 18/CRT/6223, by the research Grant
No. 16/IA/4605, and by Lero, the Irish Software
Engineering Research Centre (www.lero.ie). The
fourth author is partially financed by the Coordenac¸
˜
ao
de Aperfeic¸oamento de Pessoal de N
´
ıvel Superior -
Brasil (CAPES) - Finance Code 001.
REFERENCES
Abc7news (2020). ’extremely bogus’: Elon Musk
claims he tested positive and negative for
COVID-19. available: https://abc7news.com/
elon-musk-covid-tests-test-rapid-antigen-4/
7938369/ [accessed 16 Nov 2020].
Alberts, B., Johnson, A., Lewis, J., Morgan, D., Raff, M.,
Keith Roberts, P. W., et al. (2018). Molecular biology
of the cell.
Alkady, W., Zanaty, M., and Afify, H. M. (2020). Compu-
tational predictions for protein sequences of covid-19
virus via machine learning algorithms.
Bohr, A. and Memarzadeh, K. (2020). The rise of artificial
intelligence in healthcare applications. In Artificial In-
telligence in Healthcare, pages 25–60. Elsevier.
Cazenille, L. (2018). Qdpy: A python framework for
quality-diversity.
Chen, J., Antipov, E., Lemieux, B., Cede
˜
no, W., and Wood,
D. H. (1999). Dna computing implementing genetic
algorithms. Evolution as Computation, pages 39–49.
Cm.jefferson.edu. DNA and RNA. available: https://cm.
jefferson.edu/learn/dna-and-rna/ [accessed 16 Nov
2020].
Compeau, P. E., Pevzner, P. A., and Tesler, G. (2011). Why
are de bruijn graphs useful for genome assembly? Na-
ture biotechnology, 29(11):987.
Davis, L. (1991). Handbook of genetic algorithms.
Deb, K., Pratap, A., Agarwal, S., and Meyarivan, T. (2002).
A fast and elitist multiobjective genetic algorithm:
Nsga-ii. IEEE Transactions on Evolutionary Compu-
tation, 6(2):182–197.
Fortin, F.-A., De Rainville, F.-M., Gardner, M.-A., Parizeau,
M., and Gagn
´
e, C. (2012). DEAP: Evolutionary algo-
rithms made easy. Journal of Machine Learning Re-
search, 13:2171–2175.
Genome.gov. Protein. available: https://www.genome.gov/
genetics-glossary/Protein [accessed 17 Oct 2020].
Gorbalenya, A., Baker, S., Baric, R., de Groot, R., Drosten,
C., Gulyaeva, A., Haagmans, B., Lauber, C., Leon-
tovich, A., Neuman, B., Group, C. S., et al. (2020).
The species severe acute respiratory syndrome related
coronavirus: classifying 2019-nCoV and naming it
SARS-CoV-2. Nature Microbiology, 5(4):536–544.
Hamley, I. W. (2020). Introduction to Peptide Science. John
Wiley & Sons.
Kaehler, R. (2017). K-mer Analysis pipeline for Clas-
sification of DNA Sequences from Metagenomic
Samples. Master’s thesis, University of Mon-
tana, 32 Campus Drive Missoula, MT 59812, USA.
https://scholarworks.umt.edu/etd/10967.
Khailany, R. A., Safdar, M., and Ozaslan, M. (2020). Ge-
nomic characterization of a novel SARS-CoV-2. Gene
reports, page 100682.
Kim, D., Soo-Yong, S., In-Hee, L., and Byoung-Tak,
Z. (2002). Nacst/seq: A sequence design system
with multiobjective optimization. In International
Workshop on DNA-Based Computers, pages 242–251.
Springer.
Malik, Y. A. (2020). Properties of Coronavirus and SARS-
CoV-2. The Malaysian Journal of Pathology, 42(1):3–
11.
Mouret, J.-B. and Clune, J. (2015). Illuminating
search spaces by mapping elites. arXiv preprint
arXiv:1504.04909.
NCBI (2020). Protein Sequences for SARS-CoV-2. avail-
able: https://www.ncbi.nlm.nih.gov/labs/virus/vssi/#/
virus?SeqType
s=Protein [accessed 16 Nov 2020].
Prawira, N. A. (2020). Spam and scam detection through
text analysis.
Quinonez, B., Pinto-Roa, D. P., Garc
´
ıa-Torres, M., Garc
´
ıa-
D
´
ıaz, M. E., N
´
unez-Castillo, C., and Divina, F. (2019).
Map-elites algorithm for features selection problem.
In AMW.
Rachel, G. (2020). Potential COVID-19 vaccines
get a boost from machine learning. avail-
able: https://www.csail.mit.edu/news/potential-covid-
19-vaccines-get-boost-machine-learning [accessed 17
Oct 2020].
Randhawa, G. S., Soltysiak, M. P., El Roz, H., de Souza,
C. P., Hill, K. A., and Kari, L. (2020). Machine learn-
ing using intrinsic genomic signatures for rapid clas-
sification of novel pathogens: COVID-19 case study.
Plos one, 15(4):e0232391.
Romano, M., Ruggiero, A., Squeglia, F., Maga, G., and
Berisio, R. (2020). A Structural View of SARS-
CoV-2 RNA Replication machinery: RNA Synthesis,
Proofreading and Final Capping. Cells, 9(5):1267.
Solis-Reyes, S., Avino, M., Poon, A., and Kari, L. (2018).
An open-source k-mer based machine learning tool
for fast and accurate subtyping of hiv-1 genomes.
PLoS One, 13(11):e0206409.
Wetsman, N. (2020). Accuracy and precision. avail-
able: https://www.theverge.com/2020/4/9/21213730/
coronavirus-test-false-negative-results-isolation-
treatment [accessed 18 Nov 2020].
ICAART 2021 - 13th International Conference on Agents and Artificial Intelligence
1248
