
Classifying Excavator Collisions based on Users’ Visual Perception in the
Mixed Reality Environment
Viking Forsman
1
, Markus Wallmyr
1,2 a
, Taufik Akbar Sitompul
1,2 b
and Rikard Lindell
1 c
1
School of Innovation, Design and Engineering, M
¨
alardalen University, V
¨
aster
˚
as, Sweden
2
CrossControl AB, V
¨
aster
˚
as, Sweden
Keywords:
Mixed Reality, Visual Perception, Collision, Eye Tracking, Human-machine Interface, Excavator, Heavy
Machinery.
Abstract:
Visual perception plays an important role for recognizing possible hazards. In the context of heavy machinery,
relevant visual information can be obtained from the machine’s surrounding and from the human-machine
interface that exists inside the cabin. In this paper, we propose a method that classifies the occurring collisions
by combining the data collected by the eye tracker and the automatic logging mechanism in the mixed real-
ity simulation. Thirteen participants were asked to complete a test scenario in the mixed reality simulation,
while wearing an eye tracker. The results demonstrate that we could classify the occurring collisions based
on two visual perception conditions: (1) whether the colliding objects were visible from the participants’ field
of view and (2) whether the participants have seen the information presented on the human-machine interface
before the collisions occurred. This approach enabled us to interpret the occurring collisions differently, com-
pared to the traditional approach that uses the total number of collisions as the representation of participants’
performance.
1 INTRODUCTION
Measuring participants’ performance while complet-
ing certain evaluation scenarios has long been used
as a method to measure the effectiveness of infor-
mation systems (Nielsen and Levy, 1994; Fu et al.,
2002). The kind of performance data being col-
lected varies depending on the context of the study
and the information system being evaluated. Com-
pletion time, number of errors, and reaction time are
some frequently used metrics in the context of safety-
critical domains, including automotive (Albers et al.,
2020) and heavy machinery domains (Sitompul and
Wallmyr, 2019).
When using participants’ performance as the met-
ric to determine the effectiveness of information sys-
tems, designers and researchers need to be open
minded in interpreting the collected data, as there
could be various reasons that lead to such out-
come (Fu et al., 2002). For example, in many cases,
the number of errors was often taken as the face value
that represents participants’ performance (Cacciabue,
a
https://orcid.org/0000-0001-7134-9574
b
https://orcid.org/0000-0002-1930-4181
c
https://orcid.org/0000-0003-3163-6039
2004). While this approach is generally accepted and
any forms of errors should be avoided, it is impor-
tant to note that errors may occur due to various rea-
sons. For instance, the collision that occurred with
an occluded object, where the participant was com-
pletely unaware of the object’s presence. By under-
standing the underlying conditions behind an error,
designers and researchers could be more reflective in
interpreting the collected data. The better understand-
ing would hopefully help designers and researchers to
propose solutions for preventing errors in specific un-
derlying conditions.
In this paper, we classified the occurring collisions
in the context of heavy machinery based on two vi-
sual perception conditions: (1) whether the collid-
ing object was visible from the participants’ perspec-
tive, either centrally or peripherally, and (2) whether
the participants saw the visual supportive informa-
tion before the collisions occurred. We focused on
this issue, since visual perception ability plays a cru-
cial role for recognizing possible hazards (Jeelani
et al., 2017) and this ability varies among individu-
als (Ziemkiewicz et al., 2012). In the context of heavy
machinery, the relevant visual information can be ob-
tained from the machine’s surroundings and also from
Forsman, V., Wallmyr, M., Sitompul, T. and Lindell, R.
Classifying Excavator Collisions based on Users’ Visual Perception in the Mixed Reality Environment.
DOI: 10.5220/0010386702550262
In Proceedings of the 16th International Joint Conference on Computer Vision, Imaging and Computer Graphics Theory and Applications (VISIGRAPP 2021) - Volume 2: HUCAPP, pages
255-262
ISBN: 978-989-758-488-6
Copyright
c
2021 by SCITEPRESS – Science and Technology Publications, Lda. All rights reserved
255

the human-machine interface (HMI) that exists inside
the cabin (Sitompul and Wallmyr, 2019).
To facilitate the study, we used a mixed reality en-
vironment to simulate an excavator operation, where
the environment was virtual and projected onto the
wall, while the HMI and the controls were physical.
The HMI visualized warnings that indicated the pres-
ence of an object near the excavator. To measure
participants’ visual perception when a collision oc-
curred, we used the data from two sources: (1) an
eye tracker that recorded whether the participants saw
any warning shown by the HMI before the collision
occurred and (2) an automatic logging mechanism
implemented in the simulation that recorded whether
the colliding object was visible from the participants’
perspective. The timestamps from both sources were
then synchronized in order to combine the data.
2 RELATED WORK
To gain more insights on what happened in evalu-
ation scenarios, it is a common practice to collect
multiple kinds of data (Holzinger, 2005; Falkowska
et al., 2016), such as participants’ verbal feedback,
responses on subjective questionnaires, and partici-
pants’ physiopsychological status (e.g. eye movement
and brain electrical activity). Using multiple kinds of
data offers possibilities for designers and researchers
to understand participants’ behaviors, which are not
only limited to the final outcome, but also how they
arrived at such outcome (Ebling and John, 2000;
Brehmer and Munzner, 2013). However, the data
from different sources were often used as indepen-
dent metrics, where the data from different sources
were then compared to determine whether they sup-
ported or contradicted each other (Brehmer and Mun-
zner, 2013; Blascheck et al., 2016). This situation
does not only apply to studies that investigated tradi-
tional interfaces, but also applies to studies that eval-
uated immersive interfaces, including augmented re-
ality and virtual reality. See Dey et al. (2018) for the
review of evaluations methods used in augmented re-
ality studies and Karre et al. (2019) for the review of
evaluations methods used in virtual reality studies.
There are some combination approaches that have
been proposed so far (see ElTayeby and Dou (2016)
for the review). Pohl (2012) and Reda et al. (2014)
combined interaction logs and recordings from think
aloud protocols to help designers and researchers
to inspect what users were thinking when perform-
ing a task. Crowe and Narayanan (2000) combined
eye tracking data and interaction logs (using key-
boards and mouses) to investigate what steps that
users took and which visual stimuli that led to such
actions. Beck et al. (2015) proposed to synchronize
eye tracking data and recordings from think aloud
protocols to probe what users were seeing and think-
ing. Blascheck et al. (2016) extended the previous
approach by adding interaction logs using computer
mouses, in addition to eye tracking data and record-
ings from think aloud protocols. The combination
of three different sources could be used for analyz-
ing user behaviors when using visualization systems.
However, the proposed approaches mentioned above
were still limited to screen-based interfaces.
3 MIXED REALITY
SIMULATION
The mixed reality environment used in this study was
originally developed by Kade et al. (2016) using the
Unity game engine
1
. The images of the virtual envi-
ronment were projected using a head-worn projection
system onto the wall covered by the retroreflective
cloth (see No. 5 and No. 6 in Figure 1). The head-
worn projection system was made of two parts: (1) a
stripped-down laser pico projector, SHOWWX+from
Microvision, Inc., with an external battery pack (see
No. 8 in Figure 1) and (2) a Samsung S4+ smartphone
(see No. 7 in Figure 1) that hosted the virtual environ-
ment renderer and tracked the user’s head movement
using the built-in gyroscope sensor in the smartphone.
The laser projector had a native maximum resolution
of 848px × 480px @60Hz and a light emission of 15
lumen. This setup enabled the user to look around
within the virtual environment freely. In this study,
the distance between the user’s head and the wall was
around 2 meters.
3.1 Test Scenario
The test scenario was to drive an excavator through a
construction site, while trying to avoid any collisions
with construction workers, traffic cones, and other ob-
jects (see Figure 2). In total, there were two construc-
tion workers and 31 traffic cones along the passage in
the virtual environment. All these objects were static,
except for the second construction worker that con-
stantly walked back and forth over the passage. While
navigating through the passage, the participants were
also required to find three piles, which were made of
orange and grey cubes. The participants were asked
to knock down the orange cubes only, which were lo-
cated on top of these piles. To finish the scenario,
1
https://unity.com
HUCAPP 2021 - 5th International Conference on Human Computer Interaction Theory and Applications
256
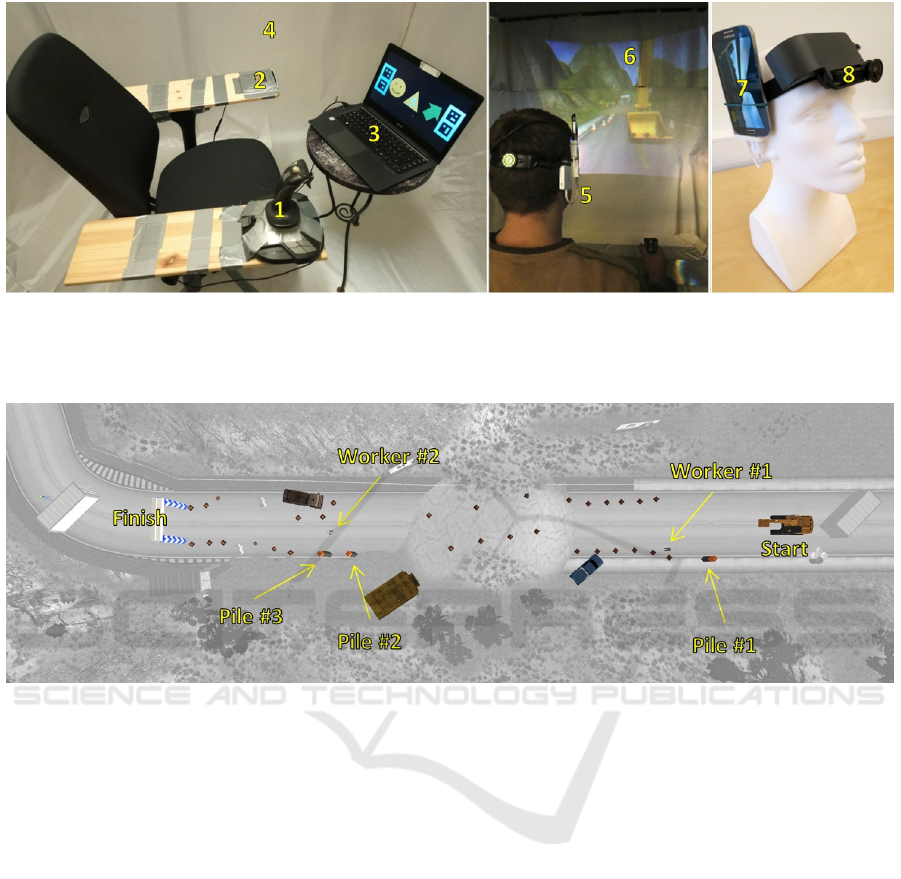
Figure 1: The mixed reality simulation consisted of a joystick (No. 1), a keyboard (No. 2), a laptop that served as the
human-machine interface (No. 3), the retroreflective cloth attached on the wall (No. 4), a head-worn projector (No. 5). The
head-worn projector consisted of a smartphone (No. 7), a laser projector (No. 8) with a 3D-printed box that hosted the battery.
The projected images could be seen on the retroreflective cloth (No. 6).
Figure 2: A bird’s eye view of the virtual environment. The obstacle objects, such as cones, were colored, while the environ-
ment was turned grayscale.
the participants were required to drive the excavator
through a gateway that served as the finish line. The
test scenario was designed to be difficult in order to
give the participants several observable challenges,
which could force their attention into several differ-
ent fields of focus. Nonetheless, it is also not rare for
excavators to be used in narrow spaces, for example,
in urban areas where obstacles may exist all around
the machine.
3.2 Human-machine Interface
To help the participants, the mixed reality simulation
was also equipped with an HMI in the form of a lap-
top monitor that was placed in front of the participants
(see No. 3 in Figure 1). The laptop monitor served as
a representation of head-down displays that usually
exist inside excavator cabins. The HMI displayed a
set of symbols intended to help users to navigate and
avoid collisions with the objects in the virtual envi-
ronment (see the left image in Figure 3). The symbols
were:
1. A green arrow that always pointed to which pile
of orange cubes that should be knocked down.
2. A yellow triangle warning that indicated that there
was an object nearby.
3. A red octagon warning that indicated that a colli-
sion was imminent to happen.
4. A yellow circle, which symbolized a face, that
appeared if the nearby object was a construction
worker.
The triangle warning, the octagon warning, and
the symbolized face were shown based on the distance
between the nearby object and the excavator. The yel-
low triangle warning was displayed when there was
an object near the excavator. When the excavator was
about to collide with the nearby object, the yellow
triangle warning was replaced with the red octagon
warning. The symbolized face was shown together
with the triangle warning or the octagon warning,
only if the nearby object was a construction worker.
See the right image in Figure 3 for the state diagram
Classifying Excavator Collisions based on Users’ Visual Perception in the Mixed Reality Environment
257

Figure 3: The left image shows the set of symbols presented on the HMI. The markers in the corners are used for enabling the
eye tracker to automatically detect whether the user has looked at the presented information. The right image shows a state
diagram, which illustrates how the HMI determines which information and when the information should be presented to the
user.
that shows how the HMI decided which information
to be shown to the user. These symbols were sur-
rounded by four markers that enabled the eye tracker
to perform surface tracking (see No. 3 in Figure 1 and
the left image in Figure 3). More information on the
surface tracking is described in Section 4.1.
4 PROPOSED DATA
COMBINATION METHOD
As briefly mentioned in Section 1, the proposed
method classified the occurring collisions using two
sources of data: an eye tracker and an automatic
logging mechanism implemented in the simulation.
Here, we describe how the data from both sources
were collected, and then synchronized.
4.1 Eye Tracking Data
The eye tracker used in this study was Pupil Core
from from Pupil Labs
2
. Pupil Core was a head-worn
eye tracker with two-eye cameras pointed towards the
user’s eyes and one front-facing camera that recorded
the view in the front of the user. In addition to cap-
turing users’ gaze, Pupil Core could also track a pre-
defined surface. In this study, the tracked surface was
defined with four square markers (see No. 3 in Fig-
ure 1). Each square marker contained a unique 5x5
grid pattern that the front-facing camera could iden-
tify automatically. Using the four markers, we were
able to automatically detect whether the user has seen
the warning shown on the HMI before a collision oc-
curred.
The eye tracker automatically logged the time in-
tervals when the user’s gaze was fixated within the
tracked surface regardless of the duration. The logs
were exported to a comma-separated values (CSV)
2
https://pupil-labs.com/products/core/
file that contained four kinds of information: (1) the
timestamp, (2) a Boolean value that indicated whether
the user’s gaze was inside the tracked surface, (3) the
position of the user’s gaze, and (4) a float value be-
tween 0.0 and 1.0 that indicated the certainty that the
position of the user’s gaze was correct. The value of
0.0 means the captured data from the eye tracker had
0% certainty, while the value of 1.0 means the cap-
tured data had 100% certainty.
There was another alternative to perform surface
tracking, which could be done by detecting whether
the user has perceived the colliding object from the
projected images of the virtual environment. How-
ever, this approach was not feasible due to the dif-
ferent frame rates between the eye tracker’s camera
and the projector in the head-worn projection system.
From the eye tracker’s view, some parts of the pro-
jected images were not visible due to the rolling black
bar effect, or also known as flickering.
4.2 Automatic Logging Data
Due to the technical limitation of the eye tracker men-
tioned in Section 4.1, it was not possible to check
whether the user has seen the colliding object from
the projected images of the virtual environment. To
compensate with this disadvantage, we used the view
frustum to determine the visibility of the colliding ob-
ject from the user’s perspective (see Figure 4 for some
examples). This approach allowed us to determine
whether the collision happened with an object that
was inside or outside the user’s field of view.
When a collision occurred, we recorded the visi-
bility of the colliding object by checking whether the
object was inside the view frustum or not, as shown
in Figure 4. The colliding object was classified as vis-
ible if it was inside the view frustum and there was
nothing that blocked the users’ sight (see the middle
image in Figure 4). The colliding object was clas-
sified as occluded if it was located outside the view
frustum (see the left image in Figure 4) or if it was
HUCAPP 2021 - 5th International Conference on Human Computer Interaction Theory and Applications
258
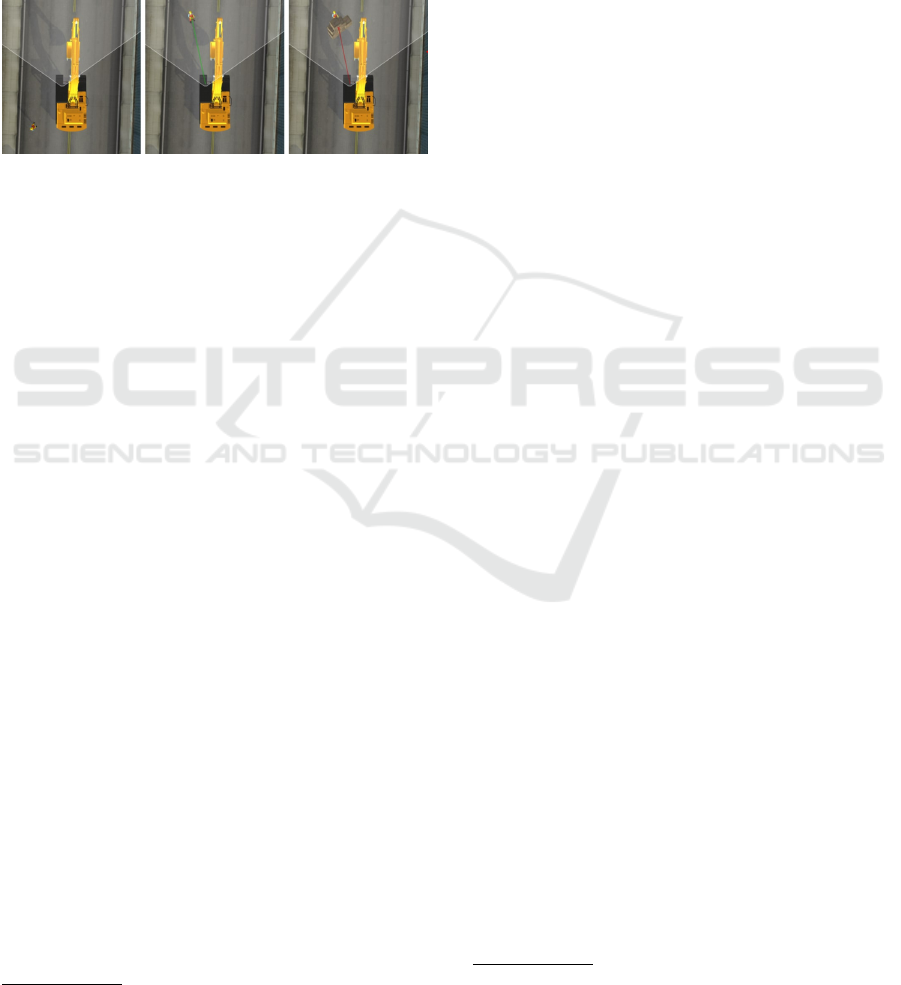
inside the view frustum, but there was something that
blocked the user’s line of sight (see the right image
in Figure 4). The visibility status of the colliding ob-
ject was determined and recorded in the time of im-
pact. Whenever a collision occurred, we also logged
some details from the HMI, such as which informa-
tion was presented on the HMI, when the information
was presented, and its duration. The automatic log-
ging mechanism was implemented using a custom C#
script integrated in the Unity game engine.
Figure 4: The images depict the excavator from the bird’s
eye view in three different situations. The left image shows
a worker that exists outside the view frustum, thus invisible
to the user. The middle image shows a worker that exists
inside the view frustum, thus visible to the user. The right
image shows that the worker exists within the view frustum,
but invisible to the user due to the occluding boxes.
4.3 Data Synchronization
The automatic logging mechanism reported its time
in seconds and milliseconds after the simulation was
started, and thus the timestamp always started from
0. However, the eye tracker used a separate system
for tracking time that counted the number of sec-
onds since the last PUPIL EPOCH
3
. The last PUPIL
EPOCH was set according to the last reboot time of
the computer that connected to the eye tracker. Us-
ing a C# script, we took the first timestamp that we
got from the eye tracker, and then subtracted it with
the value of the PUPIL EPOCH. This approach al-
lowed us to make the timestamps from the eye tracker
to start from 0 as well. This enabled us to synchronize
the data from the eye tracker and the automatic log-
ging mechanism. For each collision that occurred, we
could determine: (1) whether the colliding object was
visible from the user’s perspective and (2) whether the
user has seen the presented warning before the colli-
sion occurred.
5 EXPERIMENTAL PROCEDURE
To evaluate how our method could work in practice,
thirteen participants (ten males and three females)
3
https://docs.pupil-labs.com/core/terminology/#timing
from the university environment were asked to com-
plete the test scenario described in Section 3.1. The
age of the participants was between 26 and 70 years
old, while the median age was 31 years old. Two par-
ticipants had some experience with heavy machinery
operations. The participants did not receive any com-
pensation for taking parts in the experiment. An ethi-
cal approval was not required for this kind of experi-
ment according to the local law.
Before the experiment started, each participant
was informed about the purpose of the study, the
equipment that we used for the study, the test scenario
that they had to complete, and the data that we col-
lected. After we received the informed consent, each
participant was asked to equip the head-worn projec-
tion system and the eye tracker. The eye tracker was
then calibrated using the on-screen based calibration
software, called Pupil Capture
4
. After the calibration
has been performed correctly, each participant was
given a trial session where they got themselves famil-
iar with the excavator’s controls. The experiment was
started afterwards.
6 RESULTS
The method that we proposed in this paper classi-
fied the occurring collisions based on two visual per-
ception conditions: (1) whether the colliding objects
were visible from the participants’ field of view and
(2) whether the participants saw the supportive infor-
mation before the collisions occurred. Based on these
two conditions, the occurring collisions could be clas-
sified into four categories (see Figure 5):
1. The colliding object was visible and and one of
the warning was seen.
2. The colliding object was visible and no warning
was seen.
3. The colliding object was occluded and one of the
warning was seen.
4. The colliding object was occluded and no warning
was seen.
The majority of the collisions occurred when the
colliding objects were occluded and the participants
did not see the warnings shown on the HMI (see the
yellow bars in Figure 5). This finding indicates that
the participants were not aware of the presence of the
colliding objects and they also did not look at the in-
formation shown on the HMI that much. This finding
is aligned with prior research in the context of heavy
4
https://docs.pupil-labs.com/core/software/pupil-
capture/
Classifying Excavator Collisions based on Users’ Visual Perception in the Mixed Reality Environment
259
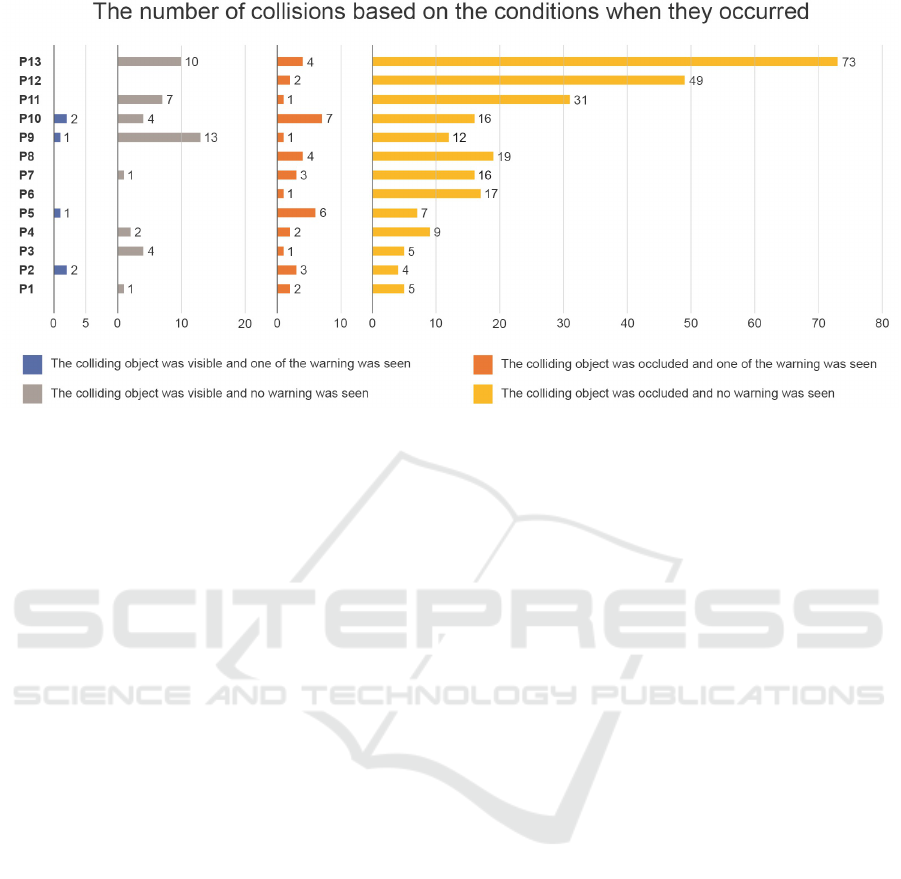
Figure 5: The number of collisions that occurred based on the underlying conditions when they occurred. The different colors
represent the various conditions when the collisions occurred. The X-axis represents the participants and the Y-axis represents
the number of collisions.
machinery, where operators paid little attention to
the information presented on the head-down display
inside the cabin (H
¨
aggstr
¨
om et al., 2015; Wallmyr,
2017; Szewczyk et al., 2020), since the head-down
display is usually placed far from operators’ line of
sight.
The second most common type of collisions is the
collisions that occurred with occluded objects, even
though the participants have seen one of the warnings
(see the orange bars in Figure 5). We have two as-
sumptions regarding this kind of collisions. The first
assumption is that there was very little time between
when the participants saw the warnings and when the
collision occurred. Therefore, there was not enough
time for the participants to avoid the collisions. The
second assumption is related to the quality of the
warnings. Although the warnings indicated that there
was an object nearby, they did not indicate the exact
position of the object. Therefore, it was possible that
the participants made the wrong action and collided
with the nearby object, even though they have seen
one of the warnings.
The third most common type of collisions is the
collisions that occurred with visible objects and the
participants did not see the presented information (see
the grey bars in Figure 5). However, only eight out
of thirteen participants who had this type of colli-
sions. Based on the visual perception’s perspective, it
could be due to a phenomenon called ”change blind-
ness”, where the participants failed to notice the vis-
ible and expected stimuli that existed in their field of
view (Jensen et al., 2011), which in this case was the
colliding object. There are many factors that could
lead to this phenomenon and one of the common fac-
tors is the changes in the field of view are not signif-
icant enough to what people are currently doing, and
thus they fail to detect those changes (Rensink et al.,
1997).
The least common type of collisions is the colli-
sions that occurred with visible objects and the partic-
ipants have also seen the presented information (see
the blue bars in Figure 5). From our perspective, this
is what we called as obvious errors, since the colliding
objects were visible from the participants’ perspective
and the information was seen as well, but the colli-
sions still occurred. However, as shown in Figure 5,
this type of collisions occurred very rarely, since the
number of collisions was very small and only four out
of thirteen participants who had this type of collisions.
This could also indirectly imply that the participants
were doing their best to complete the test scenario.
7 DISCUSSION
Our method utilized the occurrence of collisions as
the synchronization point between the data collected
by the eye tracker and the automatic logging mecha-
nism in the simulation. As such, the data were lim-
ited to the collisions that occurred in the test scenario.
It would also be interesting to update the method in
a way that enables us to determine how many colli-
sions were successfully avoided after looking at the
presented warning. By doing so, we could also deter-
mine the effectiveness of the HMI in aiding the par-
HUCAPP 2021 - 5th International Conference on Human Computer Interaction Theory and Applications
260

ticipants. For example, as shown in Figure 5, P1 and
P2 completed the test scenario with less than ten col-
lisions. With the current setup, it was not possible to
determine whether their performance was due to the
information shown on the HMI or they had some level
of expertise in using this kind of simulation. How-
ever, we were unable to incorporate this feature in
this study, since it was tricky to define the criteria of
collision avoidance. For example, since there were
multiple objects on both left and right sides along the
passage (see Figure 2), it was possible to avoid one
object, but accidentally hitting another object.
We believe that the proposed method is also ap-
plicable for other studies given that the following re-
quirements are fulfilled. Firstly, due to its nature, our
method is only suitable for studies within simulated
environments, where it is possible to fully record and
observe the event of interest. Although in this study
we used a mixed reality simulation, our method can
also be applied in a virtual reality simulation, given
that the headset being used has a built-in eye tracker,
such as Vive Pro Eye
5
. Secondly, here we used the oc-
currence of collisions as the trigger and the synchro-
nization point for both sources of data. Therefore, it is
best to assume that the proposed method would be ap-
plicable in studies where participants are expected to
make some errors. Thirdly, in order to use the method
as what we proposed here, there should be a support-
ive visualization system as part of the experimental
setup. Although the method could still be used with-
out a supportive visualization system as part of the
experimental setup, the collision classification would
be limited to whether the colliding object is visible
from the participant’s perspective.
8 CONCLUSION
In this study, we have classified the occurring col-
lisions based on the data from the eye tracker and
the automatic logging mechanism in the simulation.
The classification was made based on two visual per-
ception conditions: (1) the visibility of the collid-
ing objects from the participants’ perspective and
(2) whether the participants saw the information pre-
sented on the HMI before the collisions occurred.
This approach enabled us to interpret the occurring
collisions differently, compared to the traditional ap-
proach that directly interprets the total number of col-
lisions as the representation of participants’ perfor-
mance. As demonstrated in this study, the collisions
5
https://www.vive.com/eu/product/vive-pro-
eye/overview/
could occur due to different conditions. By under-
standing the underlying conditions behind the colli-
sions, designers and researchers could be more reflec-
tive when interpreting the collected data.
ACKNOWLEDGEMENTS
This research has received funding from CrossCon-
trol AB, the Swedish Knowledge Foundation (KK-
stiftelsen) through the ITS-EASY program, and the
European Union’s Horizon 2020 research and inno-
vation programme under the Marie SkłodowskaCurie
grant agreement number 764951.
REFERENCES
Albers, D., Radlmayr, J., Loew, A., Hergeth, S., Naujoks,
F., Keinath, A., and Bengler, K. (2020). Usability
evaluation—advances in experimental design in the
context of automated driving human–machine inter-
faces. Information, 11(5):240:1–240:15.
Beck, F., Blascheck, T., Ertl, T., and Weiskopf, D. (2015).
Exploring word-sized graphics for visualizing eye
tracking data within transcribed experiment record-
ings. In Proceedings of the First Workshop on
Eye Tracking and Visualization, pages 1–5, Chicago,
USA. ETVIS.
Blascheck, T., John, M., Koch, S., Bruder, L., and Ertl, T.
(2016). Triangulating user behavior using eye move-
ment, interaction, and think aloud data. In Proceed-
ings of the Ninth Biennial ACM Symposium on Eye
Tracking Research & Applications, ETRA ’16, pages
175–182, New York, USA. ACM.
Brehmer, M. and Munzner, T. (2013). A multi-level ty-
pology of abstract visualization tasks. IEEE Trans-
actions on Visualization and Computer Graphics,
19(12):2376–2385.
Cacciabue, P. C. (2004). Guide to Applying Human Factors
Methods: Human Error and Accident Management in
Safety-critical Systems. Springer, London, UK.
Crowe, E. C. and Narayanan, N. H. (2000). Comparing
interfaces based on what users watch and do. In Pro-
ceedings of the 2000 Symposium on Eye Tracking Re-
search & Applications, ETRA ’00, page 29–36, New
York, USA. ACM.
Dey, A., Billinghurst, M., Lindeman, R. W., and Swan, J. E.
(2018). A systematic review of 10 years of augmented
reality usability studies: 2005 to 2014. Frontiers in
Robotics and AI, 5:37.
Ebling, M. R. and John, B. E. (2000). On the contributions
of different empirical data in usability testing. In Pro-
ceedings of the 3rd Conference on Designing Inter-
active Systems: Processes, Practices, Methods, and
Techniques, DIS ’00, page 289–296, New York, NY,
USA. ACM.
Classifying Excavator Collisions based on Users’ Visual Perception in the Mixed Reality Environment
261

ElTayeby, O. and Dou, W. (2016). A survey on interac-
tion log analysis for evaluating exploratory visualiza-
tions. In Proceedings of the Sixth Workshop on Beyond
Time and Errors on Novel Evaluation Methods for Vi-
sualization, BELIV ’16, page 62–69, New York, NY,
USA. ACM.
Falkowska, J., Sobecki, J., and Pietrzak, M. (2016). Eye
tracking usability testing enhanced with EEG analy-
sis. In Design, User Experience, and Usability: De-
sign Thinking and Methods, pages 399–411, Cham,
Switzerland. Springer.
Fu, L., Salvendy, G., and Turley, L. (2002). Effectiveness
of user testing and heuristic evaluation as a function of
performance classification. Behaviour & Information
Technology, 21(2):137–143.
H
¨
aggstr
¨
om, C., Englund, M., and Lindroos, O. (2015). Ex-
amining the gaze behaviors of harvester operators: an
eye-tracking study. International Journal of Forest
Engineering, 26(2):96–113.
Holzinger, A. (2005). Usability engineering methods for
software developers. Communications of the ACM,
48(1):71–74.
Jeelani, I., Albert, A., and Gambatese, J. A. (2017). Why do
construction hazards remain unrecognized at the work
interface? Journal of Construction Engineering and
Management, 143(5):04016128.
Jensen, M. S., Yao, R., Street, W. N., and Simons, D. J.
(2011). Change blindness and inattentional blindness.
WIREs Cognitive Science, 2(5):529–546.
Kade, D., Wallmyr, M., Holstein, T., Lindell, R.,
¨
Urey, H.,
and
¨
Ozcan, O. (2016). Low-cost mixed reality sim-
ulator for industrial vehicle environments. In Virtual,
Augmented and Mixed Reality, pages 597–608, Cham,
Switzerland. Springer.
Karre, S. A., Mathur, N., and Reddy, Y. R. (2019). Us-
ability evaluation of VR products in industry: A
systematic literature review. In Proceedings of the
34th ACM/SIGAPP Symposium on Applied Comput-
ing, SAC ’19, page 1845–1851, New York, NY, USA.
ACM.
Nielsen, J. and Levy, J. (1994). Measuring usability: Pref-
erence vs. performance. Communications of the ACM,
37(4):66–75.
Pohl, M. (2012). Methodologies for the analysis of us-
age patterns in information visualization. In Proceed-
ings of the 2012 BELIV Workshop: Beyond Time and
Errors - Novel Evaluation Methods for Visualization,
pages 17:1–17:3, New York, NY, USA. ACM.
Reda, K., Johnson, A. E., Leigh, J., and Papka, M. E.
(2014). Evaluating user behavior and strategy during
visual exploration. In Proceedings of the Fifth Work-
shop on Beyond Time and Errors: Novel Evaluation
Methods for Visualization, BELIV ’14, page 41–45,
New York, NY, USA. ACM.
Rensink, R. A., O’Regan, J. K., and Clark, J. J. (1997). To
see or not to see: The need for attention to perceive
changes in scenes. Psychological Science, 8(5):368–
373.
Sitompul, T. A. and Wallmyr, M. (2019). Using augmented
reality to improve productivity and safety for heavy
machinery operators: State of the art. In the 17th In-
ternational Conference on Virtual-Reality Continuum
and Its Applications in Industry, VRCAI ’19, pages
8:1–8:9, New York, NY, USA. ACM.
Szewczyk, G., Spinelli, R., Magagnotti, N., Tylek, P., Sowa,
J. M., Rudy, P., and Gaj-Gielarowiec, D. (2020). The
mental workload of harvester operators working in
steep terrain conditions. Silva Fennica, 54(3).
Wallmyr, M. (2017). Seeing through the eyes of heavy vehi-
cle operators. In Human-Computer Interaction - IN-
TERACT 2017, pages 263–282, Cham, Switzerland.
Springer.
Ziemkiewicz, C., Ottley, A., Crouser, R. J., Chauncey, K.,
Su, S. L., and Chang, R. (2012). Understanding vi-
sualization by understanding individual users. IEEE
Computer Graphics and Applications, 32(6):88–94.
HUCAPP 2021 - 5th International Conference on Human Computer Interaction Theory and Applications
262
