
Method for Quantitative Assessment of the Eyes Pulse Blood Flow
with Linear Axisymmetric Model
Sergey B. Kazakov, Petr V. Luzhnov and Irina D. Davydova
Bauman Moscow State Technical University, Russian Federation
Keywords: Ophthalmoplethysmography, Oscillations Modelling, Diagnostic Algorithm, Eye, Blood Flow.
Abstract: The work examines a linear axisymmetric model of the eyes pulse blood flow. The main purpose of the
model is the determination of mathematical dependence of linear changes in the eye thickness of vascular
layer with the pulse. The main parameter is the volume of the input eye pulsation of blood flow. Ocular
hemodynamic parameters depend from various individual anatomical values of a patient's eye. In the paper
all assumptions of axisymmetric model are described. Calculations of the mathematical dependence
equation are based on geometric parameters of the eyeball. The analytical expression of volume changes in
the measuring ophthalmoplethysmography is presented. Accordance to our calculations, linear change in the
eyeball layers thickness varies within tens and units of microns after the input blood pulse volume.
Advanced technical methods that can register such a small range of length units are considered. Such a
registration and subsequent analysis of micro-displacement data will allow diagnosing different pathological
states of the eye hemodynamic in ophthalmology and neurology.
1 INTRODUCTION
Vascular factor is the essential and sometimes the
crucial aspect in the development of eye pathologies:
age-related macular degeneration (Mori F. et al.,
2001), diabetic retinopathy (Geyer O. et al., 1999;
Langham M.E. et al., 1989), glaucoma (Abegao
Pinto L. et al., 2016), circulatory disorders in the
retinal blood vessels (Tultseva S.N. et al., 2016). For
example, in the study of glaucoma, one theory has
been put forward that this pathology does not
contain only an increasing in intraocular pressure
(IOP). Moreover, it sometimes does not exclude a
violation of intraocular blood flow too. It was found
that at least 80% of people with increased IOP did
not develop optic nerve damage, while
approximately 30% of patients with glaucoma never
experienced increasing in IOP (Abegao Pinto L. et
al., 2016). These results allow us to understand that
one of the significant risk factors for such diseases is
a pathological change in the ocular hemodynamic
(Schmetterer L., Kiel J., 2012). Nowadays, current
technologies do not allow us to use reliable and
high-precision quantitative non-invasive
measurement of ocular pulse blood flow (Langham
M.E. et al., 1989).
Nevertheless, it is necessary to pay an attention
to the diagnostic calculations of eye blood
circulation due to using mathematical modelling in
order to improve its accuracy. New knowledge in the
field of eye hemodynamic will allow improving the
diagnostic algorithms of various eye diseases, to
create new therapeutic methods in ophthalmology
and neurology. Mathematical modelling of complex
ocular hemodynamics or its individual segments has
already been used to solve many different problems
(Shamaev D.M. et al., 2017). Even significantly
simplified models were useful for ophthalmologists.
We have already studied the hemodynamic
parameters of the eye in a normal, non-pathological
state in our previous work (Luzhnov P.V. et al.,
2020). Therefore, it is possible to form parameters
and technical characteristics of linear axisymmetric
model of the eyes pulse blood flow together with a
physical stand for ocular pulse modelling.
It is known that functional hemodynamic
changes are based on pathomorphological eye
conditions. The study of which can be useful in the
early diagnosis of eyes diseases. Thus, the purpose
of our work is the development of eye pulse
mathematical model. The main task of that model
will be the determination of mathematical
dependence of linear changes in the ocular
Kazakov, S., Luzhnov, P. and Davydova, I.
Method for Quantitative Assessment of the Eyes Pulse Blood Flow with Linear Axisymmetric Model.
DOI: 10.5220/0010385802390242
In Proceedings of the 14th International Joint Conference on Biomedical Engineering Systems and Technologies (BIOSTEC 2021) - Volume 1: BIODEVICES, pages 239-242
ISBN: 978-989-758-490-9
Copyright
c
2021 by SCITEPRESS – Science and Technology Publications, Lda. All rights reserved
239
geometrical sizes on the volume of the input eye
blood pulsation.
2 MATERIALS AND METHODS
The simplest linear axisymmetric model was chosen
for modelling the ocular hemodynamics. The main
assumptions of this model are presented below:
• The eyeball is considered as an object
isolated from surrounding biological tissues.
• The simplest model of the eye vascular layer
is an isotropic thin-walled spherical shell
with a thickness d, with a constant inner
radius R
1
and variable outer radius R
2
.
• The incompressible vitreous body is inside
the spherical shell.
• The eye anterior-posterior axis is D (23.0
mm). The initial value of the external radius
R
2
of the eye vascular layer is D/2 mm.
• The initial thickness of the eye vascular layer
d is 70.0 mm.
• The elasticity coefficient of a thin-walled
spherical shell must be ignored.
• The input volumes of eye blood flow
pulsation are set as constant data ∆Q. ∆Q is
the volume of input ocular blood flow
pulsation.
• The vascular layer of the eye is modelled as a
shaded shell that has an inner radius R
1
and
an outer radius R
2
.
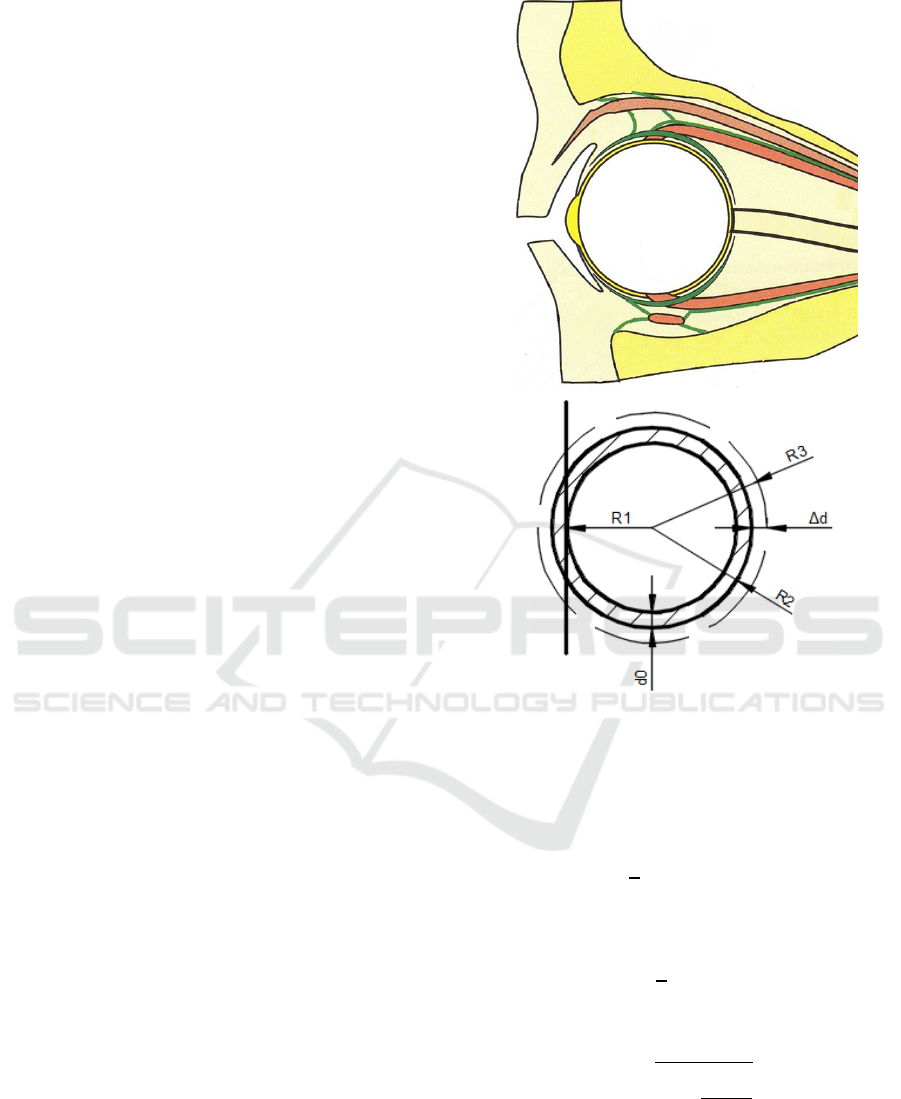
In our model (see Fig.1) d
0
– the initial thickness
of the eye vascular, R
1
– the constant inner radius of
eye vascular layer, ∆d – the linear change in the
thickness of eye vascular layer, R
2
– the outer radius
of eye vascular layer, R
3
– the outer radius of eye
vascular layer after the volume of the input eye
pulsation of blood flow.
The main task of this model is the determination
of mathematical dependence of linear changes in the
eye thickness of vascular layer on the volume of the
input eye pulsation of blood flow.
The ophthalmoplethysmography method was
chosen as a method of recording and measuring the
variations in volume of the eyeball. Therefore, it was
necessary to determine the dependence of the
volume changes in the measuring chamber (i.e. in
the measuring eyecup) on the changes in the linear
size of our linear axisymmetric model.
Figure 1: Linear axisymmetric model of the eyeball.
Firstly, it is necessary to output an analytical
equation that defines the value of the outer radius of
eye vascular layer R
3
(see Fig.1). The initial volume
of the vascular layer V
0
is defined as
𝑉
=
4
3
𝜋∙(𝑅
− 𝑅
)
(1)
The volume of the vascular layer after the input
ocular pulsation of blood flow is defined as
𝑉
+∆𝑄=
4
3
𝜋∙(𝑅
− 𝑅
)
(2)
Due to this equation it is possible to determine
the outer radius of eye vascular layer:
𝑅
=
𝑅
+
3∙∆𝑄
4𝜋
(3)
Finally, due to previous calculations it is possible
to determine the linear change in the thickness of the
eye vascular layer, which is determined by the
following equation:
NDNSNT 2021 - Special Session on Non-invasive Diagnosis and Neuro-stimulation in Neurorehabilitation Tasks
240
𝑑=
𝑅
+
3∙∆𝑄
4𝜋
−𝑅
+𝑑
(4)
It is the value of the thickness of the vascular
layer after the input eye pulsation.
Secondly, it is necessary to output analytical
dependence of the change in the volume of the
measuring eyecup on the change in the linear size of
the thickness of the eye vascular layer. It can be
accomplished due to the equation for calculating the
volume of the ball segment
∆𝑉=𝜋∙ 𝑅
∙(
𝑅
+
3∙∆𝑄
4𝜋
− 𝑅
)
(5)
The volume of the measuring eyecup ∆V will
change as much as the volume of the segment of the
eyeball, which immersed in this measuring chamber.
3 RESULTS
Thus, by setting various individual values of a
patient:
• The value of the anterior-posterior axis of an
eye D (in mm).
• The volume of input ocular blood flow
pulsation ∆Q (in µl).
And, moreover, considering that d
0
is given as
the set of constant: d
1
, d
2
, d
3
, it will be possible to
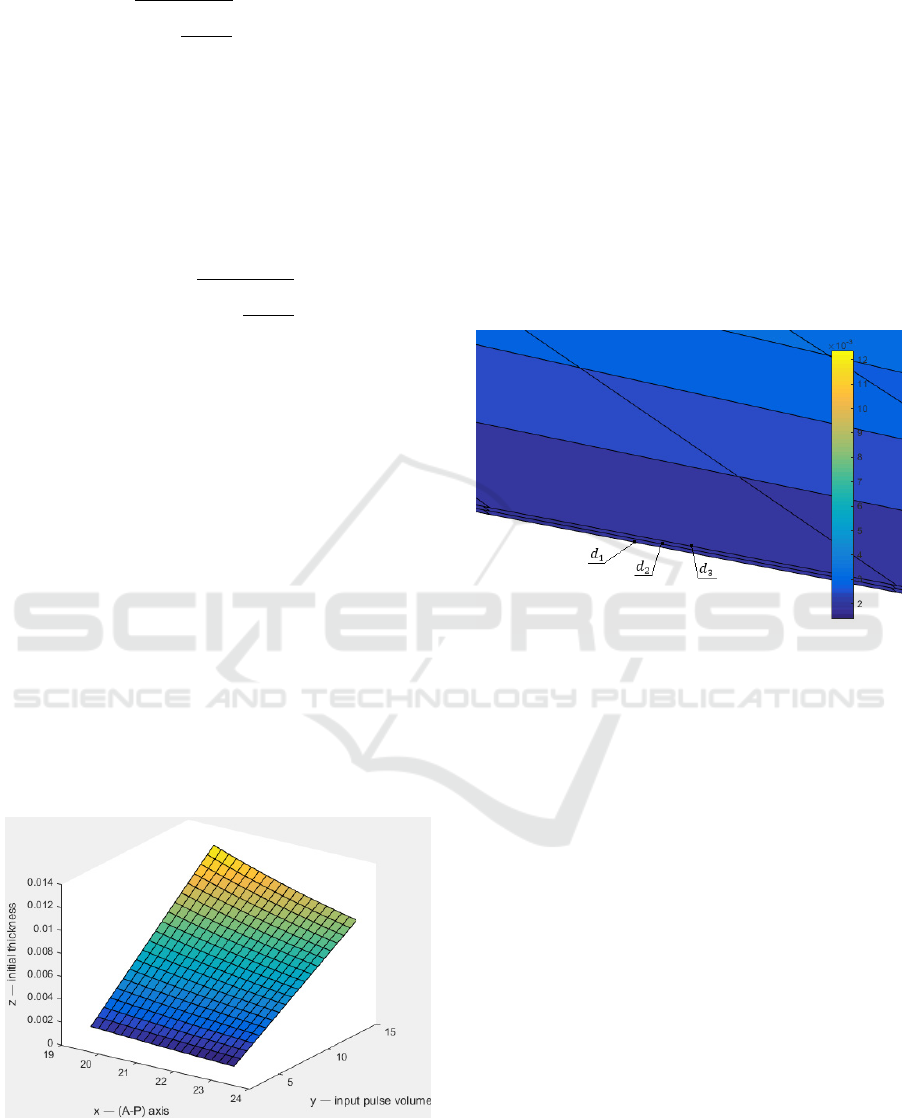
display on a three-dimensional graph the
dependence of the final thickness of the eye vascular
layer on the previous values (see Fig.2).
Figure 2: Graph of the dependence of linear changes in the
thickness of the eye vascular layer on the individual values
of a patient: the A-P axis of the eye, the value of the input
pulse volume, the initial thickness of the eye.
The necessary ranges of changes in values were
taken from the following literature sources. The
values of the eye anterior-posterior (A-P) axis are in
the range of 19.69 to 23.50 mm. The average value
is 21.60 mm. In the work (Tultseva S. N. et al.,
2017) the values of normal systolic increase in pulse
volume are ranged from 2.35 µl to 14.96 µl. The
average value is 7.27 µl. The values of constant are:
d
1
=0.065 µm, d
2
=0.070 µm, d
3
=0.075 µm.
Due to the equation (4), which defines the plane,
a three-dimensional graph was constructed for a
variable parameter d
0
(see Fig. 2).
At a large approximation three planes are visible
at different values of the Fig. 2 (see Fig. 3).
Figure 3: Approximate view of linear changes in the
thickness of the eye vascular layer.
Verification of our linear axisymmetric model
can be made by a technique which is described in
previous work (Kiseleva A.A. et al., 2020).
4 DISCUSSION AND
CONCLUSIONS
Accordance to our calculations, linear changes in the
eye thickness of vascular layer after the input pulse
volume varies within tens and units of µm.
Nowadays, there are several advanced technical
methods which can register such a range of length
units.
In the work (Zhu T. et al., 2012) the
development of fiber-optic sensors (FOS) is
considered. The vast majority FOS obtain an
external primary converter. Such a scheme works
when measured physical quantity (pressure,
temperature, acceleration, etc.) causes a mechanical
movement of a certain sensitive element (for
example, a membrane or an inertial mass), which in
Method for Quantitative Assessment of the Eyes Pulse Blood Flow with Linear Axisymmetric Model
241

turn leads to a modulation of the light intensity.
Movements in the FOS can be recorded by using an
interferometric measuring circuit. One of the
simplest devices of such a type can be considered a
fiber-optic end interferometer (FOEI). During using
quartz single-mode fiber and laser with emission
wavelength of 1.55 µm in FOEI, range of detected
linear motion of the mirror relative to the end face of
the optical fiber is in the range from 0.000025 µm to
640 µm, with an accuracy of ±0.000025 µm.
Moreover, there are methods for registering both
vibrations and displacement of surfaces using laser
radiation that directly probes a biological object. For
example, in work (Casaccia S. et al., 2015) describes
the technique of laser Doppler myography (LDM),
which is used as a non-contact method for
measuring the signal of mechanomyography (MMG)
from the biceps of a shoulder. The LDM signal was
measured by using a Polytec PDV100 laser Doppler
vibrometer, which uses a laser beam with a
wavelength of 633 nm, which corresponds to the
second class of the laser equipment (harmless to the
eye). Polytec PDV100 obtains the following
technical characteristics: a wide range of
measurement parameters of frequency fluctuations
from infra-low 0.05 Hz to ultrasonic 22 kHz,
measurement accuracy ±0.05 mm/s.
The methods described above and our linear
axisymmetric model will allow us to measure linear
displacements in the necessary range of length units.
CONFLICT OF INTEREST
The authors declare that they have no conflict of
interest.
REFERENCES
Abegao Pinto L., Willekens K., Van Keer K. et al., 2016.
Ocular blood flow in glaucoma. the Leuven Eye
Study. Acta Ophthalmol. 94, pp.592–598. doi:
10.1111/aos.12962.
Casaccia S., Scalise L., 2015. Non-contact assessment of
muscle contraction: Laser Doppler Myography. IEEE
International Symposium on Medical Measurements
and Applications (MeMeA 2015) Proceedings,
pp.453–467. doi: 10.1109/MeMeA.2015.7145276.
Geyer O., Neudorfer M., Snir T., et al., 1999. Pulsatile
ocular blood flow in diabetic retinopathy. Acta.
Ophthalmol. Scand. 5, pp.522–525, doi: 10.1034/j.16
00-0420.1999.770507.x.
Kiseleva A.A., Luzhnov P.V., Shamaev D.M., 2020.
Verification of Mathematical Model for Bioimpedance
Diagnostics of the Blood Flow in Cerebral Vessels.
Advances in Intelligent Systems and Computing, 902,
pp.251-259. doi: 10.1007/978-3-030-12082-5_23
Langham M.E., Farell R.A., O’Brien V. et al., 1989.
Blood flow in the human eye. Acta Opthalmol. pp.9–
13. doi: 10.1111/j.1755-3768.1989.tb07080.x.
Luzhnov P. V., Kazakov S. B., Davydova I. D., 2020.
Stand Development for Modeling and Study of Ocular
Blood Filling Oscillation. 2020 Ural Symposium on
Biomedical Engineering, Radioelectronics and
Information Technology (USBEREIT), pp.211–214.
doi: 10.1109/USBEREIT48449.2020.9117773.
Mori F., Konno S., Hikichi T., et al., 2001. Pulsatile ocular
blood flow study: decreases in exudative age related
macular degeneration. Br J Ophthalmol. 5, pp.531–
533. doi: 10.1136/bjo.85.5.531.
Schmetterer L., Kiel J. Ocular Blood Flow. Springer,
2012.
Shamaev D.M., Luzhnov P.V., Iomdina E.N., 2017.
Modeling of ocular and eyelid pulse blood filling in
diagnosing using transpalpebral rheoophthalmo-
graphy. IFMBE Proceedings 65, pp.1000–1003. doi:
10.1007/978-981-10-5122-7_250
Tultseva S. N., Titarenko A. I., Rukhovets A. G., 2016.
Characteristics of systemic and regional
hemodynamics in ischemic retinal vein occlusion in
young and middle-aged adults. Regionarnoe
krovoobrashchenie i mikrocirkulyaciya, 2(58), pp.24–
31. doi: 10.24884/1682-6655-2016-15-2-24-31.
Tultseva S.N., Titarenko A. I., Rukhovets A. G., 2017.
Eye hemodynamics in young and middle-aged patients
with retinal vein occlusion. The Scientific Notes of the
I. P. Pavlov St. Petersburg State Medical University,
24(4), pp.29–34. doi: 10.24884/1607-4181-2017-24-4-
29-34.
Zhu T. et al., 2012. In-line fiber optic interferometric
sensors in single-mode fibers. Sensors, 12, pp.10430–
10449. doi: 10.3390/s120810430.
NDNSNT 2021 - Special Session on Non-invasive Diagnosis and Neuro-stimulation in Neurorehabilitation Tasks
242
